
欧州の非乳製品ヨーグルト:市場シェア分析、産業動向・統計、成長予測(2025年~2030年)
Europe Non-dairy Yogurt - Market Share Analysis, Industry Trends & Statistics, Growth Forecasts (2025 - 2030)- 発行日
- ページ情報
- 英文 181 Pages
- 納期
- 2~3営業日
- 商品コード
- 1683841
- カスタマイズ可能 お客様のご希望に応じて、既存データの加工や未掲載情報(例:国別セグメント)の追加などの対応が可能です。詳細はお問い合わせください。
- 適宜更新あり 本レポートは最新情報反映のため適宜更新し、内容構成変更を行う場合があります。ご検討の際はお問い合わせください。
- 翻訳ツール提供対象 PDF対応AI翻訳ツールの無料貸し出しサービスのご利用が可能です
概要
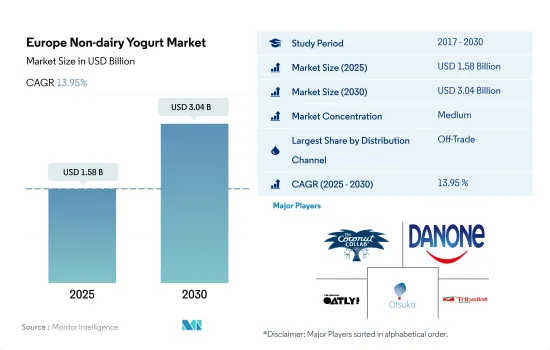
欧州の非乳製品ヨーグルト市場規模は2025年に15億8,000万米ドルと推定・予測され、2030年には30億4,000万米ドルに達し、予測期間(2025年~2030年)のCAGRは13.95%で成長すると予測されます。
ハイパーマーケットやオンラインストアを含む近代的な食料品小売業の台頭が、商取引外チャネルを通じた販売を促進
- 欧州の非乳製品ヨーグルト市場の流通チャネルを支配しているのは非売品セグメントです。これは主にスーパーマーケットとハイパーマーケットによる高い売上が原動力となっています。これらのチャネルの近接要素は、市場にある非乳製品ヨーグルトを含む幅広い製品の中から消費者の選択に影響を与えることにより、付加的な利益を与えています。2022年には、スーパーマーケットとハイパーマーケットが金額ベースで63.5%の主要シェアを占めました。これらの小売チャネルは、提供されるブランドの幅広い品揃え、かなりの棚スペース、頻繁な価格プロモーションにより、強い地位を占めています。世界の主要小売業者が採用するオムニチャネル・アプローチが、非乳製品ヨーグルト市場を牽引しています。
- オンラインチャネルのサブセグメントが急成長しています。予測期間中のCAGRは25.8%を記録し、2023年と比較して2028年には130%以上の成長が見込まれています。eコマースの成長により、企業は非乳製品ヨーグルトのより大きなターゲット市場にアクセスし、顧客のニーズに効果的に応えることができるようになりました。2021年には、全欧州諸国の中で、ドイツが6,210万人のオンライン買い物客で最も大きなeコマース消費者基盤を持ち、英国とフランスがそれぞれ5,000万人と4,470万人で続いた。
- 国別では英国がトップで、2022年には19.68%という大きなシェアを占める。これは主に、菜食主義者の食事や製品に対する需要の高まりによるもので、小売チャネルでの植物性ヨーグルトの販売につながりました。2021年には、消費者の20%近くが植物性ヨーグルトをさらに購入しました。2020年1月から2021年にかけて、英国のオンライン食品宅配会社Deliverooは、ビーガンの持ち帰り注文が163%増加したことを記録しました。
英国はこの地域における非乳製品ヨーグルトの消費に大きな役割を果たしています。
- 欧州における非乳製品ヨーグルトの需要は、2022年と比較して2025年には61.4%の成長が見込まれます。消費者は植物性ヨーグルトの健康と持続可能性の利点に惹かれています。
- 植物性ヨーグルトのメーカーは、様々なフレーバーを発売することで製品のイノベーションに注力しており、これが欧州における植物性ヨーグルトの需要を高めています。2021年現在、西欧は発売の点で世界的に最も活発な地域です。360以上の植物性ヨーグルトが発売され、世界全体の発売の66%を占めました。
- 国別では、英国がこの地域の主要な非乳製品ヨーグルト市場です。英国では、菜食主義者の数が増加しており、国民のほとんどがフレキシタリアンであると考えているため、肉の消費を減らしたいと考えています。2022年現在、英国のビーガン人口は2020年比で200万人以上増加し、ビーガン人口の132%を占める。非乳製品ヨーグルトの販売額は、2021年と比較して2022年には22.7%増加しました。
- フランスは同地域における非乳製品ヨーグルトの第2位の市場です。フランスにおける植物性ヨーグルトの前年比成長率は、2022年と比較して2024年には43.9%の成長が見込まれます。植物由来の食品は、より多くの菜食主義食品を食べることがより健康的で環境にとってより持続可能であると考える若年層や都市部の消費者の間で最も売れる傾向があります。2021年から2022年にかけて、18歳から19歳のフランス人の約12%がビーガン食を実践していると回答しました。
欧州の非乳製品ヨーグルト市場動向
非乳製品人気の高まりとともに、業界で起きているイノベーションが非乳製品ヨーグルトの消費を促進しています。
- 欧州における非乳製品ヨーグルトの一人当たり消費量は増加しています。植物性ヨーグルトのメーカーは、新製品のイノベーションを通じて需要の拡大に対応し、様々なフレーバーや嗜好品を発売しており、消費を後押ししています。西欧は、非乳製品ヨーグルトの発売という点で世界的に最もダイナミックな地域です。2021年には360種類以上の植物性ヨーグルトが発売され、この地域は世界全体の発売数の66%を占めました。ドイツ、フランス、イタリアは、非乳製品ヨーグルトの一人当たり消費量が最も高いです。ドイツを中心に乳製品代替品の人気が高まっていることが、植物性ヨーグルトの急成長につながりました。2021年には1,200万人以上の観光客がドイツを訪れ、国内外での菜食主義の高まりにより植物性ヨーグルトの需要を押し上げています。
- 英国政府は、食料品店や小売店の棚、eコマースストアに並ぶ製品を、塩分、糖分、脂肪分が高い、あるいは健康的でない製品や飲料とともに制限する規制を設けています。この要因は、従来のヨーグルトに代わる健康的な選択肢として、非乳製品ヨーグルトを選ぶ人々に影響を与えています。非乳製品プロバイオティクス製品は、ビーガン食品へのシフトが進行していることや、欧州の人々の間で乳糖不耐症が急増していることに伴い、重要性を増しています。これらの動向は、非乳製品ヨーグルトの浸透を高めると予想され、この地域の重要なプレーヤーは、進化する消費者動向を捉えるために、低糖/無糖のような謳い文句で、製品革新のための研究開発活動に絶えず投資するようになります。
欧州の非乳製品ヨーグルト産業の概要
欧州の非乳製品ヨーグルト市場は適度に統合されており、上位5社で58.81%を占めています。この市場の主要企業は以下の通り。 Coconut Collaborative Ltd, Danone SA, Oatly Group AB, Otsuka Holdings and Triballat Noyal SAS(sorted alphabetically).
その他の特典
- エクセル形式の市場予測(ME)シート
- 3ヶ月のアナリストサポート
目次
第1章 エグゼクティブサマリーと主な調査結果
第2章 レポートのオファー
第3章 イントロダクション
- 調査の前提条件と市場定義
- 調査範囲
- 調査手法
第4章 主要産業動向
- 一人当たり消費量
- 原材料/商品生産
- 代替乳製品-原材料生産
- 規制の枠組み
- フランス
- ドイツ
- イタリア
- スペイン
- 英国
- バリューチェーンと流通チャネル分析
第5章 市場セグメンテーション
- 流通チャネル
- オフトレード
- サブ流通チャネル別
- コンビニエンスストア
- オンライン小売
- 専門店
- スーパーマーケットとハイパーマーケット
- その他(倉庫クラブ、ガソリンスタンドなど)
- オフトレード
- 国名
- ベルギー
- フランス
- ドイツ
- イタリア
- オランダ
- ロシア
- スペイン
- 英国
- その他の欧州
第6章 競合情勢
- 主要な戦略動向
- 市場シェア分析
- 企業情勢
- 企業プロファイル(世界レベルの概要、市場レベルの概要、主要な事業セグメント、財務、従業員数、主要情報、市場ランク、市場シェア、製品・サービス、最近の動向分析を含む)。
- Blue Diamond Growers
- Califia Farms LLC
- Coconut Collaborative Ltd
- Danone SA
- Ecotone
- Oatly Group AB
- Otsuka Holdings Co. Ltd
- The Hain Celestial Group Inc.
- Triballat Noyal SAS
- Valsoia SpA
- Yoso Brands
第7章 CEOへの主な戦略的質問
第8章 付録
- 世界の概要
- 概要
- ファイブフォース分析フレームワーク
- 世界・バリューチェーン分析
- 市場力学(DROs)
- 情報源と参考文献
- 図表一覧
- 主要洞察
- データパック
- 用語集
目次
The Europe Non-dairy Yogurt Market size is estimated at 1.58 billion USD in 2025, and is expected to reach 3.04 billion USD by 2030, growing at a CAGR of 13.95% during the forecast period (2025-2030).
Rise in modern grocery retailing including hypermarkets and online stores fuels the sales through off-trade channels
- The off-trade segment dominates the distribution channels of the European non-dairy yogurt market. This is primarily driven by the high sales generated by supermarkets and hypermarkets. The proximity element of these channels gives them an added benefit by influencing the consumer's choice among the wide range of products, including non-dairy yogurt, in the market. In 2022, supermarkets and hypermarkets accounted for a major share of 63.5% by value. These retail channels have a strong position due to the wide selection of brands offered, considerable shelf space, and frequent price promotions. The omnichannel approach adopted by major retailers worldwide drives the non-dairy yogurt market.
- The online channel sub-segment is growing rapidly. It is anticipated to register a CAGR of 25.8% during the forecast period, and it is expected to grow by more than 130% in 2028 compared to 2023. The growth of e-commerce has enabled companies to access a larger target market for non-dairy yogurt and effectively serve customer needs. In 2021, among all European countries, Germany had the most significant e-commerce consumer base, with 62.1 million online shoppers, followed by the United Kingdom and France, with 50 million and 44.7 million individuals, respectively.
- In terms of country, the United Kingdom is the leading country, occupying a significant share of 19.68% in 2022. This is mainly due to the rising demand for a vegan diet and products, which led to the sales of plant-based yogurt in retail channels. In 2021, nearly 20% of consumers bought more plant-based yogurt. Between January 2020 and 2021, UK online food delivery company, Deliveroo recorded that its vegan takeaway orders shot up by 163%.
United Kingdom plays a major role in the consumption of non-dairy yogurt in the region
- The demand for non-dairy yogurt in Europe is anticipated to grow by 61.4% in 2025 compared to 2022. Consumers are drawn toward the health and sustainability benefits of plant-based yogurt.
- Manufacturers of plant-based yogurt are majorly focused on product innovations by launching a variety of flavors, which is increasing the demand for plant-based yogurt in Europe. As of 2021, Western Europe was the most dynamic region globally in terms of launches. It witnessed the launch of more than 360 plant-based yogurts, accounting for 66% of all launches globally.
- By country, the United Kingdom is the region's leading non-dairy yogurt market. In the United Kingdom, the number of vegans is growing, and most of the population wants to reduce meat consumption as they consider themselves flexitarians. As of 2022, the number of vegans in the United Kingdom increased by more than 2 million, accounting for 132% of the vegan population, compared to 2020. The sales value of non-dairy yogurt increased by 22.7% in 2022 compared to 2021.
- France is the second-leading market for non-dairy yogurt in the region. The Y-o-Y growth rate of plant-based yogurt in France is anticipated to grow by 43.9% in 2024 compared to 2022. Plant-based food tends to sell strongest among young and urban consumers who believe eating more vegan food is healthier and more sustainable for the environment. Between 2021 and 2022, nearly 12% of French people aged between 18 and 19 years stated that they were following a vegan diet.
Europe Non-dairy Yogurt Market Trends
The innovations taking place in the industry, along with growing popularity of non-dairy products, are driving the consumption of non-dairy yogurt
- The per capita consumption of non-dairy yogurt in Europe is increasing. Manufacturers of plant-based yogurt are responding to the growing demand via new product innovations and launching a variety of flavors and indulgences, thus boosting consumption. Western Europe is the most dynamic region globally in terms of non-dairy yogurt launches. In 2021, with more than 360 plant-based yogurts launched, the region represented 66% of all launches globally. Germany, France, and Italy have the highest per capita consumption of non-dairy yogurt. The growing popularity of dairy alternatives, primarily in Germany, has led to the rapid growth of plant-based yogurt. More than 12 million tourists visited Germany in 2021, boosting the demand for vegan yogurt due to the growing veganism domestically and internationally.
- The UK government has set regulations restricting the products on grocery or retail shelves or any e-commerce store, along with products or drinks that are high in salt, sugar, and fat or less healthy. This factor has influenced the population to opt for non-dairy yogurt as a healthy alternative to conventional yogurt. Non-dairy probiotic products have gained importance in line with the ongoing shift toward vegan food and the steep prevalence of lactose intolerance among the European population. These factors are anticipated to increase the penetration of non-dairy yogurt, leading critical players across the region to constantly invest in R&D activities for product innovation, with claims like low/no sugar, to capture the evolving consumer trend.
Europe Non-dairy Yogurt Industry Overview
The Europe Non-dairy Yogurt Market is moderately consolidated, with the top five companies occupying 58.81%. The major players in this market are Coconut Collaborative Ltd, Danone SA, Oatly Group AB, Otsuka Holdings Co. Ltd and Triballat Noyal SAS (sorted alphabetically).
Additional Benefits:
- The market estimate (ME) sheet in Excel format
- 3 months of analyst support
TABLE OF CONTENTS
1 EXECUTIVE SUMMARY & KEY FINDINGS
2 REPORT OFFERS
3 INTRODUCTION
- 3.1 Study Assumptions & Market Definition
- 3.2 Scope of the Study
- 3.3 Research Methodology
4 KEY INDUSTRY TRENDS
- 4.1 Per Capita Consumption
- 4.2 Raw Material/commodity Production
- 4.2.1 Dairy Alternative - Raw Material Production
- 4.3 Regulatory Framework
- 4.3.1 France
- 4.3.2 Germany
- 4.3.3 Italy
- 4.3.4 Spain
- 4.3.5 United Kingdom
- 4.4 Value Chain & Distribution Channel Analysis
5 MARKET SEGMENTATION (includes market size in Value in USD and Volume, Forecasts up to 2030 and analysis of growth prospects)
- 5.1 Distribution Channel
- 5.1.1 Off-Trade
- 5.1.1.1 By Sub Distribution Channels
- 5.1.1.1.1 Convenience Stores
- 5.1.1.1.2 Online Retail
- 5.1.1.1.3 Specialist Retailers
- 5.1.1.1.4 Supermarkets and Hypermarkets
- 5.1.1.1.5 Others (Warehouse clubs, gas stations, etc.)
- 5.1.1 Off-Trade
- 5.2 Country
- 5.2.1 Belgium
- 5.2.2 France
- 5.2.3 Germany
- 5.2.4 Italy
- 5.2.5 Netherlands
- 5.2.6 Russia
- 5.2.7 Spain
- 5.2.8 United Kingdom
- 5.2.9 Rest of Europe
6 COMPETITIVE LANDSCAPE
- 6.1 Key Strategic Moves
- 6.2 Market Share Analysis
- 6.3 Company Landscape
- 6.4 Company Profiles (includes Global Level Overview, Market Level Overview, Core Business Segments, Financials, Headcount, Key Information, Market Rank, Market Share, Products and Services, and Analysis of Recent Developments).
- 6.4.1 Blue Diamond Growers
- 6.4.2 Califia Farms LLC
- 6.4.3 Coconut Collaborative Ltd
- 6.4.4 Danone SA
- 6.4.5 Ecotone
- 6.4.6 Oatly Group AB
- 6.4.7 Otsuka Holdings Co. Ltd
- 6.4.8 The Hain Celestial Group Inc.
- 6.4.9 Triballat Noyal SAS
- 6.4.10 Valsoia SpA
- 6.4.11 Yoso Brands
7 KEY STRATEGIC QUESTIONS FOR DAIRY AND DAIRY ALTERNATIVE CEOS
8 APPENDIX
- 8.1 Global Overview
- 8.1.1 Overview
- 8.1.2 Porter's Five Forces Framework
- 8.1.3 Global Value Chain Analysis
- 8.1.4 Market Dynamics (DROs)
- 8.2 Sources & References
- 8.3 List of Tables & Figures
- 8.4 Primary Insights
- 8.5 Data Pack
- 8.6 Glossary of Terms
- 発行日
- 発行
- Mordor Intelligence
- ページ情報
- 英文 181 Pages
- 納期
- 2~3営業日


