
北米の非乳製品ヨーグルト:市場シェア分析、産業動向と統計、成長予測(2025年~2030年)
North America Non-dairy Yogurt - Market Share Analysis, Industry Trends & Statistics, Growth Forecasts (2025 - 2030)- 発行日
- ページ情報
- 英文 154 Pages
- 納期
- 2~3営業日
- 商品コード
- 1683838
- カスタマイズ可能 お客様のご希望に応じて、既存データの加工や未掲載情報(例:国別セグメント)の追加などの対応が可能です。詳細はお問い合わせください。
- 適宜更新あり 本レポートは最新情報反映のため適宜更新し、内容構成変更を行う場合があります。ご検討の際はお問い合わせください。
- 翻訳ツール提供対象 PDF対応AI翻訳ツールの無料貸し出しサービスのご利用が可能です
概要
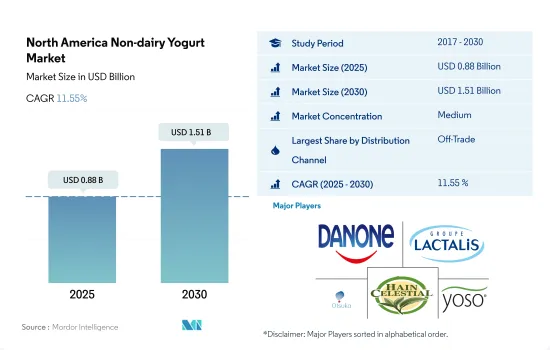
北米の非乳製品ヨーグルト市場規模は2025年に 8億8,000万米ドルと推計され、2030年には15億1,000万米ドルに達すると予測され、予測期間(2025年~2030年)のCAGRは11.55%で成長します。
米国は全小売チャネルの中で乳製品以外のヨーグルト販売で最大のシェアを占める
- 北米における植物性ヨーグルトの販売では、取引外の小売チャネルが大きな役割を果たしています。この小売チャネルには、スーパーマーケットやハイパーマーケット、コンビニエンスストア、専門小売店、オンライン小売店などが含まれます。オフトレード・チャネルの中では、スーパーマーケットとハイパーマーケットが北米の非乳製品ヨーグルト市場で最大の流通チャネルです。これらの小売チャネルは、大量購入のための大幅な割引、オファー、スキームが利用できるため、顧客から便利と認識されています。2022年、非乳製品ヨーグルトの取引外流通チャネルを通じた販売額は、2021年と比較して22.6%増加しました。
- 非売品部門では、オンライン・チャネルのサブセグメントが最も急成長しており、2024年には2021年比で80%以上増加すると予測されています。オンラインショッピングは、多忙なスケジュールやライフスタイルの増加により、消費者が乳製品以外のヨーグルトを購入する一般的な方法となりつつあります。競争の激しいeコマースでは、顧客がある小売業者を離れて別の小売業者を試すことも容易であるため、顧客のロイヤリティを維持する方法を見つけることが不可欠です。2022年現在、人口の約45%がモバイル端末を通じてオンラインサイトを閲覧しています。
- 米国は、オフトレード・チャネルにおける植物性ヨーグルトの販売で大きな役割を果たしています。2022年には、同地域の他国と比較して90%の金額シェアを占める。消費者のビーガンライフスタイルへの嗜好が高まるにつれ、植物性ヨーグルトの販売も小売チャネルを通じて増加します。例えば、2021年現在、米国の消費者の6%以上がビーガンであり、2014年のわずか1%と比較して500%増加しています。
ビーガン人口の増加は、予測期間中に有利な成長機会をもたらします。
- 非乳製品ヨーグルトは、健康的なライフスタイルの一部として植物性食生活の重要性が高まっていることから、米国の人々の間で大きな支持を得ています。回答者の約68%が乳製品代替品や植物性食肉を試したことがあります。調査ではまた、回答者の約34%が環境への影響を減らすために菜食主義者のライフスタイルを採用することに関心を持っていると報告しています。米国はこの地域の主要市場であり、消費量は2017年から2022年にかけて140.26%の成長を記録します。
- カナダは急成長市場として特定され、非乳製品ヨーグルトの消費量は予測期間中に12.72%のCAGRで推移すると予測されます。市場の成長は、菜食主義者の増加と植物性食品の重要性の高まりに起因しています。2021年、カナダにおける植物由来のレディミールの小売売上高は、フリーフロムレディミールの総売上高の17%のシェアを占めました。この動向は、業界の新製品発売によって支えられています。例えば、Boosh Food、Daiya Foods、Copper Branchは、過去5年間に最も多くの新製品を発売した主要なビーガン食品企業です。
- したがって、予測期間中の市場需要は、ビーガン人口の増加、新製品提供の利用可能性、ビーガン食品流通を専門とする小売パートナーの増加によって牽引されると予想されます。小売業者には、Compass Foods、Instacart、Well.ca、Avron、Walmart、Amazonなどがあります。例えば、Well.caはCalifia、Chobani、Blue Diamond、Earth's Ownといった様々なブランドの代替乳製品を提供しています。
北米の非乳製品ヨーグルト市場動向
非乳製品ヨーグルト市場で起きている技術革新動向は、同国の消費を牽引しています。
- 北米の非乳製品ヨーグルト市場は、数年前までは初期段階にあると考えられていました。しかし、この地域のフレキシタリアン人口の増加により、ビーガン産業は部分的に開花しました。フレキシタリアンとは、市場で入手可能な従来の乳製品と非乳製品の両方を探求することに前向きな個人のことです。2022年1月現在、アメリカ人の15%がフレキシタリアンであると自認しています。24~39歳のアメリカ人のうち、47%がフレキシタリアンであり、乳製品の消費を積極的に減らし、植物由来の代替食品を好みます。このようなフレキシタリアン人口の増加は、今後数年間における植物性ヨーグルトの成長機会が大きいことを示しています。
- 同地域における植物性食品への需要の高まりは、主要企業に需要の高まりに対応した幅広い製品の革新と発売を促しています。米国(36%)に比べて乳糖不耐症が普及しているカナダ(59%)やメキシコ(48%)といった国々では、消費者の植物性食品への傾向が高まっています。植物由来の製品が高いレベルで受け入れられていることは、従来の乳製品やヨーグルトのような乳製品への依存を減らし、公衆衛生、環境、動物福祉の成果を改善する機会を提供します。
- 2021年、米国における植物性ヨーグルトの小売売上高は9%増加し、これは従来のヨーグルトの3倍で、4.5%の市場シェアを獲得しました。植物性ヨーグルトの販売個数は過去3年間で急成長を遂げ、54%増加して2021年には1億7,000万個に達します。市場開拓企業は、食欲をそそる植物性ヨーグルトを開発するために革新的なアプローチを採用し、ビーガンの消費者層の要求を満たすために新しいフレーバーや組み合わせを導入しています。植物性食品の利点に関する意識の高まりは、市場における非乳製品ヨーグルトの消費をさらに促進すると予想されます。
北米の非乳製品ヨーグルト産業の概要
北米の非乳製品ヨーグルト市場は適度に統合されており、上位5社で61.84%を占めています。この市場の主要企業は以下の通り。 Danone SA, Groupe Lactalis, Otsuka Holdings, The Hain Celestial Group Inc. and Yoso Brands(sorted alphabetically).
その他の特典
- エクセル形式の市場予測(ME)シート
- 3ヶ月のアナリストサポート
目次
第1章 エグゼクティブサマリーと主な調査結果
第2章 レポートのオファー
第3章 イントロダクション
- 調査の前提条件と市場定義
- 調査範囲
- 調査手法
第4章 主要産業動向
- 一人当たり消費量
- 原材料/商品生産
- 代替乳製品-原材料生産
- 規制の枠組み
- カナダ
- メキシコ
- 米国
- バリューチェーンと流通チャネル分析
第5章 市場セグメンテーション
- 流通チャネル
- オフトレード
- サブ流通チャネル別
- コンビニエンスストア
- オンライン小売
- 専門店
- スーパーマーケットとハイパーマーケット
- その他(倉庫クラブ、ガソリンスタンドなど)
- オフトレード
- 国名
- カナダ
- 米国
第6章 競合情勢
- 主要な戦略動向
- 市場シェア分析
- 企業情勢
- 企業プロファイル(世界レベルの概要、市場レベルの概要、主要事業セグメント、財務、従業員数、主要情報、市場ランク、市場シェア、製品・サービス、最近の動向分析を含む)
- Blue Diamond Growers
- Danone SA
- Forager Project LLC
- Groupe Lactalis
- GT's Living Foods LLC
- Kite Hill
- Lavva
- Otsuka Holdings Co. Ltd
- The Hain Celestial Group Inc.
- Yoso Brands
第7章 CEOへの主な戦略的質問
第8章 付録
- 世界の概要
- 概要
- ファイブフォース分析フレームワーク
- 世界・バリューチェーン分析
- 市場力学(DROs)
- 情報源と参考文献
- 図表一覧
- 主要洞察
- データパック
- 用語集
目次
The North America Non-dairy Yogurt Market size is estimated at 0.88 billion USD in 2025, and is expected to reach 1.51 billion USD by 2030, growing at a CAGR of 11.55% during the forecast period (2025-2030).
The United States accounts for the largest share of non-dairy yogurt sales among all retail channels
- The off-trade retail channel plays a major role in the sales of plant-based yogurts in North America. This retail channel includes supermarkets and hypermarkets, convenience stores, specialist retailers, and online retailers. Among the off-trade channel, supermarkets and hypermarkets are the largest distribution channel in the North American non-dairy yogurt market. These retail channels are perceived as convenient by customers due to the huge discounts, offers, and schemes available for bulk purchasing. In 2022, the sales value of non-dairy yogurt through the off-trade distribution channel increased by 22.6% compared to 2021.
- In the off-trade segment, the online channel sub-segment is the fastest-growing one, which is anticipated to increase by more than 80% in 2024 compared to 2021. Online shopping is becoming a popular way for consumers to buy non-dairy yogurt due to the increase in busy schedules and lifestyles. In the highly competitive space of e-commerce, where it is easy for customers to leave one retailer to try out another, finding ways to keep customers loyal is essential. As of 2022, around 45% of the population browses online websites through mobile devices.
- The United States plays a major role in the sales of plant-based yogurts in the off-trade channel. In 2022, the country accounted for 90% of value share compared to other countries in the region. As consumers' preference increases toward a vegan lifestyle, the sales of plant-based yogurt also increase through retail channels. For instance, as of 2021, more than 6% of US consumers were vegan, a 500% increase compared to just 1% in 2014.
Rise in vegan population represents lucrative growth opportunities during the forecast period
- Non-dairy yogurts are gaining significant acceptance among the US population due to the rising importance of plant-based diets as a part of healthy lifestyles. About 68% of respondents have tried a dairy alternative or plant-based meat. The survey also reports that around 34% of respondents have an interest in adopting vegan lifestyles to reduce environmental impacts. The United States is identified as the major market in the region, with volume consumption registering a growth of 140.26% from 2017 to 2022.
- Canada is identified as the fastest-growing market, with the consumption of non-dairy yogurt anticipated to register a CAGR of 12.72% during the forecast period. The market's growth can be attributed to the rise in the vegan population and the increasing importance of plant-based food. In 2021, retail sales of plant-based ready meals in Canada represented a share of 17% of total free-from-ready meal sales. The trend is supported by new product launches in the industry. For instance, Boosh Food, Daiya Foods, and Copper Branch are identified as key vegan food companies with the most launches in the last five years.
- Therefore, the market demand during the forecast period is anticipated to be driven by the increasing vegan population, availability of new product offerings, and growing number of retail partners specializing in vegan food distribution. Some of the retailers are Compass Foods, Instacart, Well.ca, Avron, Walmart, and Amazon. For instance, Well.ca offers dairy alternatives from different brands, such as Califia, Chobani, Blue Diamond, and Earth's Own.
North America Non-dairy Yogurt Market Trends
The innovation trends taking place in the non-dairy yogurt market is driving the consumption in the country.
- The North American non-dairy yogurt market was considered to be at a nascent stage until a few years ago. However, the vegan industry has partially bloomed, owing to the rising population of flexitarians in the region. Flexitarians are individuals who are open to exploring both conventional and non-dairy products available in the market. As of January 2022, 15% of Americans identified themselves as flexitarians. Among Americans between the ages of 24-39, 47% identified as flexitarians, meaning they actively reduce the consumption of dairy products in favor of plant-based alternatives. This growing population of flexitarians indicates a significant opportunity for the growth of plant-based yogurts in the coming years.
- The increasing demand for plant-based foods in the region has prompted key players to innovate and launch a wide range of products to meet the rising demand. In countries like Canada (59%) and Mexico (48%), where lactose intolerance is more prevalent compared to the United States (36%), consumers are increasingly leaning toward plant-based foods. The high level of acceptance of plant-based products provides an opportunity to reduce dependence on traditional dairy and dairy products like yogurt and improve outcomes for public health, the environment, and animal welfare.
- In 2021, retail sales of plant-based yogurt in the United States increased by 9%, which is three times higher than traditional yogurt, capturing a market share of 4.5%. The unit sales of plant-based yogurt have experienced rapid growth over the past three years, increasing by 54% to reach 170 million units in 2021. Companies in the market are adopting innovative approaches to develop appetizing plant-based yogurts, introducing new flavors and combinations to meet the requirements of their vegan consumer base. Increased awareness about the advantages of plant-based food is expected to further drive the consumption of non-dairy yogurt in the market.
North America Non-dairy Yogurt Industry Overview
The North America Non-dairy Yogurt Market is moderately consolidated, with the top five companies occupying 61.84%. The major players in this market are Danone SA, Groupe Lactalis, Otsuka Holdings Co. Ltd, The Hain Celestial Group Inc. and Yoso Brands (sorted alphabetically).
Additional Benefits:
- The market estimate (ME) sheet in Excel format
- 3 months of analyst support
TABLE OF CONTENTS
1 EXECUTIVE SUMMARY & KEY FINDINGS
2 REPORT OFFERS
3 INTRODUCTION
- 3.1 Study Assumptions & Market Definition
- 3.2 Scope of the Study
- 3.3 Research Methodology
4 KEY INDUSTRY TRENDS
- 4.1 Per Capita Consumption
- 4.2 Raw Material/commodity Production
- 4.2.1 Dairy Alternative - Raw Material Production
- 4.3 Regulatory Framework
- 4.3.1 Canada
- 4.3.2 Mexico
- 4.3.3 United States
- 4.4 Value Chain & Distribution Channel Analysis
5 MARKET SEGMENTATION (includes market size in Value in USD and Volume, Forecasts up to 2030 and analysis of growth prospects)
- 5.1 Distribution Channel
- 5.1.1 Off-Trade
- 5.1.1.1 By Sub Distribution Channels
- 5.1.1.1.1 Convenience Stores
- 5.1.1.1.2 Online Retail
- 5.1.1.1.3 Specialist Retailers
- 5.1.1.1.4 Supermarkets and Hypermarkets
- 5.1.1.1.5 Others (Warehouse clubs, gas stations, etc.)
- 5.1.1 Off-Trade
- 5.2 Country
- 5.2.1 Canada
- 5.2.2 United States
6 COMPETITIVE LANDSCAPE
- 6.1 Key Strategic Moves
- 6.2 Market Share Analysis
- 6.3 Company Landscape
- 6.4 Company Profiles (includes Global Level Overview, Market Level Overview, Core Business Segments, Financials, Headcount, Key Information, Market Rank, Market Share, Products and Services, and Analysis of Recent Developments).
- 6.4.1 Blue Diamond Growers
- 6.4.2 Danone SA
- 6.4.3 Forager Project LLC
- 6.4.4 Groupe Lactalis
- 6.4.5 GT's Living Foods LLC
- 6.4.6 Kite Hill
- 6.4.7 Lavva
- 6.4.8 Otsuka Holdings Co. Ltd
- 6.4.9 The Hain Celestial Group Inc.
- 6.4.10 Yoso Brands
7 KEY STRATEGIC QUESTIONS FOR DAIRY AND DAIRY ALTERNATIVE CEOS
8 APPENDIX
- 8.1 Global Overview
- 8.1.1 Overview
- 8.1.2 Porter's Five Forces Framework
- 8.1.3 Global Value Chain Analysis
- 8.1.4 Market Dynamics (DROs)
- 8.2 Sources & References
- 8.3 List of Tables & Figures
- 8.4 Primary Insights
- 8.5 Data Pack
- 8.6 Glossary of Terms
- 発行日
- 発行
- Mordor Intelligence
- ページ情報
- 英文 154 Pages
- 納期
- 2~3営業日


