
|
市場調査レポート
商品コード
1687059
北米のヨーグルト:市場シェア分析、産業動向・統計、成長予測(2025年~2030年)North America Yogurt - Market Share Analysis, Industry Trends & Statistics, Growth Forecasts (2025 - 2030) |
||||||
カスタマイズ可能
適宜更新あり
|
|||||||
| 北米のヨーグルト:市場シェア分析、産業動向・統計、成長予測(2025年~2030年) |
|
出版日: 2025年03月18日
発行: Mordor Intelligence
ページ情報: 英文 164 Pages
納期: 2~3営業日
|

全表示
- 概要
- 目次
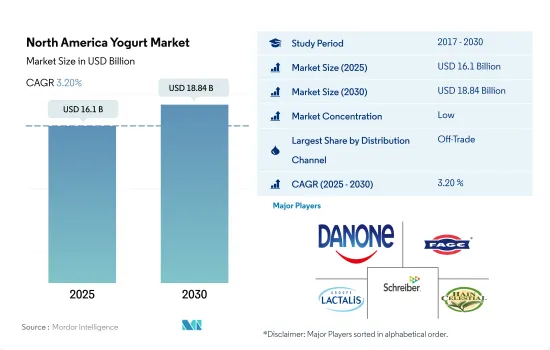
北米のヨーグルト市場規模は2025年に161億米ドルと推定・予測され、2030年には188億4,000万米ドルに達し、予測期間中(2025~2030年)にCAGR 3.20%で成長すると予測されています。
さまざまなフレーバーのヨーグルトの入手可能性が市場成長を高めています。
- 北米の流通チャネルは、2021年と比較して2022年には1.38%の成長を示しました。この成長は、ヨーグルトセグメントにおいて幅広いフレーバーが入手可能であることに起因しています。小売業者はまた、ヨーグルト部門で多種多様なブランドを提供しています。2021年、米国では、ストロベリー味のヨーグルトが8%の人口に好まれ、バニラとブルーベリー(ともに4%)、ピーチ(3%)、マンゴー(2%)が続きました。北米地域の流通チャネルに対する需要により、この業界は2025年に5.08%上昇すると予想されます。
- スーパーマーケットやハイパーマーケットは、商品を保管するスペースや棚が広いです。その結果、オフトレードの小売形態では、スーパーマーケットとハイパーマーケットが75.35%のシェアを占め、この国の流通チャネル全体を支配しています。これらのスーパーマーケットやハイパーマーケットには、ウォルマート、ターゲット、クローガー、アマゾン、コストコ・ホールセール・コーポレーション、アルバートソンズ・コス、Ahold Delhaize USA、パブリックス・スーパー・マーケッツなどがあります。これらの小売業者は、様々な価格(低価格、中価格、高価格)で乳製品を提供しています。米国におけるヨーグルトの基本販売価格は4.97米ドルから85米ドルです。
- 北米では、消費者は主に屋外で消費することを好みます。2022年には、米国では2,310万人が少なくとも週に1回は屋外で食事を摂っていることが確認されました。同国のレストラン総数は、2020年には105万軒と推定されています。その結果、北米では過去5年間、オン・トレード小売が人気を博しています。同地域では、2022年、店頭小売モードにおいて、ヨーグルト部門は他の乳製品と比較して86.93%のシェアを占めました。
米国はこの地域でヨーグルトの売上高が最も高いです。
- 国別では米国がこの地域のヨーグルト市場をリードしており、2024年の販売額は2021年比で8.2%増加すると予測されています。米国の消費者は新製品を試すことに非常に前向きであるため、恒常的な製品投入は同国におけるヨーグルトの売上を促進する大きな要因の一つです。2021年時点で、ヨーグルトの発売は前年の2%から7%に増加しています。
- ヨーグルト分野全体の中で、フレーバーヨーグルトはこの地域で最大のシェアを占めています。フレーバーヨーグルトは栄養価が高く、様々な栄養上のメリットをもたらします。ほとんどのフレーバーヨーグルトは170キロカロリー前後で、5~7グラムのタンパク質を含んでいます。フレーバー・ギリシャ・ヨーグルトは、5.3オンス当たり約120キロカロリー、タンパク質12グラムです。フレーバーヨーグルトには、バニラ、プレーン、ストロベリーブレンド、ピーチなど様々な種類があります。米国の消費者の間では、ストロベリーがフレーバー・ヨーグルトの中で最も好まれています。2022年現在、米国ではヨーグルト/ヨーグルト飲料の消費者の27%が、新しいフレーバーを見たことが購入のきっかけになったと述べています。
- カナダは、この地域でヨーグルトの第2位の市場です。一人当たりのヨーグルト消費量では、カナダがトップです。強化ヨーグルトは、プロバイオティクスなどの成分に対する消費者の関心の高まりにより、カナダで最も人気のある乳製品のひとつとなっています。2022年現在、ヨーグルトの1人当たり消費量は約11.96kgで、米国の1人当たり消費量を上回っています。カナダでは、2~5歳の子どものヨーグルト消費率が47%と高く、次いで19~54歳の成人の消費率が18%となっています。
北米ヨーグルト市場動向
より健康的な代替乳製品の人気の高まりが北米でのヨーグルト消費を促進
- ヨーグルトは最近人気を博しており、アイスクリームの代替品として健康的と認識されています。新製品の開発とヨーグルト培養物やプロバイオティクスに関連する健康効果に対する消費者の意識の高まりにより、北米では過去数十年間にヨーグルトの一人当たり消費量が急増しました。同地域のヨーグルト消費量は2021年に2%増加しました。
- ヨーグルトとスムージー製品は、米国の消費者の半数以上が定期的に消費しています。米国の消費者の多くは、同様のヨーグルト製品の低脂肪や無糖の品種よりも、伝統的な乳製品のヨーグルトを好みます。この地域の伝統的なギリシャヨーグルトの需要を満たすために、ギリシャヨーグルトメーカーは最近の動向において非常に重要な役割を果たしています。
- 多くの消費者は、毎日の食事で十分なタンパク質を摂取することを目指しており、ヨーグルトは栄養価が高く、便利な選択肢として消費されています。約45%の消費者が、朝食としてヨーグルト製品を摂取しています。ヨーグルトの消費は他の時間帯にも広がっており、消費者の32%が昼食に、次いで32%が午後の間食に、25%が深夜の間食に、22%が夜食にヨーグルトを食べています。
- 通常、ヨーグルトはブランド製品として販売されています。ヨーグルトにはさまざまなフレーバーがあり、飲み物、冷凍食品、デザートとして食べることができます。ヨーグルトのラベルには、栄養素に関する詳細な情報が記載され、心臓・脳卒中財団(Heart and Stroke Foundation)の健康チェックマークのアイコンが付いていることが多いです。ヨーグルトは、ビタミン、ミネラル、食物繊維が強化されていることが多いです。こうした特性は、消費者の間でヨーグルトの消費を促進しています。例えば、2021年現在、米国の消費者の80.8%がフレーバーヨーグルトを消費しているが、これはその栄養面での利点が大きいためです。
北米ヨーグルト産業の概要
北米ヨーグルト市場は細分化されており、上位5社で38.65%を占めています。この市場の主要企業は以下の通りです。 Danone SA, FAGE USA Dairy Industry Inc., Groupe Lactalis SA, Schreiber Foods Inc. and The Hain Celestial Group Inc.(sorted alphabetically).
その他の特典
- エクセル形式の市場予測(ME)シート
- 3ヶ月間のアナリストサポート
目次
第1章 エグゼクティブサマリーと主な調査結果
第2章 レポートのオファー
第3章 イントロダクション
- 調査の前提条件と市場定義
- 調査範囲
- 調査手法
第4章 主要産業動向
- 一人当たり消費量
- 原材料/商品生産量
- 牛乳
- 規制の枠組み
- カナダ
- メキシコ
- 米国
- バリューチェーンと流通チャネル分析
第5章 市場セグメンテーション
- 製品タイプ
- フレーバーヨーグルト
- ノンフレーバーヨーグルト
- 流通チャネル
- オフトレード
- サブ流通チャネル別
- コンビニエンスストア
- オンライン小売
- 専門店
- スーパーマーケットとハイパーマーケット
- その他(倉庫クラブ、ガソリンスタンドなど)
- オントレード
- オフトレード
- 国
- カナダ
- メキシコ
- 米国
- その他北米地域
第6章 競争情勢
- 主要な戦略動向
- 市場シェア分析
- 企業情勢
- 企業プロファイル.
- Alpina Productos Alimenticios SA BIC
- Danone SA
- FAGE USA Dairy Industry Inc.
- Groupe Lactalis SA
- Johanna Foods Inc.
- Schreiber Foods Inc.
- The Hain Celestial Group Inc.
- Country Food LLC
第7章 CEOへの主な戦略的質問
第8章 付録
- 世界概要
- 概要
- ファイブフォース分析フレームワーク
- 世界のバリューチェーン分析
- 市場力学(DROs)
- 情報源と参考文献
- 図表一覧
- 主要洞察
- データパック
- 用語集
The North America Yogurt Market size is estimated at 16.1 billion USD in 2025, and is expected to reach 18.84 billion USD by 2030, growing at a CAGR of 3.20% during the forecast period (2025-2030).
Availability of yogurt in different flavors is increasing the market growth
- The North American distribution channel witnessed a growth of 1.38% in 2022 compared to 2021. The growth is attributed to the availability of a wide range of flavors in the yogurt segment. Retailers also offer a wide variety of brands under the yogurt section. In 2021, in the United States, strawberry-flavored yogurt was preferred by 8% of the population, followed by vanilla and blueberry (both 4%), peach (3%), and mango (2%). Due to the demand for distribution channels in the North American region, this industry is expected to rise by 5.08% in 2025.
- Supermarkets and hypermarkets have larger spaces and shelves to store their products. As a result, under the off-trade retailing modes, supermarkets and hypermarkets dominate the country's overall distribution channel by holding a share of 75.35%. Some of these supermarkets and hypermarkets nationwide are Walmart, Target, Kroger, Amazon, Costco Wholesale Corporation, Albertsons Cos., Ahold Delhaize USA, and Publix Super Markets Inc., among others. These retailers are providing dairy products at varied prices (low, medium, and high). The base selling price of yogurt in the United States is USD 4.97 to as high as USD 85.
- In North America, consumers majorly prefer out-house consumption. In 2022, it was observed that 23.1 million individuals were consuming food outside at least once a week in the United States. The total number of restaurants in the corresponding country was estimated at 1.05 million in 2020. As a result, on-trade retailing modes have gained popularity in the last five years in North America. In this region, under the on-trade retailing mode, the yogurt segment held a share of 86.93% when compared with other dairy products in 2022.
The United States accounted for the highest sales of Yogurt in the region
- By country, the United States is the leading market for yogurt in the region, and it is anticipated to increase its sales value by 8.2% in 2024 compared to 2021. Constant product launches are one of the major factors promoting the sales of yogurts in the country because American consumers are highly open to trying new products. As of 2021, the yogurt launches increased to 7%, up from 2% the year before.
- Among the overall yogurt segment, flavored yogurt holds the maximum share in the region. Flavored yogurt is nutrient dense and provides various nutritional benefits. Most flavored yogurts are around 170 calories and contain 5-7 grams of protein. Flavored Greek yogurt contains around 120 calories and 12 grams of protein per 5.3 oz serving. There are various types of flavored yogurt, including vanilla, plain, strawberry blend, and peach, among others. Strawberry has been the most preferred choice of flavored yogurt among consumers in the United States. As of 2022, in the United States, 27% of yogurt/yogurt drink consumers state that seeing a new flavor inspired them to buy it.
- Canada is the second-leading market for yogurt in the region. In the per capita consumption of yogurt, Canada topped the place. Fortified yogurt is one of Canada's most popular dairy products due to consumers' increased interest in ingredients such as probiotics. As of 2022, the per capita consumption of yogurt stands at about 11.96 kg per person, which is higher than the per capita consumption of yogurt in the United States. In Canada, a higher prevalence of yogurt consumption was noted among children aged 2-5 years, at 47%, followed by adults aged 19-54 years, at 18%.
North America Yogurt Market Trends
The growing popularity of healthier dairy alternatives drives yogurt consumption in North America
- Yogurt has gained popularity recently and is perceived as a healthy alternative to ice cream. The developments of new products and the increased consumer awareness of the health benefits associated with yogurt cultures and probiotics have led to a sharp increase in the per capita consumption of yogurt in North America during the last decades. Yogurt consumption in the region increased by 2% in 2021.
- Yogurt and smoothie products are regularly consumed by more than half of US consumers. Most US customers favor traditional dairy yogurt over low-fat or sugar-free varieties of similar yogurt products. Greek yogurt manufacturers have played a very important part in recent developments in meeting the demand for traditional Greek yogurt in the region.
- Many consumers aim to get sufficient daily protein in their diets, and yogurt is consumed as a nutritious, convenient option that typically contains more than 5 g of protein per single-serve container. About 45% of consumers usually consume yogurt products as their breakfast. Yogurt consumption is also prevalent at other times, wherein 32% of consumers eat it for lunch, followed by 32% for an afternoon snack, 25% for a late-morning snack, and 22% for a late-night snack.
- Typically, yogurt is marketed as a branded product. Yogurt is available in a wide range of flavors and can be had as a drink, a frozen good, or a dessert. Labels offer expanded nutrient information and often carry the Heart and Stroke Foundation health check symbol icon. Yogurt is often fortified with additional vitamins, minerals, and fiber. These attributes have enhanced the consumption of yogurt among consumers. For instance, as of 2021, 80.8% of consumers in the United States consumed flavored yogurt, owing to its significant nutritional benefits.
North America Yogurt Industry Overview
The North America Yogurt Market is fragmented, with the top five companies occupying 38.65%. The major players in this market are Danone SA, FAGE USA Dairy Industry Inc., Groupe Lactalis SA, Schreiber Foods Inc. and The Hain Celestial Group Inc. (sorted alphabetically).
Additional Benefits:
- The market estimate (ME) sheet in Excel format
- 3 months of analyst support
TABLE OF CONTENTS
1 EXECUTIVE SUMMARY & KEY FINDINGS
2 REPORT OFFERS
3 INTRODUCTION
- 3.1 Study Assumptions & Market Definition
- 3.2 Scope of the Study
- 3.3 Research Methodology
4 KEY INDUSTRY TRENDS
- 4.1 Per Capita Consumption
- 4.2 Raw Material/commodity Production
- 4.2.1 Milk
- 4.3 Regulatory Framework
- 4.3.1 Canada
- 4.3.2 Mexico
- 4.3.3 United States
- 4.4 Value Chain & Distribution Channel Analysis
5 MARKET SEGMENTATION (includes market size in Value in USD and Volume, Forecasts up to 2030 and analysis of growth prospects)
- 5.1 Product Type
- 5.1.1 Flavored Yogurt
- 5.1.2 Unflavored Yogurt
- 5.2 Distribution Channel
- 5.2.1 Off-Trade
- 5.2.1.1 By Sub Distribution Channels
- 5.2.1.1.1 Convenience Stores
- 5.2.1.1.2 Online Retail
- 5.2.1.1.3 Specialist Retailers
- 5.2.1.1.4 Supermarkets and Hypermarkets
- 5.2.1.1.5 Others (Warehouse clubs, gas stations, etc.)
- 5.2.2 On-Trade
- 5.2.1 Off-Trade
- 5.3 Country
- 5.3.1 Canada
- 5.3.2 Mexico
- 5.3.3 United States
- 5.3.4 Rest of North America
6 COMPETITIVE LANDSCAPE
- 6.1 Key Strategic Moves
- 6.2 Market Share Analysis
- 6.3 Company Landscape
- 6.4 Company Profiles (includes Global Level Overview, Market Level Overview, Core Business Segments, Financials, Headcount, Key Information, Market Rank, Market Share, Products and Services, and Analysis of Recent Developments).
- 6.4.1 Alpina Productos Alimenticios SA BIC
- 6.4.2 Danone SA
- 6.4.3 FAGE USA Dairy Industry Inc.
- 6.4.4 Groupe Lactalis SA
- 6.4.5 Johanna Foods Inc.
- 6.4.6 Schreiber Foods Inc.
- 6.4.7 The Hain Celestial Group Inc.
- 6.4.8 Country Food LLC
7 KEY STRATEGIC QUESTIONS FOR DAIRY AND DAIRY ALTERNATIVE CEOS
8 APPENDIX
- 8.1 Global Overview
- 8.1.1 Overview
- 8.1.2 Porter's Five Forces Framework
- 8.1.3 Global Value Chain Analysis
- 8.1.4 Market Dynamics (DROs)
- 8.2 Sources & References
- 8.3 List of Tables & Figures
- 8.4 Primary Insights
- 8.5 Data Pack
- 8.6 Glossary of Terms

