|
|
市場調査レポート
商品コード
1557698
冷凍魚介類の世界市場 2024-2028Global Frozen Fish and Seafood Market 2024-2028 |
||||||

|
|||||||
カスタマイズ可能
|
|||||||


| 冷凍魚介類の世界市場 2024-2028 |
|
出版日: 2024年08月05日
発行: TechNavio
ページ情報: 英文 168 Pages
納期: 即納可能
|

全表示
- 概要
- 図表
- 目次
冷凍魚介類市場は2023-2028年に346億米ドル、予測期間中のCAGRは8.07%で成長すると予測されます。
当レポートでは、冷凍魚介類市場の全体的な分析、市場規模・予測、動向、成長促進要因、課題、約25のベンダーを網羅したベンダー分析などを掲載しています。
現在の市場シナリオ、最新動向と促進要因、市場環境全体に関する最新分析を提供しています。市場は、利便性への欲求の高まり、水産加工品への需要の高まり、陸上養殖の隆盛によって牽引されています。
| 市場範囲 | |
|---|---|
| 基準年 | 2024 |
| 終了年 | 2028 |
| 予測期間 | 2024-2028 |
| 成長モメンタム | 加速 |
| 前年比2024年 | 7.26% |
| CAGR | 8.07% |
| 増分額 | 346億米ドル |
本調査では、今後数年間の冷凍魚介類市場成長を牽引する主な要因の一つとして、冷凍魚介類パッケージングにおけるイノベーションを挙げています。また、持続可能な漁業の出現とオンライン小売の成長は、市場の大きな需要につながります。
目次
第1章 エグゼクティブサマリー
- 市場概要
第2章 市場情勢
- 市場エコシステム
- 市場の特徴
- バリューチェーン分析
第3章 市場規模の評価
- 市場の定義
- 市場セグメント分析
- 市場規模 2023
- 市場の見通し 2023-2028
第4章 市場規模実績
- 冷凍魚介類の世界市場 2018-2022
- エンドユーザー別セグメント分析 2018-2022
- 流通チャネル別セグメント分析 2018-2022
- 地域別セグメント分析 2018-2022
- 国別セグメント分析 2018-2022
第5章 ファイブフォース分析
- ファイブフォースの要約
- 買い手の交渉力
- 供給企業の交渉力
- 新規参入業者の脅威
- 代替品の脅威
- 競争の脅威
- 市況
第6章 市場セグメンテーション:エンドユーザー別
- 市場セグメンテーション
- 比較:エンドユーザー別
- 食品加工産業:市場規模と予測 2023-2028
- 食品サービス提供者:市場規模と予測 2023-2028
- 小売・家庭用品:市場規模と予測 2023-2028
- 動物飼料およびペットフード:市場規模と予測 2023-2028
- 市場機会:エンドユーザー別
第7章 市場セグメンテーション:流通チャネル別
- 市場セグメンテーション
- 比較:流通チャネル別
- オフライン:市場規模と予測 2023-2028
- オンライン:市場規模と予測 2023-2028
- 市場機会:流通チャネル別
第8章 顧客情勢
- 顧客情勢の概要
第9章 地域別情勢
- 地域別セグメンテーション
- 比較:地域別
- 欧州:市場規模と予測 2023-2028
- アジア太平洋:市場規模と予測 2023-2028
- 北米:市場規模と予測 2023-2028
- 南米:市場規模と予測 2023-2028
- 中東・アフリカ:市場規模と予測 2023-2028
- 米国:市場規模と予測 2023-2028
- フランス:市場規模と予測 2023-2028
- ドイツ:市場規模と予測 2023-2028
- 中国:市場規模と予測 2023-2028
- スペイン:市場規模と予測 2023-2028
- 市場機会:地域別
第10章 促進要因・課題・機会・抑制要因
- 市場促進要因
- 市場の課題
- 促進要因と課題の影響
- 市場の機会・抑制要因
第11章 競合情勢
- 概要
- 競合情勢
- 混乱の状況
- 業界のリスク
第12章 競合分析
- 企業プロファイル
- 企業の市場ポジショニング
- Austevoll Seafood ASA
- Faroese Seafood
- Freiremar SA
- Grieg Seafood ASA
- Lee Fish
- Lee Fishing Co.
- Metro Seafood Ltd.
- Midseas Ltd.
- Mowi ASA
- Nutreco N.V.
- Ocean Fresh Seafood
- Seattle Fish Co.
- Tesco Plc
- True World Foods LLC
- Wm Morrison Supermarkets Ltd.
第13章 付録
Exhibits:
- Exhibits1: Executive Summary - Chart on Market Overview
- Exhibits2: Executive Summary - Data Table on Market Overview
- Exhibits3: Executive Summary - Chart on Global Market Characteristics
- Exhibits4: Executive Summary - Chart on Market by Geography
- Exhibits5: Executive Summary - Chart on Market Segmentation by End-user
- Exhibits6: Executive Summary - Chart on Market Segmentation by Distribution Channel
- Exhibits7: Executive Summary - Chart on Incremental Growth
- Exhibits8: Executive Summary - Data Table on Incremental Growth
- Exhibits9: Executive Summary - Chart on Company Market Positioning
- Exhibits10: Parent Market
- Exhibits11: Data Table on - Parent Market
- Exhibits12: Market characteristics analysis
- Exhibits13: Value Chain Analysis
- Exhibits14: Offerings of companies included in the market definition
- Exhibits15: Market segments
- Exhibits16: Chart on Global - Market size and forecast 2023-2028 ($ billion)
- Exhibits17: Data Table on Global - Market size and forecast 2023-2028 ($ billion)
- Exhibits18: Chart on Global Market: Year-over-year growth 2023-2028 (%)
- Exhibits19: Data Table on Global Market: Year-over-year growth 2023-2028 (%)
- Exhibits20: Historic Market Size - Data Table on Global Frozen Fish And Seafood Market 2018 - 2022 ($ billion)
- Exhibits21: Historic Market Size - End-user Segment 2018 - 2022 ($ billion)
- Exhibits22: Historic Market Size - Distribution Channel Segment 2018 - 2022 ($ billion)
- Exhibits23: Historic Market Size - Geography Segment 2018 - 2022 ($ billion)
- Exhibits24: Historic Market Size - Country Segment 2018 - 2022 ($ billion)
- Exhibits25: Five forces analysis - Comparison between 2023 and 2028
- Exhibits26: Bargaining power of buyers - Impact of key factors 2023 and 2028
- Exhibits27: Bargaining power of suppliers - Impact of key factors in 2023 and 2028
- Exhibits28: Threat of new entrants - Impact of key factors in 2023 and 2028
- Exhibits29: Threat of substitutes - Impact of key factors in 2023 and 2028
- Exhibits30: Threat of rivalry - Impact of key factors in 2023 and 2028
- Exhibits31: Chart on Market condition - Five forces 2023 and 2028
- Exhibits32: Chart on End-user - Market share 2023-2028 (%)
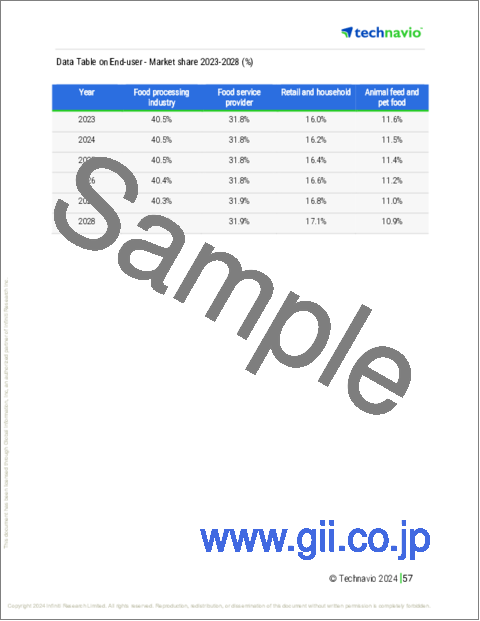
- Exhibits33: Data Table on End-user - Market share 2023-2028 (%)
- Exhibits34: Chart on Comparison by End-user
- Exhibits35: Data Table on Comparison by End-user
- Exhibits36: Chart on Food processing industry - Market size and forecast 2023-2028 ($ billion)
- Exhibits37: Data Table on Food processing industry - Market size and forecast 2023-2028 ($ billion)
- Exhibits38: Chart on Food processing industry - Year-over-year growth 2023-2028 (%)
- Exhibits39: Data Table on Food processing industry - Year-over-year growth 2023-2028 (%)
- Exhibits40: Chart on Food service provider - Market size and forecast 2023-2028 ($ billion)
- Exhibits41: Data Table on Food service provider - Market size and forecast 2023-2028 ($ billion)
- Exhibits42: Chart on Food service provider - Year-over-year growth 2023-2028 (%)
- Exhibits43: Data Table on Food service provider - Year-over-year growth 2023-2028 (%)
- Exhibits44: Chart on Retail and household - Market size and forecast 2023-2028 ($ billion)
- Exhibits45: Data Table on Retail and household - Market size and forecast 2023-2028 ($ billion)
- Exhibits46: Chart on Retail and household - Year-over-year growth 2023-2028 (%)
- Exhibits47: Data Table on Retail and household - Year-over-year growth 2023-2028 (%)
- Exhibits48: Chart on Animal feed and pet food - Market size and forecast 2023-2028 ($ billion)
- Exhibits49: Data Table on Animal feed and pet food - Market size and forecast 2023-2028 ($ billion)
- Exhibits50: Chart on Animal feed and pet food - Year-over-year growth 2023-2028 (%)
- Exhibits51: Data Table on Animal feed and pet food - Year-over-year growth 2023-2028 (%)
- Exhibits52: Market opportunity by End-user ($ billion)
- Exhibits53: Data Table on Market opportunity by End-user ($ billion)
- Exhibits54: Chart on Distribution Channel - Market share 2023-2028 (%)
- Exhibits55: Data Table on Distribution Channel - Market share 2023-2028 (%)
- Exhibits56: Chart on Comparison by Distribution Channel
- Exhibits57: Data Table on Comparison by Distribution Channel
- Exhibits58: Chart on Offline - Market size and forecast 2023-2028 ($ billion)
- Exhibits59: Data Table on Offline - Market size and forecast 2023-2028 ($ billion)
- Exhibits60: Chart on Offline - Year-over-year growth 2023-2028 (%)
- Exhibits61: Data Table on Offline - Year-over-year growth 2023-2028 (%)
- Exhibits62: Chart on Online - Market size and forecast 2023-2028 ($ billion)
- Exhibits63: Data Table on Online - Market size and forecast 2023-2028 ($ billion)
- Exhibits64: Chart on Online - Year-over-year growth 2023-2028 (%)
- Exhibits65: Data Table on Online - Year-over-year growth 2023-2028 (%)
- Exhibits66: Market opportunity by Distribution Channel ($ billion)
- Exhibits67: Data Table on Market opportunity by Distribution Channel ($ billion)
- Exhibits68: Analysis of price sensitivity, lifecycle, customer purchase basket, adoption rates, and purchase criteria
- Exhibits69: Chart on Market share by geography 2023-2028 (%)
- Exhibits70: Data Table on Market share by geography 2023-2028 (%)
- Exhibits71: Chart on Geographic comparison
- Exhibits72: Data Table on Geographic comparison
- Exhibits73: Chart on Europe - Market size and forecast 2023-2028 ($ billion)
- Exhibits74: Data Table on Europe - Market size and forecast 2023-2028 ($ billion)
- Exhibits75: Chart on Europe - Year-over-year growth 2023-2028 (%)
- Exhibits76: Data Table on Europe - Year-over-year growth 2023-2028 (%)
- Exhibits77: Chart on APAC - Market size and forecast 2023-2028 ($ billion)
- Exhibits78: Data Table on APAC - Market size and forecast 2023-2028 ($ billion)
- Exhibits79: Chart on APAC - Year-over-year growth 2023-2028 (%)
- Exhibits80: Data Table on APAC - Year-over-year growth 2023-2028 (%)
- Exhibits81: Chart on North America - Market size and forecast 2023-2028 ($ billion)
- Exhibits82: Data Table on North America - Market size and forecast 2023-2028 ($ billion)
- Exhibits83: Chart on North America - Year-over-year growth 2023-2028 (%)
- Exhibits84: Data Table on North America - Year-over-year growth 2023-2028 (%)
- Exhibits85: Chart on South America - Market size and forecast 2023-2028 ($ billion)
- Exhibits86: Data Table on South America - Market size and forecast 2023-2028 ($ billion)
- Exhibits87: Chart on South America - Year-over-year growth 2023-2028 (%)
- Exhibits88: Data Table on South America - Year-over-year growth 2023-2028 (%)
- Exhibits89: Chart on Middle East and Africa - Market size and forecast 2023-2028 ($ billion)
- Exhibits90: Data Table on Middle East and Africa - Market size and forecast 2023-2028 ($ billion)
- Exhibits91: Chart on Middle East and Africa - Year-over-year growth 2023-2028 (%)
- Exhibits92: Data Table on Middle East and Africa - Year-over-year growth 2023-2028 (%)
- Exhibits93: Chart on US - Market size and forecast 2023-2028 ($ billion)
- Exhibits94: Data Table on US - Market size and forecast 2023-2028 ($ billion)
- Exhibits95: Chart on US - Year-over-year growth 2023-2028 (%)
- Exhibits96: Data Table on US - Year-over-year growth 2023-2028 (%)
- Exhibits97: Chart on France - Market size and forecast 2023-2028 ($ billion)
- Exhibits98: Data Table on France - Market size and forecast 2023-2028 ($ billion)
- Exhibits99: Chart on France - Year-over-year growth 2023-2028 (%)
- Exhibits100: Data Table on France - Year-over-year growth 2023-2028 (%)
- Exhibits101: Chart on Germany - Market size and forecast 2023-2028 ($ billion)
- Exhibits102: Data Table on Germany - Market size and forecast 2023-2028 ($ billion)
- Exhibits103: Chart on Germany - Year-over-year growth 2023-2028 (%)
- Exhibits104: Data Table on Germany - Year-over-year growth 2023-2028 (%)
- Exhibits105: Chart on China - Market size and forecast 2023-2028 ($ billion)
- Exhibits106: Data Table on China - Market size and forecast 2023-2028 ($ billion)
- Exhibits107: Chart on China - Year-over-year growth 2023-2028 (%)
- Exhibits108: Data Table on China - Year-over-year growth 2023-2028 (%)
- Exhibits109: Chart on Spain - Market size and forecast 2023-2028 ($ billion)
- Exhibits110: Data Table on Spain - Market size and forecast 2023-2028 ($ billion)
- Exhibits111: Chart on Spain - Year-over-year growth 2023-2028 (%)
- Exhibits112: Data Table on Spain - Year-over-year growth 2023-2028 (%)
- Exhibits113: Market opportunity by geography ($ billion)
- Exhibits114: Data Tables on Market opportunity by geography ($ billion)
- Exhibits115: Impact of drivers and challenges in 2023 and 2028
- Exhibits116: Overview on criticality of inputs and factors of differentiation
- Exhibits117: Overview on factors of disruption
- Exhibits118: Impact of key risks on business
- Exhibits119: Companies covered
- Exhibits120: Matrix on companies position and classification
- Exhibits121: Austevoll Seafood ASA - Overview
- Exhibits122: Austevoll Seafood ASA - Business segments
- Exhibits123: Austevoll Seafood ASA - Key offerings
- Exhibits124: Austevoll Seafood ASA - Segment focus
- Exhibits125: Faroese Seafood - Overview
- Exhibits126: Faroese Seafood - Product / Service
- Exhibits127: Faroese Seafood - Key offerings
- Exhibits128: Freiremar SA - Overview
- Exhibits129: Freiremar SA - Product / Service
- Exhibits130: Freiremar SA - Key offerings
- Exhibits131: Grieg Seafood ASA - Overview
- Exhibits132: Grieg Seafood ASA - Business segments
- Exhibits133: Grieg Seafood ASA - Key offerings
- Exhibits134: Grieg Seafood ASA - Segment focus
- Exhibits135: Lee Fish - Overview
- Exhibits136: Lee Fish - Product / Service
- Exhibits137: Lee Fish - Key offerings
- Exhibits138: Lee Fishing Co. - Overview
- Exhibits139: Lee Fishing Co. - Product / Service
- Exhibits140: Lee Fishing Co. - Key offerings
- Exhibits141: Metro Seafood Ltd. - Overview
- Exhibits142: Metro Seafood Ltd. - Product / Service
- Exhibits143: Metro Seafood Ltd. - Key offerings
- Exhibits144: Midseas Ltd. - Overview
- Exhibits145: Midseas Ltd. - Product / Service
- Exhibits146: Midseas Ltd. - Key offerings
- Exhibits147: Mowi ASA - Overview
- Exhibits148: Mowi ASA - Business segments
- Exhibits149: Mowi ASA - Key offerings
- Exhibits150: Mowi ASA - Segment focus
- Exhibits151: Nutreco N.V. - Overview
- Exhibits152: Nutreco N.V. - Product / Service
- Exhibits153: Nutreco N.V. - Key offerings
- Exhibits154: Ocean Fresh Seafood - Overview
- Exhibits155: Ocean Fresh Seafood - Product / Service
- Exhibits156: Ocean Fresh Seafood - Key offerings
- Exhibits157: Seattle Fish Co. - Overview
- Exhibits158: Seattle Fish Co. - Product / Service
- Exhibits159: Seattle Fish Co. - Key offerings
- Exhibits160: Tesco Plc - Overview
- Exhibits161: Tesco Plc - Business segments
- Exhibits162: Tesco Plc - Key news
- Exhibits163: Tesco Plc - Key offerings
- Exhibits164: Tesco Plc - Segment focus
- Exhibits165: True World Foods LLC - Overview
- Exhibits166: True World Foods LLC - Product / Service
- Exhibits167: True World Foods LLC - Key offerings
- Exhibits168: Wm Morrison Supermarkets Ltd. - Overview
- Exhibits169: Wm Morrison Supermarkets Ltd. - Product / Service
- Exhibits170: Wm Morrison Supermarkets Ltd. - Key offerings
- Exhibits171: Inclusions checklist
- Exhibits172: Exclusions checklist
- Exhibits173: Currency conversion rates for US$
- Exhibits174: Research methodology
- Exhibits175: Information sources
- Exhibits176: Data validation
- Exhibits177: Validation techniques employed for market sizing
- Exhibits178: Data synthesis
- Exhibits179: 360 degree market analysis
- Exhibits180: List of abbreviations
The frozen fish and seafood market is forecasted to grow by USD 34.6 bn during 2023-2028, accelerating at a CAGR of 8.07% during the forecast period. The report on the frozen fish and seafood market provides a holistic analysis, market size and forecast, trends, growth drivers, and challenges, as well as vendor analysis covering around 25 vendors.
The report offers an up-to-date analysis regarding the current market scenario, the latest trends and drivers, and the overall market environment. The market is driven by growing desire for convenience, demand for processed seafood, and increasing prominence of land-based fish farming.
Technavio's frozen fish and seafood market is segmented as below:
| Market Scope | |
|---|---|
| Base Year | 2024 |
| End Year | 2028 |
| Series Year | 2024-2028 |
| Growth Momentum | Accelerate |
| YOY 2024 | 7.26% |
| CAGR | 8.07% |
| Incremental Value | $34.6bn |
By End-user
- Food processing industry
- Food service provider
- Retail and household
- Animal feed and pet food
By Distribution Channel
- Offline
- Online
By Geography
- Europe
- APAC
- North America
- South America
- Middle East and Africa
This study identifies the innovation in frozen fish and seafood packaging as one of the prime reasons driving the frozen fish and seafood market growth during the next few years. Also, emergence of sustainable fishing practices and growth in online retailing will lead to sizable demand in the market.
The report on the frozen fish and seafood market covers the following areas:
- Frozen fish and seafood market sizing
- Frozen fish and seafood market forecast
- Frozen fish and seafood market industry analysis
The robust vendor analysis is designed to help clients improve their market position, and in line with this, this report provides a detailed analysis of several leading frozen fish and seafood market vendors that include Austevoll Seafood ASA, Faroese Seafood, Freiremar SA, Grieg Seafood ASA, Lee Fish, Lee Fishing Co., Metro Seafood Ltd., Midseas Ltd., Mowi ASA, Nutreco N.V., Ocean Fresh Seafood, Pescafresh, Seattle Fish Co., Surapon Foods Public Co. Ltd., Tassal Group, Tesco Plc, Trident Seafoods Corp., Tropic Star Seafood Inc., True World Foods LLC, and Wm Morrison Supermarkets Ltd.. Also, the frozen fish and seafood market analysis report includes information on upcoming trends and challenges that will influence market growth. This is to help companies strategize and leverage all forthcoming growth opportunities.
The study was conducted using an objective combination of primary and secondary information including inputs from key participants in the industry. The report contains a comprehensive market and vendor landscape in addition to an analysis of the key vendors.
The publisher presents a detailed picture of the market by the way of study, synthesis, and summation of data from multiple sources by an analysis of key parameters such as profit, pricing, competition, and promotions. It presents various market facets by identifying the key industry influencers. The data presented is comprehensive, reliable, and a result of extensive research - both primary and secondary. The market research reports provide a complete competitive landscape and an in-depth vendor selection methodology and analysis using qualitative and quantitative research to forecast the accurate market growth.
Table of Contents
1 Executive Summary
- 1.1 Market overview
- Executive Summary - Chart on Market Overview
- Executive Summary - Data Table on Market Overview
- Executive Summary - Chart on Global Market Characteristics
- Executive Summary - Chart on Market by Geography
- Executive Summary - Chart on Market Segmentation by End-user
- Executive Summary - Chart on Market Segmentation by Distribution Channel
- Executive Summary - Chart on Incremental Growth
- Executive Summary - Data Table on Incremental Growth
- Executive Summary - Chart on Company Market Positioning
2 Market Landscape
- 2.1 Market ecosystem
- Parent Market
- Data Table on - Parent Market
- 2.2 Market characteristics
- Market characteristics analysis
- 2.3 Value chain analysis
- Value Chain Analysis
3 Market Sizing
- 3.1 Market definition
- Offerings of companies included in the market definition
- 3.2 Market segment analysis
- Market segments
- 3.3 Market size 2023
- 3.4 Market outlook: Forecast for 2023-2028
- Chart on Global - Market size and forecast 2023-2028 ($ billion)
- Data Table on Global - Market size and forecast 2023-2028 ($ billion)
- Chart on Global Market: Year-over-year growth 2023-2028 (%)
- Data Table on Global Market: Year-over-year growth 2023-2028 (%)
4 Historic Market Size
- 4.1 Global Frozen Fish And Seafood Market 2018 - 2022
- Historic Market Size - Data Table on Global Frozen Fish And Seafood Market 2018 - 2022 ($ billion)
- 4.2 End-user segment analysis 2018 - 2022
- Historic Market Size - End-user Segment 2018 - 2022 ($ billion)
- 4.3 Distribution Channel segment analysis 2018 - 2022
- Historic Market Size - Distribution Channel Segment 2018 - 2022 ($ billion)
- 4.4 Geography segment analysis 2018 - 2022
- Historic Market Size - Geography Segment 2018 - 2022 ($ billion)
- 4.5 Country segment analysis 2018 - 2022
- Historic Market Size - Country Segment 2018 - 2022 ($ billion)
5 Five Forces Analysis
- 5.1 Five forces summary
- Five forces analysis - Comparison between 2023 and 2028
- 5.2 Bargaining power of buyers
- Bargaining power of buyers - Impact of key factors 2023 and 2028
- 5.3 Bargaining power of suppliers
- Bargaining power of suppliers - Impact of key factors in 2023 and 2028
- 5.4 Threat of new entrants
- Threat of new entrants - Impact of key factors in 2023 and 2028
- 5.5 Threat of substitutes
- Threat of substitutes - Impact of key factors in 2023 and 2028
- 5.6 Threat of rivalry
- Threat of rivalry - Impact of key factors in 2023 and 2028
- 5.7 Market condition
- Chart on Market condition - Five forces 2023 and 2028
6 Market Segmentation by End-user
- 6.1 Market segments
- Chart on End-user - Market share 2023-2028 (%)
- Data Table on End-user - Market share 2023-2028 (%)
- 6.2 Comparison by End-user
- Chart on Comparison by End-user
- Data Table on Comparison by End-user
- 6.3 Food processing industry - Market size and forecast 2023-2028
- Chart on Food processing industry - Market size and forecast 2023-2028 ($ billion)
- Data Table on Food processing industry - Market size and forecast 2023-2028 ($ billion)
- Chart on Food processing industry - Year-over-year growth 2023-2028 (%)
- Data Table on Food processing industry - Year-over-year growth 2023-2028 (%)
- 6.4 Food service provider - Market size and forecast 2023-2028
- Chart on Food service provider - Market size and forecast 2023-2028 ($ billion)
- Data Table on Food service provider - Market size and forecast 2023-2028 ($ billion)
- Chart on Food service provider - Year-over-year growth 2023-2028 (%)
- Data Table on Food service provider - Year-over-year growth 2023-2028 (%)
- 6.5 Retail and household - Market size and forecast 2023-2028
- Chart on Retail and household - Market size and forecast 2023-2028 ($ billion)
- Data Table on Retail and household - Market size and forecast 2023-2028 ($ billion)
- Chart on Retail and household - Year-over-year growth 2023-2028 (%)
- Data Table on Retail and household - Year-over-year growth 2023-2028 (%)
- 6.6 Animal feed and pet food - Market size and forecast 2023-2028
- Chart on Animal feed and pet food - Market size and forecast 2023-2028 ($ billion)
- Data Table on Animal feed and pet food - Market size and forecast 2023-2028 ($ billion)
- Chart on Animal feed and pet food - Year-over-year growth 2023-2028 (%)
- Data Table on Animal feed and pet food - Year-over-year growth 2023-2028 (%)
- 6.7 Market opportunity by End-user
- Market opportunity by End-user ($ billion)
- Data Table on Market opportunity by End-user ($ billion)
7 Market Segmentation by Distribution Channel
- 7.1 Market segments
- Chart on Distribution Channel - Market share 2023-2028 (%)
- Data Table on Distribution Channel - Market share 2023-2028 (%)
- 7.2 Comparison by Distribution Channel
- Chart on Comparison by Distribution Channel
- Data Table on Comparison by Distribution Channel
- 7.3 Offline - Market size and forecast 2023-2028
- Chart on Offline - Market size and forecast 2023-2028 ($ billion)
- Data Table on Offline - Market size and forecast 2023-2028 ($ billion)
- Chart on Offline - Year-over-year growth 2023-2028 (%)
- Data Table on Offline - Year-over-year growth 2023-2028 (%)
- 7.4 Online - Market size and forecast 2023-2028
- Chart on Online - Market size and forecast 2023-2028 ($ billion)
- Data Table on Online - Market size and forecast 2023-2028 ($ billion)
- Chart on Online - Year-over-year growth 2023-2028 (%)
- Data Table on Online - Year-over-year growth 2023-2028 (%)
- 7.5 Market opportunity by Distribution Channel
- Market opportunity by Distribution Channel ($ billion)
- Data Table on Market opportunity by Distribution Channel ($ billion)
8 Customer Landscape
- 8.1 Customer landscape overview
- Analysis of price sensitivity, lifecycle, customer purchase basket, adoption rates, and purchase criteria
9 Geographic Landscape
- 9.1 Geographic segmentation
- Chart on Market share by geography 2023-2028 (%)
- Data Table on Market share by geography 2023-2028 (%)
- 9.2 Geographic comparison
- Chart on Geographic comparison
- Data Table on Geographic comparison
- 9.3 Europe - Market size and forecast 2023-2028
- Chart on Europe - Market size and forecast 2023-2028 ($ billion)
- Data Table on Europe - Market size and forecast 2023-2028 ($ billion)
- Chart on Europe - Year-over-year growth 2023-2028 (%)
- Data Table on Europe - Year-over-year growth 2023-2028 (%)
- 9.4 APAC - Market size and forecast 2023-2028
- Chart on APAC - Market size and forecast 2023-2028 ($ billion)
- Data Table on APAC - Market size and forecast 2023-2028 ($ billion)
- Chart on APAC - Year-over-year growth 2023-2028 (%)
- Data Table on APAC - Year-over-year growth 2023-2028 (%)
- 9.5 North America - Market size and forecast 2023-2028
- Chart on North America - Market size and forecast 2023-2028 ($ billion)
- Data Table on North America - Market size and forecast 2023-2028 ($ billion)
- Chart on North America - Year-over-year growth 2023-2028 (%)
- Data Table on North America - Year-over-year growth 2023-2028 (%)
- 9.6 South America - Market size and forecast 2023-2028
- Chart on South America - Market size and forecast 2023-2028 ($ billion)
- Data Table on South America - Market size and forecast 2023-2028 ($ billion)
- Chart on South America - Year-over-year growth 2023-2028 (%)
- Data Table on South America - Year-over-year growth 2023-2028 (%)
- 9.7 Middle East and Africa - Market size and forecast 2023-2028
- Chart on Middle East and Africa - Market size and forecast 2023-2028 ($ billion)
- Data Table on Middle East and Africa - Market size and forecast 2023-2028 ($ billion)
- Chart on Middle East and Africa - Year-over-year growth 2023-2028 (%)
- Data Table on Middle East and Africa - Year-over-year growth 2023-2028 (%)
- 9.8 US - Market size and forecast 2023-2028
- Chart on US - Market size and forecast 2023-2028 ($ billion)
- Data Table on US - Market size and forecast 2023-2028 ($ billion)
- Chart on US - Year-over-year growth 2023-2028 (%)
- Data Table on US - Year-over-year growth 2023-2028 (%)
- 9.9 France - Market size and forecast 2023-2028
- Chart on France - Market size and forecast 2023-2028 ($ billion)
- Data Table on France - Market size and forecast 2023-2028 ($ billion)
- Chart on France - Year-over-year growth 2023-2028 (%)
- Data Table on France - Year-over-year growth 2023-2028 (%)
- 9.10 Germany - Market size and forecast 2023-2028
- Chart on Germany - Market size and forecast 2023-2028 ($ billion)
- Data Table on Germany - Market size and forecast 2023-2028 ($ billion)
- Chart on Germany - Year-over-year growth 2023-2028 (%)
- Data Table on Germany - Year-over-year growth 2023-2028 (%)
- 9.11 China - Market size and forecast 2023-2028
- Chart on China - Market size and forecast 2023-2028 ($ billion)
- Data Table on China - Market size and forecast 2023-2028 ($ billion)
- Chart on China - Year-over-year growth 2023-2028 (%)
- Data Table on China - Year-over-year growth 2023-2028 (%)
- 9.12 Spain - Market size and forecast 2023-2028
- Chart on Spain - Market size and forecast 2023-2028 ($ billion)
- Data Table on Spain - Market size and forecast 2023-2028 ($ billion)
- Chart on Spain - Year-over-year growth 2023-2028 (%)
- Data Table on Spain - Year-over-year growth 2023-2028 (%)
- 9.13 Market opportunity by geography
- Market opportunity by geography ($ billion)
- Data Tables on Market opportunity by geography ($ billion)
10 Drivers, Challenges, and Opportunity/Restraints
- 10.1 Market drivers
- 10.2 Market challenges
- 10.3 Impact of drivers and challenges
- Impact of drivers and challenges in 2023 and 2028
- 10.4 Market opportunities/restraints
11 Competitive Landscape
- 11.1 Overview
- 11.2 Competitive Landscape
- Overview on criticality of inputs and factors of differentiation
- 11.3 Landscape disruption
- Overview on factors of disruption
- 11.4 Industry risks
- Impact of key risks on business
12 Competitive Analysis
- 12.1 Companies profiled
- Companies covered
- 12.2 Market positioning of companies
- Matrix on companies position and classification
- 12.3 Austevoll Seafood ASA
- Austevoll Seafood ASA - Overview
- Austevoll Seafood ASA - Business segments
- Austevoll Seafood ASA - Key offerings
- Austevoll Seafood ASA - Segment focus
- 12.4 Faroese Seafood
- Faroese Seafood - Overview
- Faroese Seafood - Product / Service
- Faroese Seafood - Key offerings
- 12.5 Freiremar SA
- Freiremar SA - Overview
- Freiremar SA - Product / Service
- Freiremar SA - Key offerings
- 12.6 Grieg Seafood ASA
- Grieg Seafood ASA - Overview
- Grieg Seafood ASA - Business segments
- Grieg Seafood ASA - Key offerings
- Grieg Seafood ASA - Segment focus
- 12.7 Lee Fish
- Lee Fish - Overview
- Lee Fish - Product / Service
- Lee Fish - Key offerings
- 12.8 Lee Fishing Co.
- Lee Fishing Co. - Overview
- Lee Fishing Co. - Product / Service
- Lee Fishing Co. - Key offerings
- 12.9 Metro Seafood Ltd.
- Metro Seafood Ltd. - Overview
- Metro Seafood Ltd. - Product / Service
- Metro Seafood Ltd. - Key offerings
- 12.10 Midseas Ltd.
- Midseas Ltd. - Overview
- Midseas Ltd. - Product / Service
- Midseas Ltd. - Key offerings
- 12.11 Mowi ASA
- Mowi ASA - Overview
- Mowi ASA - Business segments
- Mowi ASA - Key offerings
- Mowi ASA - Segment focus
- 12.12 Nutreco N.V.
- Nutreco N.V. - Overview
- Nutreco N.V. - Product / Service
- Nutreco N.V. - Key offerings
- 12.13 Ocean Fresh Seafood
- Ocean Fresh Seafood - Overview
- Ocean Fresh Seafood - Product / Service
- Ocean Fresh Seafood - Key offerings
- 12.14 Seattle Fish Co.
- Seattle Fish Co. - Overview
- Seattle Fish Co. - Product / Service
- Seattle Fish Co. - Key offerings
- 12.15 Tesco Plc
- Tesco Plc - Overview
- Tesco Plc - Business segments
- Tesco Plc - Key news
- Tesco Plc - Key offerings
- Tesco Plc - Segment focus
- 12.16 True World Foods LLC
- True World Foods LLC - Overview
- True World Foods LLC - Product / Service
- True World Foods LLC - Key offerings
- 12.17 Wm Morrison Supermarkets Ltd.
- Wm Morrison Supermarkets Ltd. - Overview
- Wm Morrison Supermarkets Ltd. - Product / Service
- Wm Morrison Supermarkets Ltd. - Key offerings
13 Appendix
- 13.1 Scope of the report
- 13.2 Inclusions and exclusions checklist
- Inclusions checklist
- Exclusions checklist
- 13.3 Currency conversion rates for US$
- Currency conversion rates for US$
- 13.4 Research methodology
- Research methodology
- 13.5 Data procurement
- Information sources
- 13.6 Data validation
- Data validation
- 13.7 Validation techniques employed for market sizing
- Validation techniques employed for market sizing
- 13.8 Data synthesis
- Data synthesis
- 13.9 360 degree market analysis
- 360 degree market analysis
- 13.10 List of abbreviations
- List of abbreviations
