
アジア太平洋の水産物-市場シェア分析、産業動向、成長予測(2025年~2030年)
Asia-Pacific Seafood - Market Share Analysis, Industry Trends & Statistics, Growth Forecasts (2025 - 2030)- 発行日
- ページ情報
- 英文 227 Pages
- 納期
- 2~3営業日
- 商品コード
- 1692052
- カスタマイズ可能 お客様のご希望に応じて、既存データの加工や未掲載情報(例:国別セグメント)の追加などの対応が可能です。詳細はお問い合わせください。
- 適宜更新あり 本レポートは最新情報反映のため適宜更新し、内容構成変更を行う場合があります。ご検討の際はお問い合わせください。
- 翻訳ツール提供対象 PDF対応AI翻訳ツールの無料貸し出しサービスのご利用が可能です
概要
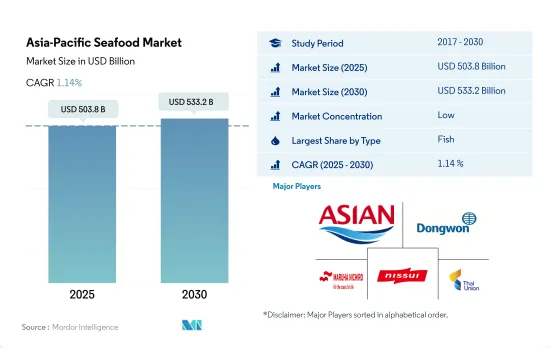
アジア太平洋の水産物市場規模は2025年に5,038億米ドルと推定され、2030年には5,332億米ドルに達すると予測され、予測期間中(2025年~2030年)のCAGRは1.14%で成長すると予測されます。
この地域における食品施設の増加が市場の成長を後押ししています。
- 2022年の市場シェアは、魚類が他の魚介類より61%、エビが68.4%高かったです。魚種別セグメントは2016年から2021年にかけて金額ベースで21.2%の成長を記録したが、これは主に人口の増加によるもので、エビや他の魚介類に比べて手頃な価格であることから、魚に対する消費者の嗜好が高まりました。2022年には、1人当たりの魚の消費量が50年前の平均の2倍になります。
- エビはアジア太平洋で消費される水産物の中で最も急成長し、予測期間中に金額ベースでCAGR 2.07%を記録すると予想されます。アジア太平洋地域におけるエビの総売上の約60%は中国が占めています。食品施設のようなHRI企業の増加は2021年から1.2%に上昇し、COVID-19パンデミック後の2022年には970万店に達します。食品施設は、アジア太平洋地域全体でエビのような水産物メニューの追加や水産物の多様なテイストの追加など、メニューの変更を通じて顧客を引き付けており、これが売上を促進し、市場シェアを拡大すると予想されます。
- COVID-19パンデミックは、労働者不足や自動化の欠如といった要因を通じて水産物のサプライチェーンを混乱させ、2020年から2021年にかけてすべての利害関係者に影響を与えました。この種の流行に伴うリスクを軽減するため、業界では中国やインドなどの国々で水産物への物流、包装、自動化への投資が増加しました。タイ・ユニオンのような大企業は、高度なトレーサビリティのために衛星技術の利用を開始し、食品や宅配を通じてオンラインでの存在感を高め、企業の売上をさらに押し上げました。この業界では、2019年から2021年にかけて、東南アジアでは約7,000万人がオンラインで買い物をしています。
主に健康意識の高まりが市場を牽引
- アジア太平洋市場では、水産物売上は2017年から2022年にかけて金額ベースで12.99%増加しました。同地域の非ベジタリアンの消費者は、徐々にペスカタリアンのライフスタイルを取り入れつつあります。顧客の健康的な食生活への志向の高まりにより、この動きは注目されています。アジアは2022年に世界の水産物販売の73%を占め、利用可能な水産物供給の3分の2以上を消費しました。
- 2022年、中国はアジア太平洋水産物市場において金額ベースで49.64%という大きなシェアを占めました。中国における水産物に対する高い国内需要は、可処分所得の増加により中産階級の消費者の間で水産物に対する嗜好が高まっていることに加え、水産物は健康的なタンパク源であるという消費者の認識が高まっているためです。同国では水産物への支出が増加しており、市場は高品質で付加価値の高い魚介類製品に対する需要の伸びが予想されます。
- インドネシアは2022年の金額ベースで10.44%を占め、アジア太平洋の魚類市場で2番目に高いシェアを占めています。インドネシアのほとんどの漁業は乱獲または完全に搾取されており、違法漁業が一般的であるため、同国政府は地元の漁業を保護するためのイニシアチブをとっています。ネイチャー・コンサーバンシーなどの団体は、魚類資源の監視、漁船の追跡、魚種識別技術の開発、小規模近海漁業における権利に基づく管理の推進などの取り組みを通じて、インドネシアの漁業慣行を変革しています。日本は、政府の水産庁が資源管理政策の改善によって漁獲数の増加に取り組んでいる他の主要市場のひとつです。こうした取り組みにより、アジア太平洋諸国全体の食料自給率が向上しています。
アジア太平洋の水産物市場動向
東南アジア諸国が主要生産シェアを占める
- 同地域の魚類生産量は2017年から2022年にかけて3.99%増加しました。アジアは過去20年間養殖産業を支配しており、東南アジアがこのセグメントをリードしています。インドネシアは東南アジアトップの養殖生産国であり、地域の養殖生産全体の約50%を占めています。ベトナム、フィリピン、タイもこの地域の主要養殖生産国です。インドネシアはまた、汽水養殖と海洋養殖、特にエビの生産に関しては地域のリーダーです。淡水養殖に関しては、ベトナムがリードし、インドネシアがそれに続きます。
- 2022年、中国の魚類生産量は2021年比で6.86%増加しました。2022年には、池での生産が中国の養殖生産全体の半分以上を占め、ケージシステムを収容する貯水池が全体の28.8%、河川が3.49%を占めました。2022年、中国政府は第14次5ヵ年国家水産開発計画(NFDP)を開始し、2025年までに6,900万トンの水産物を生産することを目標としています。これは、中国の広大な漁業部門が今後も成長し続けることを示しています。
- インドの魚類生産量は、2022年に過去最高の89億9,000万トンに達しました。内水面での魚類生産は、主に養殖の形で劇的に増加しました。2000~2001年の内陸魚生産量は28.23lakhトンであったが、2021~2022年には121.21lakhトンに増加し、400%増となりました。内水面魚の生産量の増加は、漁業科学者、中央・州政府の一致団結した努力の結果であり、漁業者、養殖業者、企業家のコミットメントの結果でもあります。
価格上昇の主因はサプライチェーン・コストの上昇
- 魚の価格はアジア太平洋地域で大きな変化を経験し、2022年には2017年比で6.53%の伸びを示しました。中国では、魚類は甲殻類、軟体動物、頭足類とは異なり、中国の一般家庭に広く普及しており、家庭で簡単に調理できるため、カテゴリー全体におけるシェアを拡大しました。消費者は、品質が良く、天然で、安全で、健康的であると認識する魚介類製品には、プレミアム価格を支払うことを厭わないです。2022年には、銀鯉の魚価は0.9米ドル/kgから、ターボットの魚価は12米ドル/kgから始まりました。ティラピアのような一般的な魚種も価格が上昇しました。魚の販売を促進し、農家が飼料費のローンを返済できるようにするために価格が引き上げられました。また、一部の農家は将来の価格上昇を見込んで在庫を保有し、価格を押し上げました。
- インドでは、ほとんどの消費者が魚介類は健康的でバランスのとれた食生活の重要な一部とみなしています。インドでは2022年第2四半期、海水温の上昇と燃料価格の上昇により漁獲活動が減少しました。そのため、鮮魚の供給が激減し、高級魚種も一般魚種も20~30%の価格上昇につながりました。インドでは、2022年第2四半期の主要魚種の価格は、サバとイワシが2.64米ドル/kg、シロギス13.21米ドル/kg、イサキ14.53米ドル/kgでした。オーストラリアの水産物価格は、サプライチェーン問題と労働力不足の継続的な影響により、過去最高値まで上昇しました。2022年のサーモン価格は前年比30%も上昇し、34.05米ドル/kgとなりました。クィーンズランド産魚の価格は競争力を維持し、2022年には天然クィーンズランド産のノーザン・キングフィッシュが18.18米ドル/kg、大型の天然タイガーフィッシュが23.60米ドル/kgとなり、値打ちがありました。
アジア太平洋の水産物産業の概要
アジア太平洋の水産物市場は断片化されており、上位5社で1.82%を占めています。この市場の主要企業は以下の通りです。 Asian Sea Corporation Public Company Limited, Dongwon Industries Ltd, Maruha Nichiro Corporation, Nippon Suisan Kaisha Ltd and Thai Union Group PCL(sorted alphabetically).
その他の特典
- エクセル形式の市場予測(ME)シート
- 3ヶ月のアナリストサポート
目次
第1章 エグゼクティブサマリーと主な調査結果
第2章 イントロダクション
- 調査の前提条件と市場定義
- 調査範囲
- 調査手法
第3章 主要産業動向
- 価格動向
- 魚
- エビ
- 生産動向
- 魚
- エビ
- 規制の枠組み
- オーストラリア
- 中国
- インド
- 日本
- バリューチェーンと流通チャネル分析
第4章 市場セグメンテーション
- タイプ
- 魚
- エビ
- その他の水産物
- 形態
- 缶詰
- 生鮮・冷蔵
- 冷凍
- 加工
- 流通チャネル
- オフ・トレード
- コンビニエンスストア
- オンライン・チャネル
- スーパーマーケットとハイパーマーケット
- その他
- オン・トレード
- オフ・トレード
- 国名
- オーストラリア
- 中国
- インド
- インドネシア
- 日本
- マレーシア
- 韓国
- その他のアジア太平洋
第5章 競合情勢
- 主要な戦略動向
- 市場シェア分析
- 企業情勢
- 企業プロファイル
- American Seafoods Company LLC
- Asian Sea Corporation Public Company Limited
- Blue Snow Food Co. Ltd
- Dongwon Industries Ltd
- Maruha Nichiro Corporation
- Millennium Ocean Star Corporation
- Nippon Suisan Kaisha Ltd
- Thai Union Group PCL
- Wynntech Star Sdn Bhd
第6章 CEOへの主な戦略的質問
第7章 付録
- 世界概要
- 概要
- ファイブフォース分析フレームワーク
- 世界のバリューチェーン分析
- 市場力学(DROs)
- 情報源と参考文献
- 図表一覧
- 主要洞察
- データパック
- 用語集
目次
The Asia-Pacific Seafood Market size is estimated at 503.8 billion USD in 2025, and is expected to reach 533.2 billion USD by 2030, growing at a CAGR of 1.14% during the forecast period (2025-2030).
Increasing in food establishments in the region is boosting the market's growth
- In 2022, the fish type segment occupied a 61% higher market share than the other seafood type segment and a 68.4% higher market share than the shrimp segment. The fish type segment registered a growth of 21.2% by value from 2016 to 2021, mainly due to an increase in the population, which led to an increase in consumer preference for fish due to its affordable cost compared to shrimp and other seafood. In 2022, each person consumed twice as much fish as 50 years ago on average.
- Shrimp is expected to be the fastest-growing seafood type consumed in Asia-Pacific, registering a CAGR of 2.07% by value during the forecast period. China accounts for around 60% of total shrimp sales in the Asia-Pacific region. The increase in HRI players like food establishments rose to 1.2% from 2021, reaching 9.7 million restaurants by 2022 after the COVID-19 pandemic. Food establishments are attracting customers through the change in menus, such as the addition of seafood menus like shrimps and varied tastes of seafood across the Asia Pacific region, which is expected to drive sales and increase market share.
- The COVID-19 pandemic disrupted seafood supply chains through factors such as a shortage of workers and lack of automation, which impacted all stakeholders from 2020 to 2021. To mitigate the risk associated with this type of outbreak, the industry saw increased investments in logistics, packaging, and automation of seafood in countries like China and India. Big companies like Thai Union started using satellite technology for advanced traceability and increased their online presence through food and home deliveries, which further boosted company sales. The industry witnessed around 70 million people shopping online in Southeast Asia from 2019 to 2021.
The market is primarily driven by rising health awareness
- In the Asia-Pacific market, seafood sales increased by 12.99% by value from 2017 to 2022. Non-vegetarian consumers in the region are gradually adopting a more pescatarian lifestyle. Due to customers' growing inclination toward a healthy diet, this movement has been noticed. Asia accounted for 73% of the seafood sales worldwide in 2022 and consumed more than two-thirds of the available seafood supply.
- In 2022, China accounted for a significant share of 49.64% by value in the Asia-Pacific seafood market. The high domestic demand for seafood in China is because of growing consumer perceptions that seafood is a healthy source of protein, along with a rising preference for seafood products among middle-class consumers owing to increasing disposable incomes. With growing spending on seafood in the country, the market is anticipated to experience a growth in demand for high-quality, value-added fish and seafood products.
- Indonesia accounted for the second-highest share in the Asia-Pacific fish market, with 10.44% by value in 2022. The country's government is taking initiatives to protect local fisheries as most of Indonesia's fisheries are over-exploited or fully exploited, with illegal fishing practices being common. Organizations such as The Nature Conservancy are transforming fishery practices in Indonesia by monitoring fish stocks, tracking fishing vessels, developing species identification technology, promoting rights-based management in small near-shore fisheries, and other initiatives. Japan is one of the other major markets where the government's Fisheries Agency is working to increase the number of fish caught by improving resource management policies. Such initiatives are increasing the food self-sufficiency rate across Asia-Pacific countries.
Asia-Pacific Seafood Market Trends
Southeast Asian countries account for the major production share
- Fish production in the region grew by 3.99% from 2017 to 2022. Asia has dominated the aquaculture industry for the past 20 years, with Southeast Asia leading the segment. Indonesia is Southeast Asia's top producer of aquaculture, accounting for around 50% of regional aquaculture production in general. Vietnam, the Philippines, and Thailand are also major producers of aquaculture in the region. Indonesia is also the regional leader when it comes to brackish water and mariculture culture, particularly in shrimp production. When it comes to fresh-water aquaculture culture, Vietnam leads the way, followed by Indonesia.
- In 2022, China's fish production grew by 6.86% compared to 2021. Pond production accounted for more than half of all aquaculture production in China, with reservoirs that house cage systems making up 28.8% of the total and rivers making up 3.49% in 2022. In 2022, the Chinese government launched its 14th five-year National Fisheries Development Plan (NFDP), which aims to produce 69 million tons of aquatic products by 2025. This indicates that China's vast fishing sector will continue to grow.
- India's fish production reached a new record high of 8990 million tons in 2022. Inland fish production, mainly in the form of aquaculture, saw a dramatic increase. In 2000-2001, inland fish production was 28.23 lakh tons, and in 2021-2022, it increased to 121.21 lakh tons, increasing by 400%. The increase in inland fish production is a result of concerted efforts by fisheries scientists and central and state governments, as well as the commitment of fishermen, fish farmers, and entrepreneurs.
Price growth can majorly be attributed to rising supply chain costs
- The price of fish experienced significant changes in the Asia-Pacific region, growing by 6.53% in 2022 compared to 2017. In China, the fish segment increased its share of the overall category as it is widely popular among Chinese households and can be easily cooked at home, unlike crustaceans, mollusks, and cephalopods. Consumers are willing to pay a premium price for fish and seafood products that they perceive to be of good quality, natural, safe, and healthy. In 2022, the prices of silver carp fish started from USD 0.9/kg, and turbot fish prices started from USD 12/kg. Common species like tilapia also saw a growth in prices. The prices were raised to encourage fish sales, allowing farmers to repay loans for feed costs. Some farmers also expected a higher price in the future and held the stocks, pushing the price higher.
- In India, seafood is considered an important part of a healthy and balanced diet by most consumers. During the 2nd quarter of 2022 in India, fish-catching activities were reduced due to an increase in sea temperature, coupled with a rise in fuel prices. Thus, the supply of fresh fish reduced drastically, leading to a 20-30% rise in prices for both premium and common species. In India, the prices of major species during the 2nd quarter of 2022 were USD 2.64/kg for mackerel and sardine, USD 13.21/kg for white pomfret, and USD 14.53/kg for seer. Australian seafood prices climbed to record highs due to the continued effects of supply chain issues and labor shortages. In 2022, the price of salmon increased by as much as 30%, reaching USD 34.05/kg compared to the previous year. Queensland fish prices remained competitive and had good value, with wild-caught Queensland northern kingfish at USD 18.18/kg and large wild-caught tigerfish at USD 23.60/kg in 2022.
Asia-Pacific Seafood Industry Overview
The Asia-Pacific Seafood Market is fragmented, with the top five companies occupying 1.82%. The major players in this market are Asian Sea Corporation Public Company Limited, Dongwon Industries Ltd, Maruha Nichiro Corporation, Nippon Suisan Kaisha Ltd and Thai Union Group PCL (sorted alphabetically).
Additional Benefits:
- The market estimate (ME) sheet in Excel format
- 3 months of analyst support
TABLE OF CONTENTS
1 EXECUTIVE SUMMARY & KEY FINDINGS
2 INTRODUCTION
- 2.1 Study Assumptions & Market Definition
- 2.2 Scope of the Study
- 2.3 Research Methodology
3 KEY INDUSTRY TRENDS
- 3.1 Price Trends
- 3.1.1 Fish
- 3.1.2 Shrimp
- 3.2 Production Trends
- 3.2.1 Fish
- 3.2.2 Shrimp
- 3.3 Regulatory Framework
- 3.3.1 Australia
- 3.3.2 China
- 3.3.3 India
- 3.3.4 Japan
- 3.4 Value Chain & Distribution Channel Analysis
4 MARKET SEGMENTATION (includes market size in Value in USD, Forecasts up to 2030 and analysis of growth prospects)
- 4.1 Type
- 4.1.1 Fish
- 4.1.2 Shrimp
- 4.1.3 Other Seafood
- 4.2 Form
- 4.2.1 Canned
- 4.2.2 Fresh / Chilled
- 4.2.3 Frozen
- 4.2.4 Processed
- 4.3 Distribution Channel
- 4.3.1 Off-Trade
- 4.3.1.1 Convenience Stores
- 4.3.1.2 Online Channel
- 4.3.1.3 Supermarkets and Hypermarkets
- 4.3.1.4 Others
- 4.3.2 On-Trade
- 4.3.1 Off-Trade
- 4.4 Country
- 4.4.1 Australia
- 4.4.2 China
- 4.4.3 India
- 4.4.4 Indonesia
- 4.4.5 Japan
- 4.4.6 Malaysia
- 4.4.7 South Korea
- 4.4.8 Rest of Asia-Pacific
5 COMPETITIVE LANDSCAPE
- 5.1 Key Strategic Moves
- 5.2 Market Share Analysis
- 5.3 Company Landscape
- 5.4 Company Profiles (includes Global level Overview, Market level overview, Core Business Segments, Financials, Headcount, Key Information, Market Rank, Market Share, Products and Services, and analysis of Recent Developments)
- 5.4.1 American Seafoods Company LLC
- 5.4.2 Asian Sea Corporation Public Company Limited
- 5.4.3 Blue Snow Food Co. Ltd
- 5.4.4 Dongwon Industries Ltd
- 5.4.5 Maruha Nichiro Corporation
- 5.4.6 Millennium Ocean Star Corporation
- 5.4.7 Nippon Suisan Kaisha Ltd
- 5.4.8 Thai Union Group PCL
- 5.4.9 Wynntech Star Sdn Bhd
6 KEY STRATEGIC QUESTIONS FOR SEAFOOD INDUSTRY CEOS
7 APPENDIX
- 7.1 Global Overview
- 7.1.1 Overview
- 7.1.2 Porter's Five Forces Framework
- 7.1.3 Global Value Chain Analysis
- 7.1.4 Market Dynamics (DROs)
- 7.2 Sources & References
- 7.3 List of Tables & Figures
- 7.4 Primary Insights
- 7.5 Data Pack
- 7.6 Glossary of Terms
- 発行日
- 発行
- Mordor Intelligence
- ページ情報
- 英文 227 Pages
- 納期
- 2~3営業日


