
|
市場調査レポート
商品コード
1692077
北米の冷凍・缶詰シーフード:市場シェア分析、産業動向と統計、成長予測(2025年~2030年)North America Frozen and Canned Seafood - Market Share Analysis, Industry Trends & Statistics, Growth Forecasts (2025 - 2030) |
||||||
カスタマイズ可能
適宜更新あり
|
|||||||
| 北米の冷凍・缶詰シーフード:市場シェア分析、産業動向と統計、成長予測(2025年~2030年) |
|
出版日: 2025年03月18日
発行: Mordor Intelligence
ページ情報: 英文 211 Pages
納期: 2~3営業日
|

全表示
- 概要
- 目次
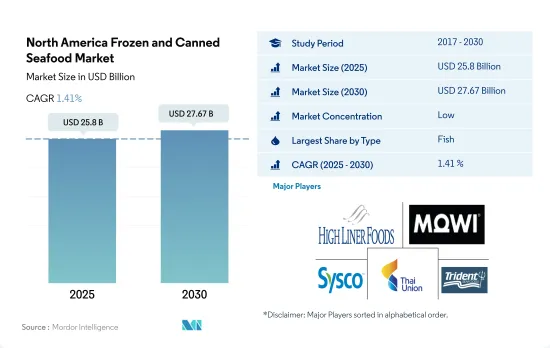
北米の冷凍・缶詰シーフード市場規模は2025年に258億米ドルと推計され、2030年には276億7,000万米ドルに達すると予測され、予測期間(2025年~2030年)のCAGRは1.41%で成長します。
簡便食需要の高まりが市場成長を後押し
- 魚の冷凍・缶詰セグメントが市場の主要シェアを占め、2022年の同地域の金額ベースでは前年比4.36%増となりました。北米の冷凍水産物市場に影響を与えている主な要因は、RTE(Ready-to-Eat)やRTC(Ready-to-Cook)といった簡便食への需要の高まりと、消費者の健康志向の高まりです。
- 冷凍・缶詰シーフード市場は2017年から2022年にかけて金額で36.40%成長しました。多忙なライフスタイル、都市化の進展、高い可処分所得により、調理が簡単で消費しやすい食品への需要も増加しています。さらに、冷凍魚介類は鮮度のピーク時に加工・冷凍されることが多く、栄養価を保ち、細菌繁殖のリスクを最小限に抑えることができます。
- 高品質で持続可能な方法で調達された魚介類に対する世界の需要は、かなりの割合で伸びています。2022年の北米における魚の冷凍・缶詰消費量は、水産物消費量全体の38.81%以上を占める。この地域では、米国が19,924kmの広い海岸線を持つ主要な水産物消費国です。
- ロブスター、カニ、カキを含むその他の水産物分野は、メキシコで最も急成長している分野です。予測期間中のCAGRは5.82%を記録すると予想されています。シーフードが健康に良いという認識が広まり、より多くの消費者がこのカテゴリーに関心を寄せています。冷凍および缶詰のロブスター、カニ、牡蠣の売上は、2020年から2022年にかけてメキシコで7.57%の伸びを示しました。西洋文化の普及もロブスターとカニの消費を押し上げています。
同地域における生産量の増加が市場促進要因となっています。
- 冷凍・缶詰シーフードの消費は近年かなり増加しています。これは、深刻な慢性疾患や炎症性疾患のリスクを低減することによって人間の健康を守ることが科学的に実証されている、魚介類の健康上の利点によるところが大きいです。シーフードはその環境面での利点から、ますます人気が高まっています。保存期間が長く、年間を通じて様々なチャネルで入手可能という利点に加え、消費者の健康意識の高まりが、冷凍水産物の販売量と販売額を押し上げています。米国の家庭の73%近くが、生鮮水産物よりも冷凍水産物を購入しています。北米では米国がトップで、2022年の金額シェアは72.17%です。
- カナダは、冷凍・缶詰シーフードの消費において最も急成長している国です。予測期間中、カナダは金額ベースでCAGR 1.77%を記録すると予測されています。広大な海岸線と水産養殖の開発が同国の消費を支えています。カナダで商業的に養殖されている魚種は、ヒレ科魚類、貝類、海藻類など約45種類に上ります。沿岸から国内各都市への移動時間が長いため、製造業者と消費者の双方にとって、傷んだり栄養素を失ったりすることなく水産物を入手できる冷凍魚は、カナダ市場で最も現実的な選択肢となっています。
- メキシコもまた、この地域の主要市場です。メキシコは最大の水産物生産国のひとつであり、国内の水産物の40%以上を持続可能な方法で供給しています。メキシコの人口の39%近くはBMI値が高いです。冷凍・缶詰シーフードは低脂肪でタンパク質と栄養素を多く含むため、メキシコの消費者にとって魅力的です。
北米の冷凍・缶詰シーフード市場動向
需要の増加と技術の進歩が生産の伸びを支えている
- 北米の魚類生産は米国がトップで、メキシコがこれに続きます。この地域ではサーモンが最も多く生産されています。しかし、技術、養殖飼料、管理技術の進歩により、利用できる魚種が増えています。海洋養殖は、国内水産物生産総重量の7%を占めています。しかし、高価値の製品に焦点を当てた結果、養殖業が成長し、国内水産物生産額の24%に貢献しています。
- カナダでは、1991年から2021年にかけて、生産額は2億3,400万米ドルから13億米ドルに、生産量は約5万トンから19万1,000トンに増加しました。業界の生産は主にヒレ科魚類が占めており、2021年には総量の78%、金額の91%を占める。ヒレ科魚類の生産量の大半は、数量、金額ともにサケです。2021年には、サケの生産だけで総量の63%、総額の74%を占める。ブリティッシュコロンビア州は依然として最大のサケ生産国で、2021年には総量の50%、総額の55%を占める。ブリティッシュコロンビア州に次いで、ニューブランズウィック州(数量で16%、金額で19%)、プリンス・エドワード・アイランド州(数量で13%、金額で4%)、ニューファンドランド・ラブラドール州(数量で10%、金額で11%)が続きます。
- メキシコには11,592kmの海岸線があり、その76%が太平洋岸、24%がメキシコ湾とカリブ海沿岸および島嶼部であるため、漁業分野では大きな可能性を秘めています。大陸棚の面積は約394,000km2で、メキシコ湾の方が広いです。また、12,500km2の沿岸のラグーンや河口、6,500km2の湖沼、ラグーン、貯水池、河川などの内水面があります。太平洋におけるマグロ漁業は重要で、年間約15万トンが漁獲されています。キハダはマグロ科の主要種です。
供給不足と経済不安がカナダとメキシコの価格に影響
- 2022年の同地域の平均魚価は前年比0.96%上昇しました。米国では水産物価格が最も高く、2022年には約2,443米ドル/トンを占める。魚介類の平均価格は調査期間中概ね上昇したが、パンデミック前の数年間は下落傾向を示しました。重量情報付きで販売された水産物の価格は、2021年に2.2%以上上昇し、2022年にはさらに5%上昇しました。重量情報なしで販売された製品については、価格動向と価格変動率は同様であったが、平均価格はより低く、伸び率の値の幅はより広くなりました。マグロとナマズは、2016年から2021年にかけて価格の伸びが最も大きくなりました。米国では、ナマズは価格が21%上昇し、約12.38米ドル/kgとなり、マグロは同期間に価格が18%上昇し、小売価格は13米ドル/kgとなりました。
- カナダでは、2017年から2022年にかけて魚の価格が14.63%上昇しました。乱獲と混獲により魚の供給が減少し、魚価が上昇しました。カナダは世界的に最も人気のある水産物を生産しており、魚の大半は輸出されています。カナダの魚価は、国際貿易による需要の増加による供給不足のために上昇しました。
- OECD-FAO農業アウトルックによると、平均名目魚価は2022年から2031年にかけて上昇し、2022年の高水準から始まるが、これはCOVIDによる2020年と2021年の価格下落から2022年の力強い価格回復を反映しています。2021年後半から2022年初頭にかけて、魚価は上昇に転じ、この地域の不安定な経済・地政学的情勢が消費に悪影響を及ぼします。
北米の冷凍・缶詰シーフード産業の概要
北米の冷凍・缶詰シーフード市場は断片化されており、上位5社で17.25%を占めています。この市場の主要企業は以下の通りです。 High Liner Foods Inc., Mowi ASA, Sysco Corporation, Thai Union Group PCL and Trident Seafood Corporation(sorted alphabetically).
その他の特典
- エクセル形式の市場予測(ME)シート
- 3ヶ月のアナリストサポート
目次
第1章 エグゼクティブサマリーと主な調査結果
第2章 イントロダクション
- 調査の前提条件と市場定義
- 調査範囲
- 調査手法
第3章 主要産業動向
- 価格動向
- 魚
- エビ
- 生産動向
- 魚
- エビ
- 規制の枠組み
- カナダ
- メキシコ
- 米国
- バリューチェーンと流通チャネル分析
第4章 市場セグメンテーション
- タイプ
- 魚
- エビ
- その他のシーフード
- 流通チャネル
- オフトレード
- コンビニエンスストア
- オンラインチャネル
- スーパーマーケットとハイパーマーケット
- その他
- オン・トレード
- オフトレード
- 国名
- カナダ
- メキシコ
- 米国
- その他の北米
第5章 競争情勢
- 主要な戦略動向
- 市場シェア分析
- 企業情勢
- 企業プロファイル
- Admiralty Island Fisheries Inc.
- American Tuna Inc.
- Beaver Street Fisheries
- Bolton Group SRL
- Dongwon Industries Ltd
- Dulcich Inc.
- FCF Co. Ltd
- Gulf Shrimp Co. LLC
- High Liner Foods Inc.
- Mowi ASA
- Pacific American Fish Company Inc.
- Sysco Corporation
- Thai Union Group PCL
- Trident Seafood Corporation
第6章 CEOへの主な戦略的質問
第7章 付録
- 世界概要
- 概要
- ファイブフォース分析フレームワーク
- 世界のバリューチェーン分析
- 市場力学(DROs)
- 情報源と参考文献
- 図表一覧
- 主要洞察
- データパック
- 用語集
The North America Frozen and Canned Seafood Market size is estimated at 25.8 billion USD in 2025, and is expected to reach 27.67 billion USD by 2030, growing at a CAGR of 1.41% during the forecast period (2025-2030).
The rising demand for convenience meals is propelling the market growth
- The frozen and canned fish segment accounted for the major share of the market, with an increase of 4.36% by value in the region in 2022 compared to the previous year. The primary factors influencing the North American market for frozen seafood products are the rising demand for convenience meals, such as ready-to-eat (RTE) and ready-to-cook (RTC) goods, and the increasing health-consciousness among consumers.
- The frozen and canned seafood market grew by 36.40% in value from 2017 to 2022. Due to busy lifestyles, growing urbanization, and high disposable incomes, the demand for easy-to-prepare and easy-to-consume food is also increasing. Moreover, frozen seafood is often processed and frozen at the peak of freshness, preserving its nutritional value and minimizing the risk of bacteria growth.
- The global demand for high-quality, sustainably sourced fish and seafood is growing at a significant rate. Frozen and canned fish consumption accounted for more than 38.81% of the overall seafood consumption in North America in 2022. In the region, the United States is the major seafood-consuming country with a wide coastline of 19,924 km.
- The other seafood segment, including lobsters, crabs, and oysters, is expected to be the fastest-growing segment in Mexico. It is expected to register a CAGR of 5.82% during the forecast period. The growing awareness about the health advantages of seafood is attracting the attention of more consumers toward the category. The sales of frozen and canned lobsters, crabs, and oysters witnessed a hike of 7.57% from 2020 to 2022 in Mexico. The increasing adoption of Western culture is also boosting the consumption of lobsters and crabs.
Rising production in the region is the primary market driver
- The consumption of frozen and canned seafood has experienced a considerable increase in recent years. This is largely attributed to the health benefits of seafood, which have been scientifically demonstrated to protect human health by reducing the risk of serious chronic and inflammatory illnesses. Seafood is becoming increasingly popular due to its environmental benefits. The added advantages of long shelf life and year-round availability across various channels, along with increased consumer health awareness, are boosting frozen seafood sales volume and value. Nearly 73% of US households purchase frozen seafood compared to fresh seafood. The United States is the leader in North America, holding a 72.17% share by value in 2022.
- Canada is anticipated to be the fastest-growing country in terms of the consumption of frozen and canned seafood. It is projected to register a CAGR of 1.77% by value during the forecast period. A vast coastal line and developing aquaculture support consumption in the country. The variety of commercially cultivated species in Canada has grown to approximately 45 kinds of finfish, shellfish, and marine algae. A long trip from the coast to various cities in the country makes frozen fish the most viable option in the Canadian market to get the seafood without damage or losing the nutrients to both manufacturers and consumers.
- Mexico is also a major market in the region. It is one of the largest seafood producers, and it provides more than 40% of domestic seafood using sustainable practices. Almost 39% of the Mexican population has high BMI rates; frozen and canned seafood are appealing to Mexican consumers as they have low fat and high amounts of proteins and nutrients.
North America Frozen and Canned Seafood Market Trends
Rising demand and advancements in technologies are helping production growth
- The US is the leading fish producer in North America, followed by Mexico. Salmon is the most produced in the region. However, advances in technology, aquaculture feeds, and management techniques are making more species available. Marine aquaculture accounts for 7% of total domestic seafood production by weight. However, the focus on high-value products has resulted in growth in aquaculture, contributing 24% of the value of domestic seafood products.
- In Canada, the production value grew from USD 234 million to USD 1.3 billion, while the production volume grew from roughly 50,000 tons to 191,000 tons from 1991 to 2021. Industry production is primarily represented by finfish, which accounted for 78% of total volume and 91% by value in 2021. The majority of finfish production, by both volume and value, is salmon. In 2021, salmon production alone accounted for 63% of the total volume and 74% of total value. British Columbia remains the largest producer of salmon, accounting for 50% of total volume and 55% of total value in 2021. British Columbia is followed by New Brunswick (16% of volume and 19% of value), Prince-Edward-Island (13% of volume and 4% of value), and Newfoundland and Labrador (10% of volume and 11% of value).
- Mexico has enormous potential in the fisheries sector, as it has 11,592 km of coastline, of which 76% is on the Pacific coast, and 24% is in the Gulf of Mexico and the Caribbean coast and islands. Its continental shelf is approximately 394 000 km2, being larger in the Gulf of Mexico. It also has 12 500 km2 of coastal lagoons and estuaries and 6 500 km2 of inland waters such as lakes, lagoons, reservoirs, and rivers. The tuna fisheries in the Pacific are significant, with around 150,000 tons per year. Yellowfin is the main species in the tuna family.
Supply shortage and economic instability are impacting the prices in Canada and Mexico
- The average fish prices in the region grew by 0.96% in 2022 compared to the previous year. In the United States, the price of seafood was the highest, accounting for around USD 2443/ton in 2022. Average seafood prices generally increased over the study period; however, the rate showed a decreasing trend in the years before the pandemic. For fish products sold with weight information, prices increased by more than 2.2% in 2021 and another 5% in 2022. For products sold without weight information, the trend in prices and percentage changes in price was similar, but with lower average prices and a wider range of growth rate values. Tuna and catfish saw the highest growth in price from 2016 to 2021. In the United States, catfish saw a growth of 21% in prices, costing around USD 12.38/kg, while tuna experienced 18% price growth in the same period with a retail price of USD 13/kg.
- In Canada, fish prices increased by 14.63% from 2017 to 2022. Due to overfishing and bycatch, the supply of fish fell, and fish prices increased. Canada produces some of the most popular seafood globally, and a majority of fish is exported. Fish prices in Canada increased due to supply shortages due to the increasing demand from international trade.
- According to the OECD-FAO Agricultural Outlook, average nominal fish prices will increase over 2022-2031, starting from a high level in 2022, reflecting a strong price recovery in 2022 from COVID-driven declines in 2020 and 2021. In late 2021 and early 2022, fish prices started to increase, with a negative impact on consumption due to an unstable economic and geopolitical situation in the region.
North America Frozen and Canned Seafood Industry Overview
The North America Frozen and Canned Seafood Market is fragmented, with the top five companies occupying 17.25%. The major players in this market are High Liner Foods Inc., Mowi ASA, Sysco Corporation, Thai Union Group PCL and Trident Seafood Corporation (sorted alphabetically).
Additional Benefits:
- The market estimate (ME) sheet in Excel format
- 3 months of analyst support
TABLE OF CONTENTS
1 EXECUTIVE SUMMARY & KEY FINDINGS
2 INTRODUCTION
- 2.1 Study Assumptions & Market Definition
- 2.2 Scope of the Study
- 2.3 Research Methodology
3 KEY INDUSTRY TRENDS
- 3.1 Price Trends
- 3.1.1 Fish
- 3.1.2 Shrimp
- 3.2 Production Trends
- 3.2.1 Fish
- 3.2.2 Shrimp
- 3.3 Regulatory Framework
- 3.3.1 Canada
- 3.3.2 Mexico
- 3.3.3 United States
- 3.4 Value Chain & Distribution Channel Analysis
4 MARKET SEGMENTATION (includes market size in Value in USD, Forecasts up to 2030 and analysis of growth prospects)
- 4.1 Type
- 4.1.1 Fish
- 4.1.2 Shrimp
- 4.1.3 Other Seafood
- 4.2 Distribution Channel
- 4.2.1 Off-Trade
- 4.2.1.1 Convenience Stores
- 4.2.1.2 Online Channel
- 4.2.1.3 Supermarkets and Hypermarkets
- 4.2.1.4 Others
- 4.2.2 On-Trade
- 4.2.1 Off-Trade
- 4.3 Country
- 4.3.1 Canada
- 4.3.2 Mexico
- 4.3.3 United States
- 4.3.4 Rest of North America
5 COMPETITIVE LANDSCAPE
- 5.1 Key Strategic Moves
- 5.2 Market Share Analysis
- 5.3 Company Landscape
- 5.4 Company Profiles (includes Global level Overview, Market level overview, Core Business Segments, Financials, Headcount, Key Information, Market Rank, Market Share, Products and Services, and analysis of Recent Developments)
- 5.4.1 Admiralty Island Fisheries Inc.
- 5.4.2 American Tuna Inc.
- 5.4.3 Beaver Street Fisheries
- 5.4.4 Bolton Group SRL
- 5.4.5 Dongwon Industries Ltd
- 5.4.6 Dulcich Inc.
- 5.4.7 FCF Co. Ltd
- 5.4.8 Gulf Shrimp Co. LLC
- 5.4.9 High Liner Foods Inc.
- 5.4.10 Mowi ASA
- 5.4.11 Pacific American Fish Company Inc.
- 5.4.12 Sysco Corporation
- 5.4.13 Thai Union Group PCL
- 5.4.14 Trident Seafood Corporation
6 KEY STRATEGIC QUESTIONS FOR SEAFOOD INDUSTRY CEOS
7 APPENDIX
- 7.1 Global Overview
- 7.1.1 Overview
- 7.1.2 Porter's Five Forces Framework
- 7.1.3 Global Value Chain Analysis
- 7.1.4 Market Dynamics (DROs)
- 7.2 Sources & References
- 7.3 List of Tables & Figures
- 7.4 Primary Insights
- 7.5 Data Pack
- 7.6 Glossary of Terms
