
|
市場調査レポート
商品コード
1692567
冷凍・缶詰シーフード-市場シェア分析、産業動向・統計、成長予測(2025年~2030年)Frozen and Canned Seafood - Market Share Analysis, Industry Trends & Statistics, Growth Forecasts (2025 - 2030) |
||||||
カスタマイズ可能
適宜更新あり
|
|||||||
| 冷凍・缶詰シーフード-市場シェア分析、産業動向・統計、成長予測(2025年~2030年) |
|
出版日: 2025年03月18日
発行: Mordor Intelligence
ページ情報: 英文 392 Pages
納期: 2~3営業日
|

全表示
- 概要
- 目次
概要
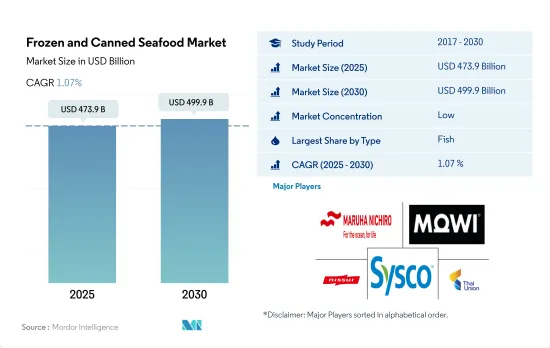
冷凍・缶詰シーフード市場規模は2025年に4,739億米ドルと推定され、2030年には4,999億米ドルに達すると予測され、予測期間(2025~2030年)のCAGRは1.07%で成長します。
利便性とポーションコントロールが市場成長の主要因のひとつ
- 世界の冷凍・缶詰シーフード市場は2017~2022年にかけてCAGR 2.44%を記録したが、これはライフスタイルの変化、健康志向の高まりに伴う水産物嗜好の上昇、可処分所得の増加、クイックミール需要の増加、プライベートブランドの出現によるものです。消費者の嗜好の変化は、缶や冷凍製品のような保存期間の長い水産物製品へのシフトを促しました。水産物缶の人気は高まっており、食品ロスや廃棄のレベルもかなり低いです。水産物缶は少量ずつ缶にされるため、ポーションコントロールも可能です。魚の缶は、2022年には金額ベースで70.69%と、市場の主要シェアを占めています。ツナ缶は世界中で消費されている最も人気のある魚の缶です。
- 食料品店における冷凍魚介類の市場情勢は、付加価値と利便性の導入により大きく変化しました。冷凍魚は世界中で消費される主要な魚介類の一種です。冷凍魚全体の販売額は2017~2022年にかけて12.47%増加しました。小売スーパーマーケットはここ数年、冷凍ケースの水産物提供を着実に拡大し、生鮮水産物カウンターの近くに高級冷凍水産物ケースを増設するところも増えています。小売業者は消費者の購買行動の変化に対応するため、水産物の選択肢を増やしています。
- 冷凍エビは最も急成長しているセグメントであり、予測期間中の推定CAGRは1.18%です。養殖産業におけるエビの急成長と、オンラインによる冷凍エビの認知度の高まりにより、冷凍エビの人気はますます高まっています。
魚やエビの養殖は大規模な投資につながります。
- 2017~2022年にかけて、冷凍・缶詰シーフード販売全体の成長率は金額ベースで21.5%に増加しました。2017~2022年にかけて魚とエビの価格がそれぞれ9%、6.5%上昇したため、人々は栄養所要量を満たすために冷凍・缶の魚介類と肉製品を消費し始めました。中国は魚とエビの養殖に大きく依存しており、このセグメントに大規模な投資を行っています。
- 2022年には、アジア太平洋が冷凍・缶詰シーフード消費の市場シェアを独占し、欧州より47.4%、アフリカより52.4%、北米より54.4%、南米より57.4%多くなりました。これはインドのような国々での水産物需要の高まりの結果であり、輸入量は2019~2021年にかけて180%増加しました。マレーシアは最大の水産物消費国のひとつで、2019~2021年にかけて冷凍/缶の魚介類輸入が15%増加しました。一方、韓国では、韓国海鮮料理の需要増加により、冷凍・缶の魚介類輸入が2019~2021年にかけて10~15%増加しました。
- 全地域の中で、アフリカは最も急速に成長している冷凍水産物国になると予測され、予測期間中の予想CAGRは金額で2.65%です。これはアフリカの個人可処分所得が上昇しているためで、2020~2021年にかけて2%から3%増加しました。この地域の動向は、都市化の進展による個人所得の増加という大陸の動向と一致しており、このことが、レディトゥイート水産物に対する顧客の嗜好をさらに後押ししています。エジプトでは魚は重要な食事源であり、一般家庭のタンパク質消費量の25.3%を占めています。推定によると、エジプト人1人当たり年間23.5kgの魚を消費しています。
世界の冷凍・缶詰シーフード市場の動向
世界の魚生産は回復傾向にある
- 魚の健康上の利点に対する意識の高まりにより、魚の需要は各地域で伸びています。魚の生産量は2017~2022年にかけて4.29%増加。2022年、生産と貿易はわずかに増加し、魚の消費は需要の増加により2018年の水準まで回復しました。2023年の水産養殖生産は2.6%の成長が見込まれ、2015~2020年までの長期成長率3.3%をわずかに下回る。燃料価格の高騰、主要資源の割当量の減少、主要漁場での天候不順はすべて、捕獲漁業の減速に寄与しました。
- アジア太平洋の魚類生産は、2022年には2021年比で7.37%の成長率を記録しました。中国では、生産の伸びは引き続き養殖生産が牽引しており、2022年には1.2%増の5,460万トンと推定されます。2021年の水産物と淡水産品の生産額比率は45.8:54.2でした。2021年、全国の養殖面積は700万9,380ヘクタールで、前年より0.38%減少しました。そのうち、2025年の海洋養殖面積は5万1,000ヘクタールで、2021年より1.50%増加しました。淡水養殖の面積は498万3,870ヘクタールです。海洋養殖と淡水養殖の比率は28.9:71.1でした。
- 2021年には、欧州で消費される魚全体の約59%がロシア産となります。ロシアは世界有数のマダラ生産国であり、欧州の重要な市場です。ウクライナとの紛争の結果、ロシアの魚介類輸出が制限されているため、この地域全体が魚不足に陥っています。EUの養殖は、EUの魚介類供給の約20%を占めています。EUでは、養殖生産量の45%以上が貝類、30%以上が海産魚、20%以上が淡水魚です。
生産量の増加と生産の混乱により、魚の価格は世界中で上昇しています。
- 異常気象と燃料価格の高騰は、すべての市場における魚の供給に影響を及ぼしています。同時に、世界の需要の増加が魚価の上昇につながっています。2023年のサーモン価格は、ノルウェーとチリの両国で上昇傾向に転じたが、スコットランドではより不安定な傾向が見られました。卸売価格と消費者価格は、いくつかの市場で記録的な高値まで上昇しました。しかし、ノルウェーの生鮮アトランティックサーモンは2023年第13週に9.69米ドル/kgで取引され、2週連続で下落しました。
- 欧州では、魚価は0.13米ドル/kgから62米ドル/kgの幅があり、2023年第1四半期はグレイガーナードが最も安く、欧州ヘイクが最も高かったです。ロシアとウクライナの紛争は、アジア向けの生鮮サーモンなど、ノルウェーからの輸出の一部に大きな影響を及ぼしました。ロシア領空の閉鎖は、韓国(18%減)や日本(20%減)などの国への出荷量に影響を与えたからです。価格高騰はまた、サケが再輸出前に燻製にされることが多い国々からの商品の流れを歪めました。例えば、ポーランドへの輸出量は2022年に18%減少しました。
- 中国のティラピアの生産者価格は2023年に5年ぶりの高値を記録しました。中国のティラピア生産量の40%近くを占める広東省では、500~800gの生きたティラピアが1.47米ドル/kgで販売され、2022年から14%上昇しました。米国国内市場では、水産物カテゴリーにおける平均を上回るインフレが生鮮・冷凍水産物販売価格の急上昇を招き、2022年上半期のティラピアの平均コストは20%以上上昇しました。北米市場に加え、欧州連合(EU)の需要も回復し、世界市場における他の魚介類の価格上昇により、ティラピア製品に対するバイヤーの関心が高まりました。
冷凍・缶詰シーフード産業概要
冷凍・缶詰シーフード市場はセグメント化されており、上位5社で3.02%を占めています。この市場の主要企業は、 Maruha Nichiro Corporation、Mowi ASA、Nippon Suisan Kaisha Ltd、Sysco Corporation、Thai Union Group PCLなどです。
その他の特典
- エクセル形式の市場予測(ME)シート
- 3ヶ月のアナリストサポート
目次
第1章 エグゼクティブサマリーと主要調査結果
第2章 イントロダクション
- 調査の前提条件と市場定義
- 調査範囲
- 調査手法
第3章 主要産業動向
- 価格動向
- 魚
- エビ
- 生産動向
- 魚
- エビ
- 規制の枠組み
- オーストラリア
- カナダ
- 中国
- フランス
- ドイツ
- インド
- イタリア
- 日本
- メキシコ
- サウジアラビア
- アラブ首長国連邦
- 英国
- 米国
- バリューチェーンと流通チャネル分析
第4章 市場セグメンテーション
- タイプ
- 魚
- エビ
- その他の水産物
- 流通チャネル
- オフトレード
- コンビニエンスストア
- オンラインチャネル
- スーパーマーケットとハイパーマーケット
- その他
- オントレード
- オフトレード
- 地域
- アフリカ
- 国別
- エジプト
- ナイジェリア
- 南アフリカ
- その他のアフリカ
- アジア太平洋
- 国別
- オーストラリア
- 中国
- インド
- インドネシア
- 日本
- マレーシア
- 韓国
- その他のアジア太平洋
- 欧州
- 国別
- フランス
- ドイツ
- イタリア
- オランダ
- ロシア
- スペイン
- 英国
- その他の欧州
- 中東
- 国別
- バーレーン
- クウェート
- オマーン
- カタール
- サウジアラビア
- アラブ首長国連邦
- その他の中東
- 北米
- 国別
- カナダ
- メキシコ
- 米国
- その他の北米
- 南米
- 国別
- アルゼンチン
- ブラジル
- その他の南米諸国
- アフリカ
第5章 競合情勢
- 主要な戦略動向
- 市場シェア分析
- 企業情勢
- 企業プロファイル
- Admiralty Island Fisheries Inc.
- Bolton Group SRL
- FCF CO. Ltd
- Golden Prize Canning Company Limited
- High Liner Foods Inc.
- Maruha Nichiro Corporation
- Mowi ASA
- Nippon Suisan Kaisha Ltd
- Sysco Corporation
- Thai Union Group PCL
- Trident Seafood Corporation
第6章 CEOへの主要戦略的質問
第7章 付録
- 世界概要
- 概要
- ファイブフォース分析フレームワーク
- 世界のバリューチェーン分析
- 市場力学(DROs)
- 情報源と参考文献
- 図表一覧
- 主要な洞察
- データパック
- 用語集
目次
Product Code: 92390
The Frozen and Canned Seafood Market size is estimated at 473.9 billion USD in 2025, and is expected to reach 499.9 billion USD by 2030, growing at a CAGR of 1.07% during the forecast period (2025-2030).
Convenience and portion control are among the major factors propelling the market's growth
- The global frozen and canned seafood market registered a CAGR of 2.44% from 2017 to 2022, owing to changing lifestyles, rising preference for seafood with growing health consciousness, rising disposable incomes, increased demand for quick meals, and the emergence of private labels. A change in consumers' preferences prompted a shift toward seafood products with a longer shelf life, like canned and frozen products. Canned seafood is growing in popularity and is associated with fairly low levels of food loss and waste. Portion control also takes place while canning since seafood is canned in small servings. Canned fish held the major share in the market, i.e., 70.69% by value in 2022. Canned tuna is the most popular canned fish consumed across the world.
- The frozen seafood marketing landscape in grocery stores has changed significantly due to the introduction of added value and convenience. Frozen fish is the major type of seafood consumed across the world. The overall sales value of frozen fish increased by 12.47% from 2017 to 2022. Retail supermarkets steadily expanded seafood offerings in their freezer cases over the last few years, and more are adding premium frozen seafood cases near fresh seafood counters. Retailers are responding to the changing purchasing behavior of consumers by providing more seafood options.
- Frozen shrimp is the fastest-growing segment, registering an estimated CAGR of 1.18% during the forecast period. Frozen shrimp has become increasingly popular due to the rapid growth of shrimps in the aquaculture industry and the growing awareness of frozen shrimp online.
Extensive fish and shrimp farming lead to extensive investments.
- The overall growth rate of frozen and canned seafood sales increased to 21.5%, by value, from 2017 to 2022. People started consuming frozen and canned seafood and meat products to fulfill their nutrient requirements as prices for fish and shrimp increased by 9% and 6.5%, respectively, from 2017 to 2022. China is heavily dependent on fish and shrimp farming and has made large-scale investments in the sector.
- In 2022, Asia-Pacific dominated frozen and canned seafood consumption with a market share of 47.4% more than Europe, 52.4% more than Africa, 54.4% more than North America, and 57.4% more than South America. This was a result of the rising demand for seafood in countries like India, where imports rose by 180% from 2019 to 2021. Malaysia is one of the biggest seafood consumers, and it saw an increase in frozen/canned fish and seafood imports by 15% from 2019 to 2021. While in South Korea, due to a rise in demand for Korean seafood dishes, frozen or canned seafood imports climbed by 10-15% between 2019 and 2021.
- Out of all the regions, Africa is predicted to be the fastest-growing frozen seafood country, with an anticipated CAGR of 2.65% in value during the forecast period. This is due to the rising personal disposable income in Africa, which increased by 2% to 3% between 2020 and 2021. The regional trend fits in with the continental trend of rising personal incomes brought on by increased urbanization, which further encouraged customer preferences for seafood that is ready to eat. Fish is a significant dietary source in Egypt, making up 25.3% of the typical household's protein consumption. According to estimates, each Egyptian consumes 23.5 kg of fish per year.
Global Frozen and Canned Seafood Market Trends
Fish production across the world is experiencing a recovery
- The demand for fish is growing across regions due to the rising awareness about its health benefits. The production of fish rose by 4.29% between 2017 and 2022. In 2022, production and trade grew slightly, and fish consumption recovered to 2018 levels due to increasing demand. Aquaculture production was anticipated to grow by 2.6% in 2023, slightly below its long-term growth rate of 3.3% between 2015 and 2020. High fuel prices, lower quotas for key stocks, and inclement weather in key fishing grounds all contributed to a slowdown in capture fisheries.
- Fish production in Asia-Pacific witnessed a growth rate of 7.37% in 2022 compared to 2021. In China, production growth continues to be driven by aquaculture production, estimated at 54.6 MMT in 2022, an increase of 1.2%. In 2021, the output value ratio of marine products to freshwater products was 45.8:54.2. In 2021, the national aquaculture area was 7009.38 thousand hectares, down by 0.38% from the previous year. Among them, the area of marine aquaculture in 2025 was 51 thousand hectares, an increase of 1.50% from 2021. The area of freshwater aquaculture was 4983.87 thousand hectares. The ratio of marine to freshwater aquaculture was 28.9:71.1.
- In 2021, about 59% of the total fish consumed in Europe came from Russia. Russia is a key market in Europe as it is one of the leading producers of cod in the world. Due to restrictions imposed on Russia's export of fish and other seafood as a result of its conflict with Ukraine, the entire region is experiencing a fish shortage. EU aquaculture accounts for around 20% of EU fish and shellfish supply. In the EU, more than 45% of aquaculture production is shellfish, more than 30% is marine fish, and more than 20% is freshwater fish.
Fish prices are increasing across the world owing to rising production as well as production disruptions
- Unusual weather and rising fuel prices have impacted the supply of fish in all markets. At the same time, increasing global demand has led to rising fish prices. Salmon prices in 2023 started on an upward trend in both Norway and Chile, while a more erratic trend was observed in Scotland. Wholesale and consumer prices rose to record highs in some markets. However, Norwegian fresh, head-on gutted Atlantic salmon sold at USD 9.69/kg in week 13 of 2023, falling for two consecutive weeks.
- In Europe, fish prices ranged from USD 0.13/kg to USD 62/kg, where Grey Gurnard was the cheapest, and European Hake was the costliest during the first quarter of 2023. The Russian-Ukrainian conflict had a significant impact on some exports from Norway, such as fresh salmon to Asia, as the closed Russian airspace had a volume impact on shipments to countries such as South Korea (-18%) and Japan (-20%). Price hikes also distorted the flow of goods from countries where salmon is largely destined for smoking before re-export. For instance, the volume of exports to Poland fell by 18% in 2022.
- Chinese producer prices for whole tilapia hit a five-year high in 2023. In Guangdong, which accounts for nearly 40% of China's tilapia production, live tilapia weighing 500-800 g was sold at USD 1.47/kg, up by 14% from 2022. In the US domestic market, above-average inflation in the seafood category led to a jump in the price of fresh and frozen seafood sales, with the average cost of tilapias rising by over 20% in the first half of 2022. In addition to the North American market, demand in the European Union also recovered, with buyer interest in tilapia products increasing due to rising prices of other seafood species in the global market.
Frozen and Canned Seafood Industry Overview
The Frozen and Canned Seafood Market is fragmented, with the top five companies occupying 3.02%. The major players in this market are Maruha Nichiro Corporation, Mowi ASA, Nippon Suisan Kaisha Ltd, Sysco Corporation and Thai Union Group PCL (sorted alphabetically).
Additional Benefits:
- The market estimate (ME) sheet in Excel format
- 3 months of analyst support
TABLE OF CONTENTS
1 EXECUTIVE SUMMARY & KEY FINDINGS
2 INTRODUCTION
- 2.1 Study Assumptions & Market Definition
- 2.2 Scope of the Study
- 2.3 Research Methodology
3 KEY INDUSTRY TRENDS
- 3.1 Price Trends
- 3.1.1 Fish
- 3.1.2 Shrimp
- 3.2 Production Trends
- 3.2.1 Fish
- 3.2.2 Shrimp
- 3.3 Regulatory Framework
- 3.3.1 Australia
- 3.3.2 Canada
- 3.3.3 China
- 3.3.4 France
- 3.3.5 Germany
- 3.3.6 India
- 3.3.7 Italy
- 3.3.8 Japan
- 3.3.9 Mexico
- 3.3.10 Saudi Arabia
- 3.3.11 United Arab Emirates
- 3.3.12 United Kingdom
- 3.3.13 United States
- 3.4 Value Chain & Distribution Channel Analysis
4 MARKET SEGMENTATION (includes market size in Value in USD, Forecasts up to 2030 and analysis of growth prospects)
- 4.1 Type
- 4.1.1 Fish
- 4.1.2 Shrimp
- 4.1.3 Other Seafood
- 4.2 Distribution Channel
- 4.2.1 Off-Trade
- 4.2.1.1 Convenience Stores
- 4.2.1.2 Online Channel
- 4.2.1.3 Supermarkets and Hypermarkets
- 4.2.1.4 Others
- 4.2.2 On-Trade
- 4.2.1 Off-Trade
- 4.3 Region
- 4.3.1 Africa
- 4.3.1.1 By Type
- 4.3.1.2 By Distribution Channel
- 4.3.1.3 By Country
- 4.3.1.3.1 Egypt
- 4.3.1.3.2 Nigeria
- 4.3.1.3.3 South Africa
- 4.3.1.3.4 Rest of Africa
- 4.3.2 Asia-Pacific
- 4.3.2.1 By Type
- 4.3.2.2 By Distribution Channel
- 4.3.2.3 By Country
- 4.3.2.3.1 Australia
- 4.3.2.3.2 China
- 4.3.2.3.3 India
- 4.3.2.3.4 Indonesia
- 4.3.2.3.5 Japan
- 4.3.2.3.6 Malaysia
- 4.3.2.3.7 South Korea
- 4.3.2.3.8 Rest of Asia-Pacific
- 4.3.3 Europe
- 4.3.3.1 By Type
- 4.3.3.2 By Distribution Channel
- 4.3.3.3 By Country
- 4.3.3.3.1 France
- 4.3.3.3.2 Germany
- 4.3.3.3.3 Italy
- 4.3.3.3.4 Netherlands
- 4.3.3.3.5 Russia
- 4.3.3.3.6 Spain
- 4.3.3.3.7 United Kingdom
- 4.3.3.3.8 Rest of Europe
- 4.3.4 Middle East
- 4.3.4.1 By Type
- 4.3.4.2 By Distribution Channel
- 4.3.4.3 By Country
- 4.3.4.3.1 Bahrain
- 4.3.4.3.2 Kuwait
- 4.3.4.3.3 Oman
- 4.3.4.3.4 Qatar
- 4.3.4.3.5 Saudi Arabia
- 4.3.4.3.6 United Arab Emirates
- 4.3.4.3.7 Rest of Middle East
- 4.3.5 North America
- 4.3.5.1 By Type
- 4.3.5.2 By Distribution Channel
- 4.3.5.3 By Country
- 4.3.5.3.1 Canada
- 4.3.5.3.2 Mexico
- 4.3.5.3.3 United States
- 4.3.5.3.4 Rest of North America
- 4.3.6 South America
- 4.3.6.1 By Type
- 4.3.6.2 By Distribution Channel
- 4.3.6.3 By Country
- 4.3.6.3.1 Argentina
- 4.3.6.3.2 Brazil
- 4.3.6.3.3 Rest of South America
- 4.3.1 Africa
5 COMPETITIVE LANDSCAPE
- 5.1 Key Strategic Moves
- 5.2 Market Share Analysis
- 5.3 Company Landscape
- 5.4 Company Profiles (includes Global level Overview, Market level overview, Core Business Segments, Financials, Headcount, Key Information, Market Rank, Market Share, Products and Services, and analysis of Recent Developments)
- 5.4.1 Admiralty Island Fisheries Inc.
- 5.4.2 Bolton Group SRL
- 5.4.3 FCF CO. Ltd
- 5.4.4 Golden Prize Canning Company Limited
- 5.4.5 High Liner Foods Inc.
- 5.4.6 Maruha Nichiro Corporation
- 5.4.7 Mowi ASA
- 5.4.8 Nippon Suisan Kaisha Ltd
- 5.4.9 Sysco Corporation
- 5.4.10 Thai Union Group PCL
- 5.4.11 Trident Seafood Corporation
6 KEY STRATEGIC QUESTIONS FOR SEAFOOD INDUSTRY CEOS
7 APPENDIX
- 7.1 Global Overview
- 7.1.1 Overview
- 7.1.2 Porter's Five Forces Framework
- 7.1.3 Global Value Chain Analysis
- 7.1.4 Market Dynamics (DROs)
- 7.2 Sources & References
- 7.3 List of Tables & Figures
- 7.4 Primary Insights
- 7.5 Data Pack
- 7.6 Glossary of Terms
