
|
市場調査レポート
商品コード
1692054
米国の水産物:市場シェア分析、産業動向、統計、成長予測(2025年~2030年)United States Seafood - Market Share Analysis, Industry Trends & Statistics, Growth Forecasts (2025 - 2030) |
||||||
カスタマイズ可能
適宜更新あり
|
|||||||
| 米国の水産物:市場シェア分析、産業動向、統計、成長予測(2025年~2030年) |
|
出版日: 2025年03月18日
発行: Mordor Intelligence
ページ情報: 英文 197 Pages
納期: 2~3営業日
|

全表示
- 概要
- 目次
概要
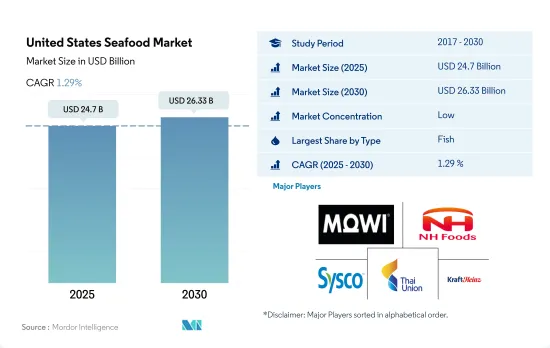
米国の水産物市場規模は2025年に247億米ドルと推定・予測され、2030年には263億3,000万米ドルに達し、予測期間中(2025年~2030年)のCAGRは1.29%で成長すると予測されています。
よりリーンな蛋白源への需要増加を緩和し、輸入依存を減らすためのハイキング生産の可能性が市場成長の原動力となっています。
- 米国の2022年の魚類(軟体動物、甲殻類を含む)生産量は780万トン、金額は90億6,550万米ドルです。この金額の約17%は養殖によるもので、83%は漁業によるものです。ここで重要なのは、米国が魚と魚介類の純輸入国であるということです。地元での生産を促進するため、政府は多くの政策や事業を通じて支援を行っています。米国で消費される主な魚介類の種類はその他の魚介類であるが、最も動きが速いのはエビであり、予測期間中のCAGRは2.3%を記録すると予測されています。
- 米国では、乱獲に対抗するため、規制当局が漁期制限、総漁獲可能量制限、漁具と船の出力制限を実施しました。その結果、漁業者はこれらの規制を回避するために新しい技術や方法を採用しました。米国では、2017年の1kgあたり19.3円から、2022年には2.4円の値上げが行われました。国内の地元養殖による水産物の生産量も増加しており、養殖業の従業員1人当たりの平均生産額は、過去10年間と比べて28%増加しています。
- 同市場は、予測期間中にCAGR 5.46%を記録する見通しです。水産物産業は国の経済に大きく貢献しています。米国は世界の養殖業における主要企業であり、魚介類および水産物の世界最大の輸入国です。また、最先端の技術、飼料、設備、投資資本を世界の他の生産者に提供しています。米国で消費される魚介類の大部分(70~85%)は輸入品であり、その半分以上を養殖が占めています。水産物の貿易赤字は2020年には170億米ドルに達します。
米国の水産物市場動向
乱獲、燃料費高騰、労働力不足が捕獲魚生産に悪影響
- 金額ベースでは、カキ、アサリ、ムール貝などの二枚貝が、2022年の米国における海洋養殖生産の80%以上を占める。米国では魚類が養殖の最大部門で、2022年には市場の66%を占め、甲殻類と軟体動物がこれに続きます。国際的に最も人気のある養殖魚の種類は、サケ、エビ、マス、スズキであるが、技術、養殖飼料、管理戦略の新たな開発により、他の魚種も利用できるようになってきています。重量で見ると、海洋養殖は国内水産物生産全体の7%を占めています。しかし、高価値のものに重点を置いているため、養殖は現在、国内水産物の価値の24%を占めています。
- 乱獲、燃料費の高騰、労働力不足は、捕獲された魚の生産に悪影響を及ぼしており、2022年には魚の生産量は15%減少します。さらに、外国人による違法漁業も漁獲高に影響を与えています。しかし、漁業生産の実質的価値の全体的低下は、養殖業の実質的価値の成長によって緩和されています。
- 国内の生産者を支援し、魚の生産を奨励するため、政府の援助が市場の成長と開拓を長年にわたって支援してきました。法律や投資を通じて支援することで、米国政府は地元で独立した水産物生産者を奨励する決意を示してきました。例えば、2022年2月、米国農務省(USDA)は、水産物加工業者パンデミック対応・安全ブロック補助金プログラム(SBRS)を通じて、水産物加工業者、加工施設、加工船を支援するために約5,000万米ドルの補助金を投資しました。
サプライチェーンの混乱が価格変動を拡大
- 国内の魚価はレビュー期間中に標準的な伸びを示し、2017年から2022年にかけて平均30.6%の伸びを記録しました。今後は需要が供給を上回ると推定されます。魚価は、特に捕獲漁業における供給増加の制限により、近年上昇傾向をたどり、引き続き旺盛な需要を記録しています。重量情報付きで販売される水産物の価格は、2021年には2.2%以上、2022年にはさらに5%上昇しました。重量情報なしで販売される製品については、価格と価格変動率の動向は同様であったが、平均価格はより低く、成長率の値の幅はより広くなりました。しかし、2021年の国際魚価は、平均して前年よりわずか6~8%上昇しただけでした。これは主に、供給が需要を上回った結果、エビ、サケ、パンガシウス、ナマズ、ティラピア、ツナ缶など、多くの重要な養殖魚種の価格が下落したためです。
- 供給面では、捕獲漁業の安定した生産、養殖生産の伸びの鈍化、飼料、エネルギー、石油などの投入コストの上昇が、このセグメントの役割を果たすと予想されます。世界の旺盛な需要により、魚粉と魚油の価格は2030年までにそれぞれ30%と13%上昇すると予想されます。
- 2022年には、米国はEUに次ぐ最大の魚輸入市場の1つであり、輸入額は約18%を占める。都市化と魚を消費する中間層の拡大が、同国の需要と成長に拍車をかけています。小売向けの米国水産物輸入は、2022年の産業生産高260億米ドル(37.0%)、付加価値額150億米ドル(39.7%)という経済貢献全体の最大シェアを支えています。
米国の水産物産業の概要
米国の水産物市場は細分化されており、上位5社で17.64%を占めています。この市場の主要企業は以下の通りです。 Mowi ASA, NH Foods Ltd, Sysco Corporation, Thai Union Group PCL and The Kraft Heinz Company(sorted alphabetically).
その他の特典
- エクセル形式の市場予測(ME)シート
- 3ヶ月のアナリストサポート
目次
第1章 エグゼクティブサマリーと主な調査結果
第2章 イントロダクション
- 調査の前提条件と市場定義
- 調査範囲
- 調査手法
第3章 主要産業動向
- 価格動向
- 魚
- エビ
- 生産動向
- 魚
- エビ
- 規制の枠組み
- 米国
- バリューチェーンと流通チャネル分析
第4章 市場セグメンテーション
- タイプ
- 魚
- エビ
- その他のシーフード
- 形態
- 缶詰
- 生鮮・冷蔵
- 冷凍
- 加工
- 流通チャネル
- オフ・トレード
- コンビニエンスストア
- オンライン・チャネル
- スーパーマーケットとハイパーマーケット
- その他
- オン・トレード
- オフ・トレード
第5章 競合情勢
- 主要な戦略動向
- 市場シェア分析
- 企業情勢
- 企業プロファイル
- Admiralty Island Fisheries Inc.
- Beaver Street Fisheries
- High Liner Foods Inc.
- Inland Seafood Inc.
- Mowi ASA
- NH Foods Ltd
- Sysco Corporation
- Thai Union Group PCL
- The Kraft Heinz Company
- Trident Seafood Corporation
第6章 CEOへの主な戦略的質問
第7章 付録
- 世界概要
- 概要
- ファイブフォース分析フレームワーク
- 世界のバリューチェーン分析
- 市場力学(DROs)
- 情報源と参考文献
- 図表一覧
- 主要洞察
- データパック
- 用語集
目次
Product Code: 90350
The United States Seafood Market size is estimated at 24.7 billion USD in 2025, and is expected to reach 26.33 billion USD by 2030, growing at a CAGR of 1.29% during the forecast period (2025-2030).
Hiking production potential to mitigate increasing demand for leaner protein sources and reduce import dependency is driving market growth
- The United States produced 7.8 million tons of fish (including mollusks and crustaceans) in 2022, with a value of USD 9,065.5 million. About 17% of this value came from aquaculture and 83% from fisheries. An important factor at play here is that the United States is a net importer of fish and fish products. To promote local production, the government has shown its support through many policies and ventures. The major seafood type consumed in the United States is the other seafood segment, while the fastest-moving segment is shrimp, which is projected to record a CAGR of 2.3% during the forecast period.
- In the United States, regulators implemented season-length restrictions, total allowable catch limits, and gear and vessel power restrictions to combat overfishing. As a result, fishermen adopted new technologies and methods to work around these controls. The United States witnessed a price hike of 2.4 per kg in 2022 from 19.3 per kg in 2017. The production of seafood from local aquaculture in the country has also been increasing, with the average value of production per employee in aquaculture seeing an increase of 28% compared to the previous decade.
- The market is poised to record a CAGR of 5.46% during the forecast period. The seafood industry is a major contributor to the country's economy. The United States is a key player in global aquaculture and the world's top importer of fish and fishery products. It also provides other producers worldwide with a range of cutting-edge technology, feed, equipment, and investment capital. Most of the seafood consumed in the United States, between 70 and 85%, is imported, and aquaculture is used to generate over half of it. The seafood trade deficit reached USD 17 billion in 2020.
United States Seafood Market Trends
Overfishing, high cost of fuel, and labor shortages had a negative impact on the production of captured fish
- Based on value, bivalve mollusks, including oysters, clams, and mussels, make up more than 80% of marine aquaculture production in the United States in 2022. Fish is the largest sector of aquaculture in the United States, which accounted for 66% of the market in 2022, followed by crustaceans and mollusks. The most popular types of fish farmed internationally are salmon, shrimp, trout, and sea bass, but new developments in technology, aquaculture feeds, and management strategies are making other species available. By weight, marine aquaculture makes up 7% of all domestic seafood production. However, because of the emphasis on high-value items, aquaculture now accounts for 24% of the value of domestic seafood.
- Overfishing, high fuel costs, and labor shortages have negatively impacted the production of captured fish, with fish production decreasing by 15% in 2022. Additionally, illegal fishing by foreign nationals has also impacted fish output. However, the overall drop in the actual value of fisheries production has been tempered by growth in the real value of aquaculture.
- In order to support producers and encourage fish production in the country, government assistance has come into play to aid the market's growth and development over the years. By assisting them through laws and investments, the US government has demonstrated its determination to encourage local and independent seafood producers. For instance, in February 2022, the US Department of Agriculture (USDA) invested approximately USD 50 million in grants to support seafood processors, processing facilities, and processing vessels through the Seafood Processors Pandemic Response and Safety Block Grant Program (SBRS).
Disruption in supply chain increased the price fluctuations
- Fish prices in the country witnessed standard growth in the review period and registered an average growth of 30.6% from 2017 to 2022. It is estimated that demand will outpace supply moving forward. Fish prices followed an upward trend in recent years due to limitations on supply growth, particularly for capturing fisheries, and continued registering strong demand. For fish products sold with weight information, the prices increased by more than 2.2% in 2021 and another 5% in 2022. For products sold without weight information, the trend in prices and percentage change in price was similar, but with lower average prices and a wider range of growth rate values. However, in 2021, international fish prices were, on average, just 6-8% higher than the previous year. This was primarily due to price declines for many important farmed species, including shrimp, salmon, pangasius, catfish, tilapia, and canned tuna, as a consequence of supply outpacing demand.
- On the supply side, stable production of capture fisheries, slowing growth in aquaculture production, and increased costs for inputs such as feed, energy, and oil are expected to play a role in the segment. Due to strong global demand, the prices of fishmeal and fish oil are expected to increase by 30% and 13%, respectively, by 2030.
- In 2022, the United States was one of the largest fish-importing markets, following the European Union, and accounted for an import value of around 18%. Urbanization and expansion of the fish-consuming middle class have fueled demand and growth in the country. The US seafood imports destined for retail support the largest share of the total economic contributions, which was USD 26 billion in industry output (37.0%) and USD 15 billion in value-added (39.7%) in 2022.
United States Seafood Industry Overview
The United States Seafood Market is fragmented, with the top five companies occupying 17.64%. The major players in this market are Mowi ASA, NH Foods Ltd, Sysco Corporation, Thai Union Group PCL and The Kraft Heinz Company (sorted alphabetically).
Additional Benefits:
- The market estimate (ME) sheet in Excel format
- 3 months of analyst support
TABLE OF CONTENTS
1 EXECUTIVE SUMMARY & KEY FINDINGS
2 INTRODUCTION
- 2.1 Study Assumptions & Market Definition
- 2.2 Scope of the Study
- 2.3 Research Methodology
3 KEY INDUSTRY TRENDS
- 3.1 Price Trends
- 3.1.1 Fish
- 3.1.2 Shrimp
- 3.2 Production Trends
- 3.2.1 Fish
- 3.2.2 Shrimp
- 3.3 Regulatory Framework
- 3.3.1 United States
- 3.4 Value Chain & Distribution Channel Analysis
4 MARKET SEGMENTATION (includes market size in Value in USD, Forecasts up to 2030 and analysis of growth prospects)
- 4.1 Type
- 4.1.1 Fish
- 4.1.2 Shrimp
- 4.1.3 Other Seafood
- 4.2 Form
- 4.2.1 Canned
- 4.2.2 Fresh / Chilled
- 4.2.3 Frozen
- 4.2.4 Processed
- 4.3 Distribution Channel
- 4.3.1 Off-Trade
- 4.3.1.1 Convenience Stores
- 4.3.1.2 Online Channel
- 4.3.1.3 Supermarkets and Hypermarkets
- 4.3.1.4 Others
- 4.3.2 On-Trade
- 4.3.1 Off-Trade
5 COMPETITIVE LANDSCAPE
- 5.1 Key Strategic Moves
- 5.2 Market Share Analysis
- 5.3 Company Landscape
- 5.4 Company Profiles (includes Global level Overview, Market level overview, Core Business Segments, Financials, Headcount, Key Information, Market Rank, Market Share, Products and Services, and analysis of Recent Developments)
- 5.4.1 Admiralty Island Fisheries Inc.
- 5.4.2 Beaver Street Fisheries
- 5.4.3 High Liner Foods Inc.
- 5.4.4 Inland Seafood Inc.
- 5.4.5 Mowi ASA
- 5.4.6 NH Foods Ltd
- 5.4.7 Sysco Corporation
- 5.4.8 Thai Union Group PCL
- 5.4.9 The Kraft Heinz Company
- 5.4.10 Trident Seafood Corporation
6 KEY STRATEGIC QUESTIONS FOR SEAFOOD INDUSTRY CEOS
7 APPENDIX
- 7.1 Global Overview
- 7.1.1 Overview
- 7.1.2 Porter's Five Forces Framework
- 7.1.3 Global Value Chain Analysis
- 7.1.4 Market Dynamics (DROs)
- 7.2 Sources & References
- 7.3 List of Tables & Figures
- 7.4 Primary Insights
- 7.5 Data Pack
- 7.6 Glossary of Terms

