
|
市場調査レポート
商品コード
1692050
北米の水産物:市場シェア分析、産業動向、成長予測(2025年~2030年)North America Seafood - Market Share Analysis, Industry Trends & Statistics, Growth Forecasts (2025 - 2030) |
||||||
カスタマイズ可能
適宜更新あり
|
|||||||
| 北米の水産物:市場シェア分析、産業動向、成長予測(2025年~2030年) |
|
出版日: 2025年03月18日
発行: Mordor Intelligence
ページ情報: 英文 229 Pages
納期: 2~3営業日
|

全表示
- 概要
- 目次
概要
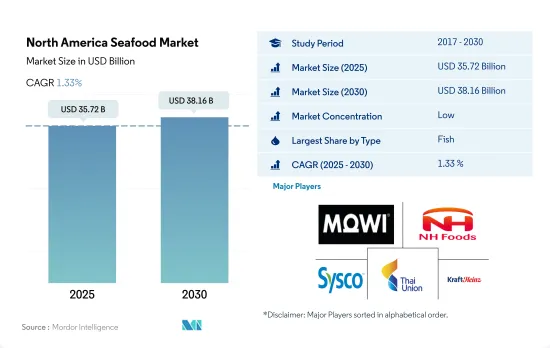
北米の水産物市場規模は2025年に357億2,000万米ドルと推定・予測され、2030年には381億6,000万米ドルに達し、予測期間中(2025年~2030年)のCAGRは1.33%で成長すると予測されています。
冷凍技術の向上が同地域の売上を押し上げる
- 北米の水産物市場全体の予測期間中のCAGRは0.77%と予測されます。米国では2021年現在、人々が水産物に対して180~200米ドル以上を費やしています。米国大統領は、水産業界の競争力を高めるため、2020年5月に米国の水産物を促進する大統領令に署名しました。また、米国で持続可能な方法で生産された水産物の拡大を促しています。競争力拡大のため、マリンハーベスト、スターキスト、日本水産などの大手企業は、市場の数々の製品イノベーションに注力しています。
- 北米では、エビが水産物市場で最も急成長しているセグメントであり、予測期間中のCAGR値は1.33%と予測されています。消費者のタンパク質摂取不足を解消するため、エビが栄養補助食品に広く利用されるようになり、エビ部門は牽引力を増しています。主なエビ生産ブランドは、シーパック、ワイルド・ガルフ・シュリンプ、サムズ・チョイスです。
- 米国では、乱獲に対抗するため、規制当局が漁期の制限、漁獲可能量の制限、漁具や漁船の出力制限を実施しました。その結果、漁業者はこれらの規制を回避するために新しい技術や方法を採用し、魚の価格は上昇しました。米国では2017年に1kgあたり19.3円だった価格が、2022年には2.4円になりました。インフラを改善し、貯蔵施設を凍結し、国内消費者に高品質の魚介類を確実に供給することは、効率的で収益性の高いサプライ・チェーンの重要な要素です。したがって、世界・シーフード・アライアンス、世界・サステナブル・シーフード・イニシアチブ、サステナブル・フィッシャリーズ・パートナーシップなど、持続可能な漁業を支援する組織の重要性も高まると思われます。
持続可能性は高度に実施・促進され、市場を大きく牽引する
- この地域の水産物市場は、調査期間中に安定した成長を観察しました。市場は2017年から2022年にかけて金額で27.37%成長しました。同地域では、「Eat Seafood America(シーフードを食べようアメリカ)」のような様々な啓発キャンペーンによって後押しされた、シーフード消費の健康効果への関心の高まりにより、消費が増加しています。同様に、NOAA(NATIONAL OCEANIC AND ATMOSPHERIC ADMINISTRATION)は、十分な情報に基づいた持続可能な水産物に関する意思決定を支援するため、科学的根拠に基づいたシンプルな情報を一般市民に提供しています。NOAAによるオンライン・プラットフォームFishWatchは、米国の水産物が、健全な環境を維持し、魚の個体数を確実に増やすための法律に従ってどのように集められているかについての情報を常に更新しています。
- 米国は北米水産物市場の主要シェアを占め、2021年から2022年にかけて金額ベースで前年比成長率2.16%を記録しました。同国の水産物オン・トレード販売は、外食産業の成長とメニューの水産物料理の増加に伴って伸びています。寿司、海老の天ぷら、蟹のラングーンは、米国で外食時に最も注文したい15品目のひとつです。
- カナダは予測期間中、CAGR値で1.68%と最も高い値を記録すると予測されており、これは主にエビの加工品が牽引しています。同市場では、持続可能な水産物や地元で生産された水産物など、ラベルに配慮した製品に対する需要が伸びています。メーカーや規制機関は、顧客が市場で水産物を購入する際、その魚種がその地域で収穫されたものであれば、持続可能な方法で漁獲または養殖されたものであることを保証するための措置を講じています。
北米の水産物市場の動向
需要の増加と技術の進歩が生産の伸びを支えている
- 米国は北米における主要な魚類生産国であり、メキシコがこれに続きます。この地域で最も多く生産されているのはサーモンです。しかし、技術、養殖飼料、管理技術の進歩により、利用できる魚種が増えています。海洋養殖は、国内水産物生産総重量の7%を占めています。しかし、高価値の製品に焦点を当てた結果、養殖業が成長し、国内水産物生産額の24%に貢献しています。
- カナダでは、1991年から2021年にかけて、生産額は2億3,400万米ドルから13億米ドルに、生産量は約5万トンから19万1,000トンに増加しました。業界の生産は主にヒレ科魚類が占めており、2021年には総量の78%、金額の91%を占める。ヒレ科魚類の生産量の大半は、数量、金額ともにサケです。2021年には、サケの生産だけで総量の63%、総額の74%を占める。ブリティッシュコロンビア州は依然として最大のサケ生産国で、2021年には総量の50%、総額の55%を占める。ブリティッシュコロンビア州に次いで、ニューブランズウィック州(数量で16%、金額で19%)、プリンス・エドワード・アイランド州(数量で13%、金額で4%)、ニューファンドランド・ラブラドール州(数量で10%、金額で11%)が続きます。
- メキシコには11,592kmの海岸線があり、その76%が太平洋岸、24%がメキシコ湾とカリブ海沿岸および島嶼部であるため、漁業分野では大きな可能性を秘めています。大陸棚の面積は約394,000km2で、メキシコ湾の方が広いです。また、12,500km2の沿岸のラグーンや河口、6,500km2の湖沼、ラグーン、貯水池、河川などの内水面があります。太平洋におけるマグロ漁業は重要で、年間約15万トンが漁獲されています。キハダはマグロ科の主要種です。
供給不足と経済不安がカナダとメキシコの価格に影響
- 2022年の同地域の平均魚価は前年比0.96%上昇しました。米国では水産物価格が最も高く、2022年には約2,443米ドル/トンを占める。魚介類の平均価格は調査期間中概ね上昇したが、パンデミック前の数年間は下落傾向を示しました。重量情報付きで販売された水産物の価格は、2021年に2.2%以上上昇し、2022年にはさらに5%上昇しました。重量情報なしで販売された製品については、価格動向と価格変動率は同様であったが、平均価格はより低く、伸び率の値の幅はより広くなりました。マグロとナマズは、2016年から2021年にかけて価格の伸びが最も大きくなりました。米国では、ナマズは価格が21%上昇し、約12.38米ドル/kgとなり、マグロは同期間に価格が18%上昇し、小売価格は13米ドル/kgとなりました。
- カナダでは、2017年から2022年にかけて魚の価格が14.63%上昇しました。乱獲と混獲により魚の供給が減少し、魚価が上昇しました。カナダは世界的に最も人気のある水産物を生産しており、魚の大半は輸出されています。カナダの魚価は、国際貿易による需要の増加による供給不足のために上昇しました。
- OECD-FAO農業アウトルックによると、平均名目魚価は2022年から2031年にかけて上昇し、2022年の高水準から始まるが、これはCOVIDによる2020年と2021年の価格下落から2022年の力強い価格回復を反映しています。2021年後半から2022年初頭にかけて、魚価は上昇に転じ、この地域の不安定な経済・地政学的情勢が消費に悪影響を及ぼします。
北米の水産物産業の概要
北米の水産物市場は断片化されており、上位5社で14.17%を占めています。この市場の主要企業は以下の通りです。 Mowi ASA, NH Foods Ltd, Sysco Corporation, Thai Union Group PCL and The Kraft Heinz Company(sorted alphabetically).
その他の特典
- エクセル形式の市場予測(ME)シート
- 3ヶ月のアナリストサポート
目次
第1章 エグゼクティブサマリーと主な調査結果
第2章 イントロダクション
- 調査の前提条件と市場定義
- 調査範囲
- 調査手法
第3章 主要産業動向
- 価格動向
- 魚
- エビ
- 生産動向
- 魚
- エビ
- 規制の枠組み
- カナダ
- メキシコ
- 米国
- バリューチェーンと流通チャネル分析
第4章 市場セグメンテーション
- タイプ
- 魚
- エビ
- その他のシーフード
- 形態
- 缶詰
- 生鮮・冷蔵
- 冷凍
- 加工
- 流通チャネル
- オフ・トレード
- コンビニエンスストア
- オンライン・チャネル
- スーパーマーケットとハイパーマーケット
- その他
- オン・トレード
- オフ・トレード
- 国名
- カナダ
- メキシコ
- 米国
- その他の北米
第5章 競争情勢
- 主要な戦略動向
- 市場シェア分析
- 企業情勢
- 企業プロファイル
- Beaver Street Fisheries
- Cooke Inc.
- Dulcich Inc.
- FCF Co. Ltd
- Gulf Shrimp Co. LLC
- High Liner Foods Inc.
- Mowi ASA
- NaturalShrimp Inc.
- NH Foods Ltd
- Pacific American Fish Company Inc.
- Sysco Corporation
- Thai Union Group PCL
- The Kraft Heinz Company
第6章 CEOへの主な戦略的質問
第7章 付録
- 世界概要
- 概要
- ファイブフォース分析フレームワーク
- 世界のバリューチェーン分析
- 市場力学(DROs)
- 情報源と参考文献
- 図表一覧
- 主要洞察
- データパック
- 用語集
目次
Product Code: 90346
The North America Seafood Market size is estimated at 35.72 billion USD in 2025, and is expected to reach 38.16 billion USD by 2030, growing at a CAGR of 1.33% during the forecast period (2025-2030).
Improving freezing technologies are boosting sales in the region
- The overall North American seafood market is expected to register a CAGR value of 0.77% during the forecast period. People spent over USD 180-200 on seafood in the United States as of 2021. The US President signed an executive order to promote American seafood in May 2020 to boost competitiveness in the seafood industry. It also urges the expansion of sustainably produced seafood in the United States. For competitive expansion, major corporations, including Marine Harvest, Starkist, and Nippon Suisan, are concentrating on the market's numerous product innovations.
- In North America, shrimp is the fastest-growing segment in the seafood market, with a projected CAGR value of 1.33% during the forecast period. The shrimp sector is gaining traction as shrimp are being widely used in dietary supplements to overcome the lack of protein intake among consumers. The major shrimp-producing brands are SeaPak, Wild Gulf Shrimp, and Sam's Choice.
- In the United States, regulators implemented season-length restrictions, total allowable catch limits, and gear and vessel power restrictions to combat overfishing. As a result, fishermen adopted new technologies and methods to work around these controls, and the prices of fish increased. The United States witnessed a price of 2.4 per kg in 2022 from 19.3 per kg in 2017. Improving infrastructure, freezing storage facilities, and ensuring the availability of high-quality fish commodities for domestic consumers are critical components of an efficient and profitable supply chain. Thus, there will also be growth in the importance of organizations that support sustainable fishing, such as the Global Seafood Alliance, the Global Sustainable Seafood Initiative, and the Sustainable Fisheries Partnership.
Sustainability is highly implemented and promoted, significantly driving the market
- The seafood market in the region observed a steady growth during the study period. The market grew by 27.37% in value from 2017 to 2022. The consumption is increasing in the region due to the growing interest in the health benefits of seafood consumption, which is boosted by various awareness campaigns such as 'Eat Seafood America.' Similarly, NOAA (NATIONAL OCEANIC AND ATMOSPHERIC ADMINISTRATION) offers the public with simple, scientifically based information to aid in making informed, sustainable seafood decisions. FishWatch, an online platform by NOAA, provides constantly updated information on how seafood in the United States is gathered in accordance with laws that maintain a healthy environment and ensure growing fish populations.
- The United States accounted for the major share of the North American seafood market and recorded a Y-o-Y growth rate of 2.16% by value from 2021 to 2022. The on-trade sales of seafood in the country are growing with the growing foodservice industry and the increasing number of seafood dishes on the menu. Sushi, shrimp tempura, and crab rangoon are among the 15 dishes that diners most want to order when eating away from home in the United States.
- Canada is projected to record the highest CAGR value of 1.68% during the forecast period, primarily driven by processed shrimp. The market has seen a growth in demand for label-friendly products like sustainable seafood and locally produced seafood. Manufacturers and regulatory agencies are taking steps to guarantee that when customers shop for seafood at the market, they may be confident that it has been sustainably fished or farmed if the species is harvested in the region.
North America Seafood Market Trends
Rising demand and advancements in technologies are helping production growth
- The US is the leading fish producer in North America, followed by Mexico. Salmon is the most produced in the region. However, advances in technology, aquaculture feeds, and management techniques are making more species available. Marine aquaculture accounts for 7% of total domestic seafood production by weight. However, the focus on high-value products has resulted in growth in aquaculture, contributing 24% of the value of domestic seafood products.
- In Canada, the production value grew from USD 234 million to USD 1.3 billion, while the production volume grew from roughly 50,000 tons to 191,000 tons from 1991 to 2021. Industry production is primarily represented by finfish, which accounted for 78% of total volume and 91% by value in 2021. The majority of finfish production, by both volume and value, is salmon. In 2021, salmon production alone accounted for 63% of the total volume and 74% of total value. British Columbia remains the largest producer of salmon, accounting for 50% of total volume and 55% of total value in 2021. British Columbia is followed by New Brunswick (16% of volume and 19% of value), Prince-Edward-Island (13% of volume and 4% of value), and Newfoundland and Labrador (10% of volume and 11% of value).
- Mexico has enormous potential in the fisheries sector, as it has 11,592 km of coastline, of which 76% is on the Pacific coast, and 24% is in the Gulf of Mexico and the Caribbean coast and islands. Its continental shelf is approximately 394 000 km2, being larger in the Gulf of Mexico. It also has 12 500 km2 of coastal lagoons and estuaries and 6 500 km2 of inland waters such as lakes, lagoons, reservoirs, and rivers. The tuna fisheries in the Pacific are significant, with around 150,000 tons per year. Yellowfin is the main species in the tuna family.
Supply shortage and economic instability are impacting the prices in Canada and Mexico
- The average fish prices in the region grew by 0.96% in 2022 compared to the previous year. In the United States, the price of seafood was the highest, accounting for around USD 2443/ton in 2022. Average seafood prices generally increased over the study period; however, the rate showed a decreasing trend in the years before the pandemic. For fish products sold with weight information, prices increased by more than 2.2% in 2021 and another 5% in 2022. For products sold without weight information, the trend in prices and percentage changes in price was similar, but with lower average prices and a wider range of growth rate values. Tuna and catfish saw the highest growth in price from 2016 to 2021. In the United States, catfish saw a growth of 21% in prices, costing around USD 12.38/kg, while tuna experienced 18% price growth in the same period with a retail price of USD 13/kg.
- In Canada, fish prices increased by 14.63% from 2017 to 2022. Due to overfishing and bycatch, the supply of fish fell, and fish prices increased. Canada produces some of the most popular seafood globally, and a majority of fish is exported. Fish prices in Canada increased due to supply shortages due to the increasing demand from international trade.
- According to the OECD-FAO Agricultural Outlook, average nominal fish prices will increase over 2022-2031, starting from a high level in 2022, reflecting a strong price recovery in 2022 from COVID-driven declines in 2020 and 2021. In late 2021 and early 2022, fish prices started to increase, with a negative impact on consumption due to an unstable economic and geopolitical situation in the region.
North America Seafood Industry Overview
The North America Seafood Market is fragmented, with the top five companies occupying 14.17%. The major players in this market are Mowi ASA, NH Foods Ltd, Sysco Corporation, Thai Union Group PCL and The Kraft Heinz Company (sorted alphabetically).
Additional Benefits:
- The market estimate (ME) sheet in Excel format
- 3 months of analyst support
TABLE OF CONTENTS
1 EXECUTIVE SUMMARY & KEY FINDINGS
2 INTRODUCTION
- 2.1 Study Assumptions & Market Definition
- 2.2 Scope of the Study
- 2.3 Research Methodology
3 KEY INDUSTRY TRENDS
- 3.1 Price Trends
- 3.1.1 Fish
- 3.1.2 Shrimp
- 3.2 Production Trends
- 3.2.1 Fish
- 3.2.2 Shrimp
- 3.3 Regulatory Framework
- 3.3.1 Canada
- 3.3.2 Mexico
- 3.3.3 United States
- 3.4 Value Chain & Distribution Channel Analysis
4 MARKET SEGMENTATION (includes market size in Value in USD, Forecasts up to 2030 and analysis of growth prospects)
- 4.1 Type
- 4.1.1 Fish
- 4.1.2 Shrimp
- 4.1.3 Other Seafood
- 4.2 Form
- 4.2.1 Canned
- 4.2.2 Fresh / Chilled
- 4.2.3 Frozen
- 4.2.4 Processed
- 4.3 Distribution Channel
- 4.3.1 Off-Trade
- 4.3.1.1 Convenience Stores
- 4.3.1.2 Online Channel
- 4.3.1.3 Supermarkets and Hypermarkets
- 4.3.1.4 Others
- 4.3.2 On-Trade
- 4.3.1 Off-Trade
- 4.4 Country
- 4.4.1 Canada
- 4.4.2 Mexico
- 4.4.3 United States
- 4.4.4 Rest of North America
5 COMPETITIVE LANDSCAPE
- 5.1 Key Strategic Moves
- 5.2 Market Share Analysis
- 5.3 Company Landscape
- 5.4 Company Profiles (includes Global level Overview, Market level overview, Core Business Segments, Financials, Headcount, Key Information, Market Rank, Market Share, Products and Services, and analysis of Recent Developments)
- 5.4.1 Beaver Street Fisheries
- 5.4.2 Cooke Inc.
- 5.4.3 Dulcich Inc.
- 5.4.4 FCF Co. Ltd
- 5.4.5 Gulf Shrimp Co. LLC
- 5.4.6 High Liner Foods Inc.
- 5.4.7 Mowi ASA
- 5.4.8 NaturalShrimp Inc.
- 5.4.9 NH Foods Ltd
- 5.4.10 Pacific American Fish Company Inc.
- 5.4.11 Sysco Corporation
- 5.4.12 Thai Union Group PCL
- 5.4.13 The Kraft Heinz Company
6 KEY STRATEGIC QUESTIONS FOR SEAFOOD INDUSTRY CEOS
7 APPENDIX
- 7.1 Global Overview
- 7.1.1 Overview
- 7.1.2 Porter's Five Forces Framework
- 7.1.3 Global Value Chain Analysis
- 7.1.4 Market Dynamics (DROs)
- 7.2 Sources & References
- 7.3 List of Tables & Figures
- 7.4 Primary Insights
- 7.5 Data Pack
- 7.6 Glossary of Terms

