
|
市場調査レポート
商品コード
1721473
拡張現実パッケージ市場の市場機会、成長促進要因、産業動向分析、2025年~2034年予測Augmented Reality Packaging Market Opportunity, Growth Drivers, Industry Trend Analysis, and Forecast 2025 - 2034 |
||||||
カスタマイズ可能
|
|||||||
| 拡張現実パッケージ市場の市場機会、成長促進要因、産業動向分析、2025年~2034年予測 |
|
出版日: 2025年04月09日
発行: Global Market Insights Inc.
ページ情報: 英文 170 Pages
納期: 2~3営業日
|

全表示
- 概要
- 目次
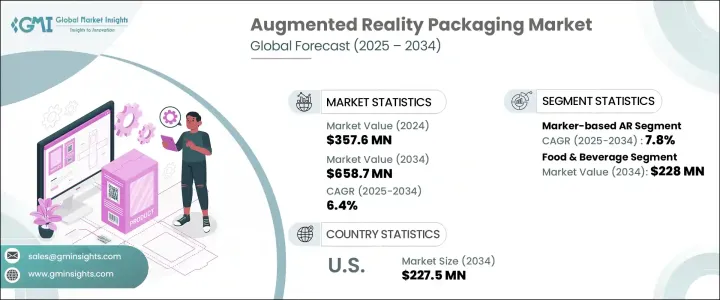
世界の拡張現実パッケージ市場は、2024年に3億5,760万米ドルと評価され、CAGR 6.4%で成長し、2034年には6億5,870万米ドルに達すると予測されています。
消費者行動の急速な進化、パーソナライズされた体験への期待の高まり、デジタル経済の着実な拡大は、パッケージング業界を再構築しています。各分野のブランドは、従来のパッケージング方法から、顧客エンゲージメントを高めるスマートでインタラクティブな代替方法への移行をますます進めています。AR技術を製品パッケージに直接組み込むことで、企業は没入型のストーリーテリング、製品デモ、詳細な洞察をリアルタイムで提供し、消費者に販売時点で記憶に残る有益な体験を与えています。この動向は、特に小売やeコマースの分野でパラダイムシフトを生み出しており、ARはコンバージョン、ブランドロイヤルティ、購入後の満足度を高めるために不可欠なツールになりつつあります。市場の勢いは、スマートフォンの普及率の上昇と、商品理解を深めるデジタル・オーバーレイとのインタラクションに対する消費者の準備態勢によってさらに加速しています。差別化が鍵となる状況において、ARパッケージングは物理的な製品とデジタル体験の貴重な架け橋となっています。
オンライン小売業者が商品の不確実性と返品率を低減する新しい方法を模索しているため、パッケージングへのARの統合の増加はeコマースブームと密接に関連しています。ARパッケージングにより、消費者は購入を決定する前に、実際の環境で製品を視覚化することができます。この能力は、購入者の信頼感を向上させるだけでなく、ブランド認知の向上や購入後の不協和の軽減にも貢献します。企業がチャネルを横断してシームレスで有益なショッピング体験を提供しようと努力する中、AR強化パッケージングはデジタルと実店舗の両方の小売環境で支持を集め続けています。
| 市場範囲 | |
|---|---|
| 開始年 | 2024 |
| 予測年 | 2025-2034 |
| 開始金額 | 3億5,760万米ドル |
| 予測金額 | 6億5,870万米ドル |
| CAGR | 6.4% |
同市場は、技術別に機械学習、マーカーベースAR、マーカーレスAR、GPS/位置情報ベースAR、その他に区分されます。このうち、マーカーベースARが最も急成長しており、予測期間中のCAGRは7.8%と予想されます。企業がこの技術を好む理由は、そのシンプルさ、コスト効率、一貫したユーザーインタラクションにあります。マーカーベースのARは、パッケージ上の事前定義された画像やQRコードを活用してインタラクティブなコンテンツをトリガーするため、ブランドはマーケティング目標に沿ってユーザー体験をカスタマイズしやすくなります。このテクノロジー先進の戦略は、顧客エンゲージメントとブランドストーリーテリングを高める上で非常に効果的であることが証明されています。
最終用途産業では、飲食品分野が際立っており、2034年までに2億2,800万米ドルに達すると予測されています。成分、調達先、栄養価に関する透明性への要求が、メーカーに、簡単なパッケージのスキャンを通じて関連情報を消費者に直接提供するAR機能の組み込みを促しています。
米国の拡張現実パッケージ市場だけでも、2034年までに2億2,750万米ドルに達すると予測されています。ブランドは、従来のパッケージを、進化する消費者の嗜好に応えるインタラクティブなデジタル・タッチポイントに変えつつあります。
世界市場の主要企業には、BrandXR、SmartTek Solutions.LLC、Zappar(Infinite Reality)、FlippAR、Jasorenなどがあります。これらの企業は、AR能力の拡大、研究開発への投資、戦略的パートナーシップの形成により、パッケージングを通じて次世代ARソリューションの実現を目指し、革新を続けています。
目次
第1章 調査手法と範囲
第2章 エグゼクティブサマリー
第3章 業界考察
- エコシステム分析
- 業界への影響要因
- 促進要因
- スマートでデジタルなパッケージングソリューションに対する需要の高まり
- リアルタイムのパッケージ最適化のためのIoTおよびセンサー技術の採用増加
- 包装におけるサプライチェーンの透明性とトレーサビリティの向上に対するニーズの高まり
- 消費者体験の向上に重点を置く
- 拡大するeコマース部門がスマートで適応性のあるパッケージングの必要性を促進
- 業界の潜在的リスク&課題
- 初期投資と運用コストが高め
- 採用率の低下
- 促進要因
- 成長可能性分析
- 規制情勢
- テクノロジーの情勢
- 将来の市場動向
- ギャップ分析
- ポーターの分析
- PESTEL分析
第4章 競合情勢
- イントロダクション
- 企業の市場シェア分析
- 主要市場企業の競合分析
- 競合ポジショニングマトリックス
- 戦略ダッシュボード
第5章 市場推計・予測:技術別、2021 –2034
- 主要動向
- マーカーベースのAR
- マーカーレスAR
- GPS/位置情報ベースのAR
- その他
第6章 市場推計・予測:最終用途産業別、2021 –2034
- 主要動向
- 食品・飲料
- 医薬品・ヘルスケア
- 小売・消費財
- 化粧品・パーソナルケア
- 自動車
- 工業製品
- その他
第7章 市場推計・予測:地域別、2021 –2034
- 主要動向
- 北米
- 米国
- カナダ
- 欧州
- ドイツ
- 英国
- フランス
- スペイン
- イタリア
- オランダ
- アジア太平洋地域
- 中国
- インド
- オーストラリア
- 韓国
- 日本
- ラテンアメリカ
- ブラジル
- メキシコ
- 中東・アフリカ
- サウジアラビア
- アラブ首長国連邦
- 南アフリカ
第8章 企業プロファイル
- Arloopa Studio
- BrandXR
- FlippAR
- Ink In Caps
- Jasoren
- PlugXR
- Proven Solution
- SmartTek Solutions.LLC
- THIMM Group GmbH+Co. KG
- Travancore Analytics
- Vossle
- WE/AR Studio
- Zappar(Infinite Reality)
The Global Augmented Reality Packaging Market was valued at USD 357.6 million in 2024 and is estimated to grow at a CAGR of 6.4% to reach USD 658.7 million by 2034. The rapid evolution of consumer behavior, growing expectations for personalized experiences, and the steady expansion of the digital economy are reshaping the packaging industry. Brands across sectors are increasingly shifting from conventional packaging methods to smart, interactive alternatives that elevate customer engagement. With AR technology integrated directly into product packaging, businesses are offering immersive storytelling, product demos, and detailed insights in real time-giving consumers a memorable and informative experience at the point of sale. This trend is creating a paradigm shift, especially in the retail and e-commerce spaces, where AR is becoming an essential tool for driving conversion, brand loyalty, and post-purchase satisfaction. The market's momentum is further fueled by rising smartphone penetration and the readiness of consumers to interact with digital overlays that enhance product understanding. In a landscape where differentiation is key, AR packaging serves as a valuable bridge between physical products and digital experiences.
The increasing integration of AR into packaging is tightly linked to the e-commerce boom, as online retailers seek new ways to reduce product uncertainty and return rates. AR packaging enables consumers to visualize products in their real-life environment before making a purchase decision. This ability not only improves buyer confidence but also contributes to improved brand perception and reduced post-purchase dissonance. As businesses strive to deliver a seamless and informative shopping experience across channels, AR-enhanced packaging continues to gain traction in both digital and brick-and-mortar retail environments.
| Market Scope | |
|---|---|
| Start Year | 2024 |
| Forecast Year | 2025-2034 |
| Start Value | $357.6 Million |
| Forecast Value | $658.7 Million |
| CAGR | 6.4% |
The market is segmented based on technology into machine learning, marker-based AR, markerless AR, GPS/location-based AR, and others. Among these, marker-based AR is witnessing the fastest growth, with an expected CAGR of 7.8% during the forecast period. Companies prefer this technology for its simplicity, cost-efficiency, and consistent user interactions. Marker-based AR leverages predefined images or QR codes on packaging to trigger interactive content, making it easier for brands to customize user experiences in line with marketing goals. This tech-forward strategy is proving highly effective in boosting customer engagement and brand storytelling.
In terms of end-use industries, the food and beverage segment stands out and is anticipated to reach USD 228 million by 2034. The demand for transparency regarding ingredients, sourcing, and nutritional value is prompting manufacturers to incorporate AR features that deliver relevant information directly to consumers through simple packaging scans.
The U.S. Augmented Reality Packaging Market alone is projected to hit USD 227.5 million by 2034, driven by the appetite for immersive, data-rich shopping experiences. Brands are transforming traditional packaging into interactive digital touchpoints that cater to evolving consumer preferences.
Key players in the global market include BrandXR, SmartTek Solutions.LLC, Zappar (Infinite Reality), FlippAR, and Jasoren. These companies continue to innovate by expanding their AR capabilities, investing in R&D, and forming strategic partnerships that bring next-gen AR solutions to life through packaging.
Table of Contents
Chapter 1 Methodology and Scope
- 1.1 Market scope and definitions
- 1.2 Research design
- 1.2.1 Research approach
- 1.2.2 Data collection methods
- 1.3 Base estimates and calculations
- 1.3.1 Base year calculation
- 1.3.2 Key trends for market estimation
- 1.4 Forecast model
- 1.5 Primary research and validation
- 1.5.1 Primary sources
- 1.5.2 Data mining sources
Chapter 2 Executive Summary
- 2.1 Industry 3600 synopsis
Chapter 3 Industry Insights
- 3.1 Industry ecosystem analysis
- 3.2 Industry impact forces
- 3.2.1 Growth drivers
- 3.2.1.1 Rising demand for smart and digital packaging solution
- 3.2.1.2 Increasing adoption of IoT and sensor technologies for real-time packaging optimization
- 3.2.1.3 Rising need for improved supply chain transparency and traceability in packaging
- 3.2.1.4 Increasing focus on enhancing consumer experience
- 3.2.1.5 Expanding e-commerce sector fuelling the need for smart, adaptive packaging
- 3.2.2 Industry pitfalls and challenges
- 3.2.2.1 High initial investment and operational costs
- 3.2.2.2 Slower adoption rate
- 3.2.1 Growth drivers
- 3.3 Growth potential analysis
- 3.4 Regulatory landscape
- 3.5 Technology landscape
- 3.6 Future market trends
- 3.7 Gap analysis
- 3.8 Porter’s analysis
- 3.9 PESTEL analysis
Chapter 4 Competitive Landscape, 2024
- 4.1 Introduction
- 4.2 Company market share analysis
- 4.3 Competitive analysis of major market players
- 4.4 Competitive positioning matrix
- 4.5 Strategy dashboard
Chapter 5 Market Estimates and Forecast, By Technology, 2021 – 2034 ($ Mn)
- 5.1 Key trends
- 5.2 Marker-Based AR
- 5.3 Markerless AR
- 5.4 GPS/Location-Based AR
- 5.5 Others
Chapter 6 Market Estimates and Forecast, By End Use Industry, 2021 – 2034 ($ Mn)
- 6.1 Key trends
- 6.2 Food & Beverage
- 6.3 Pharmaceuticals & Healthcare
- 6.4 Retail & Consumer Goods
- 6.5 Cosmetics & Personal Care
- 6.6 Automotive
- 6.7 Industrial goods
- 6.8 Others
Chapter 7 Market Estimates and Forecast, By Region, 2021 – 2034 ($ Mn)
- 7.1 Key trends
- 7.2 North America
- 7.2.1 U.S.
- 7.2.2 Canada
- 7.3 Europe
- 7.3.1 Germany
- 7.3.2 UK
- 7.3.3 France
- 7.3.4 Spain
- 7.3.5 Italy
- 7.3.6 Netherlands
- 7.4 Asia Pacific
- 7.4.1 China
- 7.4.2 India
- 7.4.3 Australia
- 7.4.4 South Korea
- 7.4.5 Japan
- 7.5 Latin America
- 7.5.1 Brazil
- 7.5.2 Mexico
- 7.6 Middle East and Africa
- 7.6.1 Saudi Arabia
- 7.6.2 U.A.E.
- 7.6.3 South Africa
Chapter 8 Company Profiles
- 8.1 Arloopa Studio
- 8.2 BrandXR
- 8.3 FlippAR
- 8.4 Ink In Caps
- 8.5 Jasoren
- 8.6 PlugXR
- 8.7 Proven Solution
- 8.8 SmartTek Solutions.LLC
- 8.9 THIMM Group GmbH + Co. KG
- 8.10 Travancore Analytics
- 8.11 Vossle
- 8.12 WE/AR Studio
- 8.13 Zappar (Infinite Reality)

