|
|
市場調査レポート
商品コード
1708041
食品サービス向け包装の世界市場:業界分析、規模、シェア、成長、動向、予測(2025年~2032年)Foodservice Packaging Market: Global Industry Analysis, Size, Share, Growth, Trends, and Forecast, 2025 - 2032 |
||||||

|
|||||||
カスタマイズ可能
|
|||||||

| 食品サービス向け包装の世界市場:業界分析、規模、シェア、成長、動向、予測(2025年~2032年) |
|
出版日: 2025年04月17日
発行: Persistence Market Research
ページ情報: 英文 201 Pages
納期: 2~5営業日
|

全表示
- 概要
- 目次
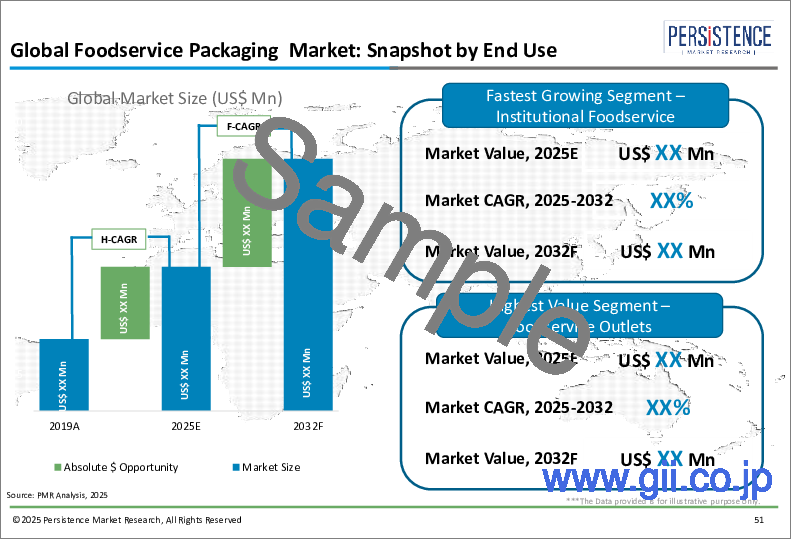
世界の食品サービス向け包装の市場規模は、2025年に3,663億米ドルになるとみられ、2025年~2032年の予測期間に5.2%のCAGRで拡大し、2032年には5,224億米ドルに達すると予測されています。
食品サービス向け包装には、レストラン、テイクアウト店、カフェテリア、その他の外食産業で提供される食品や飲料の包装に使用される材料や容器が含まれます。これには、紙、プラスチック、アルミニウム、生分解性材料で作られたカップ、容器、トレイ、ラップ、カトラリーなどのアイテムが含まれます。食品サービス向け包装市場は、食品の品質保持、衛生確保、利便性の向上、ブランドイメージの支持において重要な役割を果たしています。市場の拡大には、すぐに食べられる食事、テイクアウト、デリバリーサービスに対する需要の増加と、持続可能で環境に優しいパッケージングソリューションを重視する消費者の増加が寄与しています。当レポートでは、パッケージデザイン、素材の持続可能性、顧客エンゲージメント強化のためのスマートラベルやQRコードなどのデジタル統合におけるイノベーションを取り上げます。
世界の食品サービス向け包装市場は、都市化、多忙なライフスタイル、オンライン食品プラットフォームの拡大などを背景とした食品宅配およびテイクアウト分野の急成長など、いくつかの要因によって推進されています。便利な外出先での消費に対する需要の高まりにより、耐久性があり、こぼれにくく、持ち運び可能な包装形態の採用が加速しています。さらに、持続可能な実践の推進により、リサイクル可能、堆肥化可能、生分解性材料から作られた環境に優しいパッケージングソリューションが急増しています。外食事業者はまた、顧客体験とブランド認知度を高めるために、カスタマイズされたブランド包装に投資しています。さらに、COVID-19の大流行後の衛生上の懸念により、業界全体で安全で改ざんが確認できる包装オプションのニーズが高まっています。
旺盛な需要にもかかわらず、食品サービス向け包装市場は原材料コストの変動や使い捨てプラスチックに対する規制の強化といった課題に直面しています。変化する環境規制への対応には、継続的な技術革新と適応が必要であり、メーカーにとっては運用コストが増加する可能性があります。さらに、生分解性素材や持続可能な素材を堆肥化したりリサイクルしたりするためのインフラは、いくつかの地域ではまだ限られており、環境に優しい取り組みの効果を低下させています。手頃な価格と環境への影響のトレードオフは、特に持続可能性の目標を妥協することなくコスト効率の高いパッケージングソリューションを求める中小規模の外食業者にとって、重要な課題となっています。
食品サービス向け包装市場は、材料科学とデジタル技術の革新を通じて有望な機会を提示します。成型パルプやバガスなどの植物ベースおよび繊維ベースの材料の開発は、持続可能なパッケージングに新たな道を開きます。温度インジケーターやRFID対応タグを含むスマート包装技術は、食品の安全性とトレーサビリティを強化します。先進国市場と新興国市場の両方におけるクイックサービスレストラン(QSR)、ゴーストキッチン、ミールキット宅配サービスの市場開拓は、テーラーメイドのパッケージング・ソリューションのためのより広範なプラットフォームを提供します。革新的で持続可能な機能的包装を共同開発するための包装メーカーと食品サービスブランドとの戦略的パートナーシップは、将来の成長を獲得するための鍵となるとみられています。
当レポートでは、世界の食品サービス向け包装市場について調査し、製品タイプ別、材質別、製造プロセス別、最終用途別、地域別動向、および市場に参入する企業のプロファイルなどを提供しています。
目次
第1章 エグゼクティブサマリー
第2章 市場概要
第3章 主要な市場動向
- 市場に影響を与える主要な動向
- 製品イノベーションの動向
- 食品包装業界の将来見通し
第4章 世界の食品サービス向け包装市場の見通し、2019年~2032年
- 過去の市場規模(1,000個)分析、2019年~2024年
- 現在および将来の市場規模(1,000個)予測、2025年~2032年
- 前年比成長動向分析
第5章 世界の食品サービス向け包装市場- 価格分析
第6章 世界の食品サービス向け包装市場の見通し、2019年~2032年
- 過去の市場規模(10億米ドル)分析、2019年~2024年
- 現在および将来の市場規模(10億米ドル)予測、2025年~2032年
第7章 市場背景
第8章 世界の食品サービス向け包装市場の見通し、2019年~2032年、製品タイプ別
- イントロダクション/主な調査結果
- 過去の市場規模(10億米ドル)分析、製品タイプ別、2019年~2024年
- 現在および将来の市場規模(10億米ドル)分析と予測、製品タイプ別、2025年~2032年
- プレート
- トレイ
- カップ
- ボウル
- ピザボックス
- ストロー
- 1人前パック
- クラムシェル
- カップの蓋
- スターラー
- カトラリー(ナイフ、フォーク、スプーン)
- 市場の魅力分析、製品タイプ別
第9章 世界の食品サービス向け包装市場の見通し、2019年~2032年、材質別
- イントロダクション/主な調査結果
- 過去の市場規模(10億米ドル)分析、材質別、2019年~2024年
- 現在および将来の市場規模(10億米ドル)分析と予測、材質別、2025年~2032年
- アルミニウム
- 板紙
- 成形繊維
- プラスチック
- ポリスチレン
- ポリプロピレン
- ポリエチレン
- ポリエチレンテレフタレート
- ポリ乳酸
- 木材
- 市場の魅力分析、材質別
第10章 世界の食品サービス向け包装市場の見通し、2019年~2032年、製造プロセス別
- イントロダクション/主な調査結果
- 過去の市場規模(10億米ドル)分析、製造プロセス別、2019年~2024年
- 現在および将来の市場規模(10億米ドル)分析と予測、製造プロセス別、2025年~2032年
- 熱成形
- ダイカット
- 射出成形
- 市場の魅力分析、製造プロセス別
第11章 世界の食品サービス向け包装市場の見通し、2019年~2032年、最終用途別
- イントロダクション/主な調査結果
- 過去の市場規模(10億米ドル)分析、最終用途別、2019年~2024年
- 現在および将来の市場規模(10億米ドル)分析と予測、最終用途別、2025年~2032年
- フードサービス店
- 施設内フードサービス
- オンライン食品オーダー
- 市場の魅力分析、最終用途別
第12章 世界の食品サービス向け包装市場の見通し、2019年~2032年、地域別
- イントロダクション
- 過去の市場規模(10億米ドル)と数量分析、地域別、2019年~2024年
- 現在および将来の市場規模(10億米ドル)と数量分析および予測、地域別、2025年~2032年
- 北米
- ラテンアメリカ
- 欧州
- 東アジア
- 南アジア
- オセアニア
- 中東・アフリカ
- 市場の魅力分析、地域別
第13章 北米の食品サービス向け包装市場の見通し、2019年~2032年
第14章 ラテンアメリカの食品サービス向け包装市場の見通し、2019年~2032年
第15章 欧州の食品サービス向け包装市場の見通し、2019年~2032年
第16章 南アジアの食品サービス向け包装市場の見通し、2019年~2032年
第17章 東アジアの食品サービス向け包装市場の見通し、2019年~2032年
第18章 オセアニアの食品サービス向け包装市場の見通し、2019年~2032年
第19章 中東・アフリカの食品サービス向け包装市場の見通し、2019年~2032年
第20章 主要国の食品サービス向け包装市場分析、2025年~2032年
- イントロダクション
- 米国
- カナダ
- メキシコ
- ブラジル
- ドイツ
- イタリア
- 英国
- 中国
- 日本
- 韓国
- インド
- オーストラリアとニュージーランド
- 南アフリカ
第21章 市場構造分析
第22章 競合分析
- 競合ダッシュボード
- 競合別価格分析
- 競合ベンチマーク
- 競合の詳細
- Dart Container Corporation
- Georgia-Pacific LLC
- Anchor Packaging Inc.
- Pactiv LLC
- D&W Fine Pack
- Gold Plast SPA
- Berry Global Group Inc.
- DOpla SpA
- Smurfit Kappa Group
- WestRock Company
- Huhtamaki Oyj
- New WinCup Holdings, Inc.
- Linpac Packaging Ltd
- Graphic Packaging Holding Company
第23章 前提と使用される頭字語
第24章 調査手法
Persistence Market Research has recently released a comprehensive report on the worldwide market for foodservice packaging. The report offers a thorough assessment of crucial market dynamics, including drivers, trends, opportunities, and challenges, providing detailed insights into the market structure. This research publication presents exclusive data and statistics outlining the anticipated growth trajectory of the global foodservice packaging market from 2025 to 2032.
Key Insights:
- Foodservice Packaging Market Size (2025E): USD 366.3 Billion
- Projected Market Value (2032F): USD 522.4 Billion
- Global Market Growth Rate (CAGR 2025 to 2032): 5.2%
Foodservice Packaging Market - Report Scope:
Foodservice packaging encompasses materials and containers used for the packaging of food and beverages served by restaurants, takeout outlets, cafeterias, and other foodservice providers. This includes items such as cups, containers, trays, wraps, and cutlery made from paper, plastic, aluminum, and biodegradable materials. The foodservice packaging market plays a vital role in preserving food quality, ensuring hygiene, enhancing convenience, and supporting brand image. Market expansion is fueled by the growing demand for ready-to-eat meals, takeout, and delivery services, along with increasing consumer emphasis on sustainable and eco-friendly packaging solutions. The report covers innovations in packaging design, material sustainability, and digital integration such as smart labels and QR codes for enhanced customer engagement.
Market Growth Drivers:
The global foodservice packaging market is propelled by several factors, including the rapid growth of the food delivery and takeout sectors, driven by urbanization, busy lifestyles, and the expansion of online food platforms. The increasing demand for convenient, on-the-go consumption has led to heightened adoption of durable, spill-resistant, and portable packaging formats. Furthermore, the push for sustainable practices has resulted in a surge of eco-friendly packaging solutions made from recyclable, compostable, and biodegradable materials. Foodservice operators are also investing in customized and branded packaging to enhance customer experience and brand visibility. Additionally, health and hygiene concerns following the COVID-19 pandemic have increased the need for secure, tamper-evident packaging options across the industry.
Market Restraints:
Despite strong demand, the foodservice packaging market faces challenges such as fluctuating raw material costs and growing regulatory scrutiny over single-use plastics. Compliance with changing environmental regulations requires continuous innovation and adaptation, which may increase operational costs for manufacturers. In addition, the infrastructure for composting and recycling biodegradable or sustainable materials remains limited in several regions, reducing the effectiveness of eco-friendly initiatives. The trade-off between affordability and environmental impact presents a key challenge, particularly for small and medium-sized foodservice providers seeking cost-effective packaging solutions without compromising sustainability goals.
Market Opportunities:
The foodservice packaging market presents promising opportunities through innovations in material science and digital technologies. The development of plant-based and fiber-based materials, such as molded pulp and bagasse, opens new avenues for sustainable packaging. Smart packaging technologies, including temperature indicators and RFID-enabled tags, enhance food safety and traceability. Growth in quick-service restaurants (QSRs), ghost kitchens, and meal kit delivery services in both developed and emerging markets provides a broader platform for tailored packaging solutions. Strategic partnerships between packaging manufacturers and foodservice brands to co-develop innovative, sustainable, and functional packaging will be key to capturing future growth.
Key Questions Answered in the Report:
- What are the major factors driving the global foodservice packaging market growth?
- Which material types and packaging formats are gaining popularity in the foodservice sector?
- How are environmental regulations and consumer expectations shaping market innovation?
- Who are the leading companies in the foodservice packaging market, and what strategies are they using to remain competitive?
- What are the future prospects and emerging trends in the global foodservice packaging industry?
Competitive Intelligence and Business Strategy:
Leading players in the global foodservice packaging market, including Amcor plc, Huhtamaki Oyj, WestRock Company, and Berry Global Inc., focus on developing sustainable packaging solutions, expanding their global footprint, and enhancing supply chain resilience. These companies invest heavily in R&D to introduce compostable, recyclable, and lightweight packaging options that meet evolving environmental standards. Collaborations with foodservice brands and online food aggregators enable co-branded packaging and ensure consistent product supply. Players are also adopting digital tools for tracking and inventory management, optimizing delivery efficiency. Marketing strategies emphasize eco-conscious branding, customer convenience, and regulatory compliance to strengthen market presence.
Key Companies Profiled:
- Dart Container Corporation
- Georgia-Pacific LLC
- Anchor Packaging Inc.
- Pactiv LLC
- D&W Fine Pack
- Gold Plast SPA
- Berry Global Group Inc.
- DOpla S.p.A.
- Smurfit Kappa Group
- WestRock Company
- Huhtamaki Oyj
- New WinCup Holdings, Inc.
- Linpac Packaging Ltd
- Graphic Packaging Holding Company
- Other Players (As Requested)
Key Segments Covered in Foodservice Packaging Industry Research
By Product Type
- Plates
- Trays
- Cups
- Bowls
- Pizza Boxes
- Straws
- Single serve Portion Packs
- Clamshell
- Lids for Cups
- Stirrers
- Cutlery (Knives, Forks, Spoons)
By Material
- Aluminium
- Paperboard
- Moulded Fibres
- Plastic
- Polystyrene
- Polypropylene
- Polyethylene
- Polyethylene Terephthalate
- Poly Lactic Acid
- Wood
By Fabrication Process
- Thermoforming
- Die Cutting
- Injection Moulding
By End Use
- Foodservice Outlets
- Institutional Foodservice
- Online Food Ordering
By Region
- North America
- Latin America
- Europe
- East Asia
- South Asia
- Oceania
- Middle East Africa
Table of Contents
1. Executive Summary
- 1.1. Global Market Overview
- 1.2. Summary of Key Statistics
- 1.3. Summary of Key Findings
- 1.4. Product Evolution Analysis
- 1.5. PMR Analysis and Recommendations
2. Market Overview
- 2.1. Market Coverage/Taxonomy
- 2.2. Market Definition/Scope/Limitations
3. Key Market Trends
- 3.1. Key Trends Impacting the Market
- 3.1.1. Innovations and Portfolio Extensions Leading to Product Premiumization
- 3.1.2. Cost-effectiveness of food service packaging
- 3.1.3. Rising demand for convenience food
- 3.1.4. Smart Technology in packaging Goes Next Level
- 3.1.5. Growing trend of online purchase has significant impact on foodservice packaging
- 3.2. Product Innovation Trends
- 3.3. Future Prospects of the Foodservice Packaging Industry
- 3.3.1. Factors Fuelling the Growth
- 3.3.2. Influx of Brands
- 3.3.3. Innovative Distribution and Marketing Strategies
4. Global Foodservice Packaging Market Outlook, 2019-2032
- 4.1. Historical Market Volume ('000 Units) Analysis, 2019-2024
- 4.2. Current and Future Market Volume ('000 Units) Projections, 2025-2032
- 4.3. Y-o-Y Growth Trend Analysis
5. Global Foodservice Packaging Market - Pricing Analysis
- 5.1. Pricing Analysis By Product Type
- 5.2. Global Average Pricing Analysis Benchmark
6. Global Foodservice Packaging Market Outlook, 2019-2032
- 6.1. Historical Market Value (US$ Bn) Analysis, 2019-2024
- 6.2. Current and Future Market Value (US$ Bn) Projections, 2025-2032
- 6.2.1. Y-o-Y Growth Trend Analysis
- 6.2.2. Absolute $ Opportunity Analysis
7. Market Background
- 7.1. Global Packaging industry Outlook
- 7.1.1. Perception of Packaging
- 7.1.2. Top Foodservice Packaging products in the market
- 7.1.3. Top 10 Foodservice Packaging Companies in the World
- 7.2. Macro-Economic Factors
- 7.2.1. GDP Growth Outlook
- 7.2.2. Consumer Spending Outlook
- 7.2.3. GDP Growth Rate Analysis
- 7.2.4. Internet Penetration Rate Outlook
- 7.2.5. Income Group Population Overview
- 7.2.6. Per Capita Disposable Income
- 7.3. Forecast Factors - Relevance & Impact
- 7.3.1. Top Companies Historical Growth
- 7.3.2. Increasing number of Students across the world.
- 7.3.3. Urbanization Growth Outlook
- 7.3.4. Others
- 7.4. PESTLE Analysis of Global Foodservice Packaging Market
- 7.5. Investment Feasibility Matrix of Foodservice Packaging Market
- 7.6. Porter's Five Forces Analysis of Global Foodservice Packaging Market
- 7.7. Market Dynamics
- 7.7.1. Drivers
- 7.7.2. Restraints
- 7.7.3. Opportunity Analysis
8. Global Foodservice Packaging Market Outlook, 2019-2032 , By Product Type
- 8.1. Introduction / Key Findings
- 8.2. Historical Market Size (US$ Bn) Analysis By Product Type, 2019-2024
- 8.3. Current and Future Market Size (US$ Bn) Analysis and Forecast By Product Type, 2025-2032
- 8.3.1. Plates
- 8.3.2. Trays
- 8.3.3. Cups
- 8.3.4. Bowls
- 8.3.5. Pizza Boxes
- 8.3.6. Straws
- 8.3.7. Single serve Portion Packs
- 8.3.8. Clamshell
- 8.3.9. Lids for Cups
- 8.3.10. Stirrers
- 8.3.11. Cutlery (Knives, Forks, Spoons)
- 8.4. Market Attractiveness Analysis By Product Type
9. Global Foodservice Packaging Market Outlook, 2019-2032 , by Material
- 9.1. Introduction / Key Findings
- 9.2. Historical Market Size (US$ Bn) and Volume Analysis By Material, 2019-2024
- 9.3. Current and Future Market Size (US$ Bn) and Volume Analysis and Forecast By Material, 2025-2032
- 9.3.1. Aluminium
- 9.3.2. Paperboard
- 9.3.3. Moulded Fibres
- 9.3.4. Plastic
- 9.3.5. Polystyrene
- 9.3.6. Polypropylene
- 9.3.7. Polyethylene
- 9.3.8. Polyethylene Terephthalate
- 9.3.9. Poly Lactic Acid
- 9.3.10. Wood
- 9.4. Market Attractiveness Analysis By Material
10. Global Foodservice Packaging Market Outlook, 2019-2032 , by Fabrication Process
- 10.1. Introduction / Key Findings
- 10.2. Historical Market Size (US$ Bn) and Volume Analysis By Fabrication Process, 2019-2024
- 10.3. Current and Future Market Size (US$ Bn) and Volume Analysis and Forecast By Fabrication Process, 2025-2032
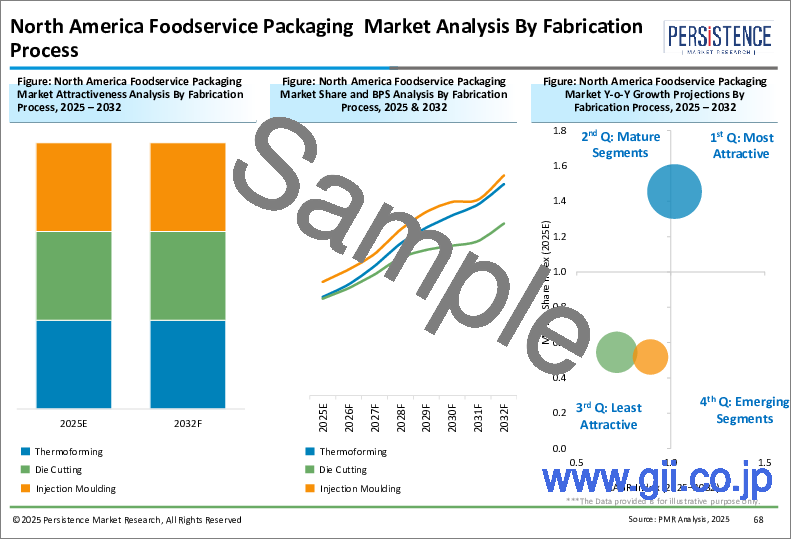
- 10.3.1. Thermoforming
- 10.3.2. Die Cutting
- 10.3.3. Injection Moulding
- 10.4. Market Attractiveness Analysis By Fabrication Process
11. Global Foodservice Packaging Market Outlook, 2019-2032 , by End Use
- 11.1. Introduction / Key Findings
- 11.2. Historical Market Size (US$ Bn) and Volume Analysis By End Use, 2019-2024
- 11.3. Current and Future Market Size (US$ Bn) and Volume Analysis and Forecast By End Use, 2025-2032
- 11.3.1. Foodservice Outlets
- 11.3.2. Institutional Foodservice
- 11.3.3. Online Food Ordering
- 11.4. Market Attractiveness Analysis By End Use
12. Global Foodservice Packaging Market Outlook, 2019-2032 , by Region
- 12.1. Introduction
- 12.2. Historical Market Size (US$ Bn) and Volume ('000 Units) Analysis by Region, 2019-2024
- 12.3. Current Market Size (US$ Bn) and Volume ('000 Units) Analysis and Forecast by Region, 2025-2032
- 12.3.1. North America
- 12.3.2. Latin America
- 12.3.3. Europe
- 12.3.4. East Asia
- 12.3.5. South Asia
- 12.3.6. Oceania
- 12.3.7. Middle East and Africa (MEA)
- 12.4. Market Attractiveness Analysis by Region
13. North America Foodservice Packaging Market Outlook, 2019-2032
- 13.1. Introduction
- 13.2. Pricing Analysis
- 13.3. Historical Market Size (US$ Bn) and Volume Trend Analysis By Market Taxonomy, 2019-2024
- 13.4. Market Size (US$ Bn) and Volume Forecast By Market Taxonomy, 2025-2032
- 13.4.1. By Country
- 13.4.1.1. U.S.
- 13.4.1.2. Canada
- 13.4.2. By Product Type
- 13.4.3. By Material
- 13.4.4. By Fabrication Process
- 13.4.5. End Use
- 13.4.1. By Country
- 13.5. Market Attractiveness Analysis
- 13.5.1. By Country
- 13.5.2. By Product Type
- 13.5.3. By Material
- 13.5.4. By Fabrication Process
- 13.5.5. End Use
14. Latin America Foodservice Packaging Market Outlook, 2019-2032
- 14.1. Introduction
- 14.2. Pricing Analysis
- 14.3. Historical Market Size (US$ Bn) and Volume Trend Analysis By Market Taxonomy, 2019-2024
- 14.4. Market Size (US$ Bn) and Volume Forecast By Market Taxonomy, 2025-2032
- 14.4.1. By Country
- 14.4.1.1. Brazil
- 14.4.1.2. Mexico
- 14.4.1.3. Rest of Latin America
- 14.4.2. By Product Type
- 14.4.3. By Material
- 14.4.4. By Fabrication Process
- 14.4.5. End Use
- 14.4.1. By Country
- 14.5. Market Attractiveness Analysis
- 14.5.1. By Country
- 14.5.2. By Product Type
- 14.5.3. By Material
- 14.5.4. By Fabrication Process
- 14.5.5. End Use
15. Europe Foodservice Packaging Market Outlook, 2019-2032
- 15.1. Introduction
- 15.2. Pricing Analysis
- 15.3. Historical Market Size (US$ Bn) and Volume Trend Analysis By Market Taxonomy, 2019-2024
- 15.4. Market Size (US$ Bn) and Volume Forecast By Market Taxonomy, 2025-2032
- 15.4.1. By Country
- 15.4.1.1. Germany
- 15.4.1.2. Italy
- 15.4.1.3. France
- 15.4.1.4. U.K.
- 15.4.1.5. Spain
- 15.4.1.6. Rest of Europe
- 15.4.2. By Product Type
- 15.4.3. By Material
- 15.4.4. By Fabrication Process
- 15.4.5. End Use
- 15.4.1. By Country
- 15.5. Market Attractiveness Analysis
- 15.5.1. By Country
- 15.5.2. By Product Type
- 15.5.3. By Material
- 15.5.4. By Fabrication Process
- 15.5.5. End Use
16. South Asia Foodservice Packaging Market Outlook, 2019-2032
- 16.1. Introduction
- 16.2. Pricing Analysis
- 16.3. Historical Market Size (US$ Bn) and Volume Trend Analysis By Market Taxonomy, 2019-2024
- 16.4. Market Size (US$ Bn) and Volume Forecast By Market Taxonomy, 2025-2032
- 16.4.1. By Country
- 16.4.1.1. India
- 16.4.1.2. Thailand
- 16.4.1.3. Indonesia
- 16.4.1.4. Malaysia
- 16.4.1.5. Rest of South Asia
- 16.4.2. By Product Type
- 16.4.3. By Material
- 16.4.4. By Fabrication Process
- 16.4.5. End Use
- 16.4.1. By Country
- 16.5. Market Attractiveness Analysis
- 16.5.1. By Country
- 16.5.2. By Product Type
- 16.5.3. By Material
- 16.5.4. By Fabrication Process
- 16.5.5. End Use
17. East Asia Foodservice Packaging Market Outlook, 2019-2032
- 17.1. Introduction
- 17.2. Pricing Analysis
- 17.3. Historical Market Size (US$ Bn) and Volume Trend Analysis By Market Taxonomy, 2019-2024
- 17.4. Market Size (US$ Bn) and Volume Forecast By Market Taxonomy, 2025-2032
- 17.4.1. By Country
- 17.4.1.1. China
- 17.4.1.2. Japan
- 17.4.1.3. South Korea
- 17.4.2. By Product Type
- 17.4.3. By Material
- 17.4.4. By Fabrication Process
- 17.4.5. End Use
- 17.4.1. By Country
- 17.5. Market Attractiveness Analysis
- 17.5.1. By Country
- 17.5.2. By Product Type
- 17.5.3. By Material
- 17.5.4. By Fabrication Process
- 17.5.5. End Use
18. Oceania Foodservice Packaging Market Outlook, 2019-2032
- 18.1. Introduction
- 18.2. Pricing Analysis
- 18.3. Historical Market Size (US$ Bn) and Volume Trend Analysis By Market Taxonomy, 2019-2024
- 18.4. Market Size (US$ Bn) and Volume Forecast By Market Taxonomy, 2025-2032
- 18.4.1. By Country
- 18.4.1.1. Australia
- 18.4.1.2. New Zealand
- 18.4.2. By Product Type
- 18.4.3. By Material
- 18.4.4. By Fabrication Process
- 18.4.5. End Use
- 18.4.1. By Country
- 18.5. Market Attractiveness Analysis
- 18.5.1. By Country
- 18.5.2. By Product Type
- 18.5.3. By Material
- 18.5.4. By Fabrication Process
- 18.5.5. End Use
19. Middle East and Africa Foodservice Packaging Market Outlook, 2019-2032
- 19.1. Introduction
- 19.2. Pricing Analysis
- 19.3. Historical Market Size (US$ Bn) and Volume Trend Analysis By Market Taxonomy, 2019-2024
- 19.4. Market Size (US$ Bn) and Volume Forecast By Market Taxonomy, 2025-2032
- 19.4.1. By Country
- 19.4.1.1. GCC Countries
- 19.4.1.2. Northern Africa
- 19.4.1.3. South Africa
- 19.4.1.4. Rest of Middle East and Africa
- 19.4.2. By Product Type
- 19.4.3. By Material
- 19.4.4. By Fabrication Process
- 19.4.5. End Use
- 19.4.1. By Country
- 19.5. Market Attractiveness Analysis
- 19.5.1. By Country
- 19.5.2. By Product Type
- 19.5.3. By Material
- 19.5.4. By Fabrication Process
- 19.5.5. End Use
20. Key Countries' Foodservice Packaging Market Analysis 2025-2032
- 20.1. Introduction
- 20.1.1. Market Value Proportion Analysis, By Key Countries
- 20.1.2. Global Vs. Country Growth Comparison
- 20.2. U.S. Foodservice Packaging Market Analysis
- 20.2.1. By Product Type
- 20.2.2. By Material
- 20.2.3. By Fabrication Process
- 20.2.4. End Use
- 20.3. Canada Foodservice Packaging Market Analysis
- 20.4. Mexico Foodservice Packaging Market Analysis
- 20.5. Brazil Foodservice Packaging Market Analysis
- 20.6. Germany Foodservice Packaging Market Analysis
- 20.7. Italy Foodservice Packaging Market Analysis
- 20.8. U.K. Foodservice Packaging Market Analysis
- 20.9. China Foodservice Packaging Market Analysis
- 20.10. Japan Foodservice Packaging Market Analysis
- 20.11. S. Korea Foodservice Packaging Market Analysis
- 20.12. India Foodservice Packaging Market Analysis
- 20.13. Australia and New Zealand Foodservice Packaging Market Analysis
- 20.14. South Africa Foodservice Packaging Market Analysis
21. Market Structure Analysis
- 21.1. Market Analysis by Tier of Companies (Foodservice Packaging)
- 21.2. Market Concentration
- 21.3. Market Share Analysis of Top Players
- 21.4. Market Presence Analysis
- 21.4.1. By Regional footprint of Players
- 21.4.2. Product foot print by Players
- 21.4.3. Channel Foot Print by Players
22. Competition Analysis
- 22.1. Competition Dashboard
- 22.2. Pricing Analysis by Competition
- 22.3. Competition Benchmarking
- 22.4. Competition Deep Dive
- 22.4.1. Dart Container Corporation
- 22.4.1.1. Overview
- 22.4.1.2. Product Portfolio
- 22.4.1.3. Profitability by Market Segments (Product/Channel/Region)
- 22.4.1.4. Sales Footprint
- 22.4.1.5. Strategy Overview
- 22.4.1.5.1. Marketing Strategy
- 22.4.1.5.2. Product Strategy
- 22.4.1.5.3. Channel Strategy
- 22.4.2. Georgia-Pacific LLC
- 22.4.3. Anchor Packaging Inc.
- 22.4.4. Pactiv LLC
- 22.4.5. D&W Fine Pack
- 22.4.6. Gold Plast SPA
- 22.4.7. Berry Global Group Inc.
- 22.4.8. DOpla S.p.A.
- 22.4.9. Smurfit Kappa Group
- 22.4.10. WestRock Company
- 22.4.11. Huhtamaki Oyj
- 22.4.12. New WinCup Holdings, Inc.
- 22.4.13. Linpac Packaging Ltd
- 22.4.14. Graphic Packaging Holding Company
- 22.4.1. Dart Container Corporation
