|
|
市場調査レポート
商品コード
1309748
通信ネットワークのエネルギー効率は年率12%上昇:消費エネルギー1MWhあたりのトラフィックは2020年の12.3TBから、2022年には15.5TBとなるがコスト削減と排出抑制にはさらなる効率化が不可欠Telco Network Energy Efficiency Rising 12% Per Year: Average Telco Carried 15.5 Terabytes of Traffic Per MWh of Energy Consumed in 2022, From 12.3 in 2020, More Efficiency is Essential to Control Costs, Emissions |
||||||
|
|
|||||||
|
|||||||


| 通信ネットワークのエネルギー効率は年率12%上昇:消費エネルギー1MWhあたりのトラフィックは2020年の12.3TBから、2022年には15.5TBとなるがコスト削減と排出抑制にはさらなる効率化が不可欠 |
|
出版日: 2023年07月12日
発行: MTN Consulting, LLC
ページ情報: 英文 9 Pages
納期: 即納可能
|

- 全表示
- 概要
- 図表
- 目次
本調査の対象となる通信事業者16社は、収益ベースで世界市場の40%以上を占めています。16社平均の収益100万米ドルあたりのトラフィックは2020年の1.41PBから、2022年には1.93PBを示し、37%の増加となりました。2020年から2022年にかけての16社のネットワークトラフィックは13.8%のCAGRで増加しましたが、一方で、総エネルギー消費量はCAGR1.2%の増加にとどまっています。1PBあたりのエネルギー消費量は、2020年の81.3MWhから、2022年には64.4MWhの減少となりました。この改善は、ネットワークのエネルギー効率を長期的に改善するという、通信事業者とそのベンダーの目標に沿ったものです。また、16社平均のトラフィックユニットあたりの炭素排出量も同期間に減少し、2020年の1PBあたり1億1,080万トンのMTCO2eから、2022年には83.3MTCO2e/PBに減少しています。
当レポートでは、16の通信事業者のネットワークトラフィック、エネルギー消費量、炭素排出量、収益に関するデータを調査し、通信事業者市場におけるエネルギー消費とネットワークトラフィックの関係を検証します。
ビジュアル
対象範囲
掲載企業・組織
|
|
目次
サマリー
通信ネットワークのエネルギー効率:年間12%向上
- データセットの概要
- 収益とトラフィックの難題は依然として続く
- 通信会社にとって炭素排出量の重要性が高まる
- 消費エネルギーユニット当たりの伝送トラフィック
- ベンダー:改善継続において中心的な役割を果たす
- 総論
付録
List of Tables and Figures
- Table 1: Summary metrics for the "Group of 16" telcos
- Figure 1: Petabytes of traffic on network per US$M in revenue, 2020-22*
- Figure 2: Carbon footprint (MT CO2e) per petabyte of traffic on network, 2020-22*
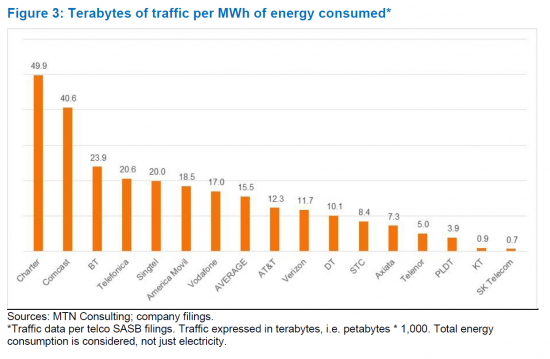
- Figure 3: Terabytes of traffic per MWh of energy consumed*
For a group of 16 telcos, MTN Consulting has analyzed data on network traffic, energy consumption, carbon emissions, and revenues. This brief examines the relationship between energy consumption and network traffic in the telco market.
VISUALS
The group of 16 telcos included in this analysis represent over 40% of the global market, based on revenues. On a revenue basis, our data verify the well-known revenue-traffic conundrum: in 2022, the average telco carried 1.93 Petabytes of traffic per US$1M in revenue, up 37% from 1.41 PB/$M in 2020. In the 2020-22 timeframe, this group increased network traffic at an average annual rate (CAGR) of 13.8%, while their total energy consumption grew at a CAGR of 1.2%. As such, in 2022 the average telco consumed 64.4 MWh of energy per Petabyte of traffic, down from 81.3 MWh/PB in 2020. This improvement is in line with the stated goal of both telcos and their vendors: to improve the network's energy efficiency over time. The average telco's carbon footprint per unit of traffic also declined in the same period, from 110.8 millions of tons of CO2 equivalent (MTCO2e) per Petabyte in 2020 to 83.3 MTCO2e/PB in 2022.
Telco sustainability reports emphasize the importance of adopting energy efficient technologies and network designs. Vendors consider the energy efficiency of their solutions a crucial differentiator. As telcos attempt to lower energy costs and reduce their carbon footprints, vendors have an opportunity to support further improvements.
COVERAGE:
Organizations mentioned:
|
|
Table of Contents
Summary
Telco network energy efficiency rising 12% per year
- Overview of the dataset
- The revenue-traffic conundrum persists
- Carbon emissions rising in importance for telcos
- Traffic carried per unit of energy consumed
- Vendors have a central role in sustaining improvements
- Conclusion
