|
|
市場調査レポート
商品コード
1717364
オペレーターの収益戦略:2025-2029年Operator Revenue Strategies: 2025-2029 |
||||||
|
|||||||
| オペレーターの収益戦略:2025-2029年 |
|
出版日: 2025年05月06日
発行: Juniper Research Ltd
ページ情報: 英文
納期: 即日から翌営業日
|
全表示
- 概要
- 目次
モバイルネットワークオペレーターの企業向けサービスからの収益規模は2029年までに3,480億米ドルに達する見通し
| 主要統計 | |
|---|---|
| 世界のネットワークオペレーターの収益 (~2029年): | 1兆米ドル |
| 世界のネットワークオペレーターの企業向けサービスからの収益 (2029年): | 3,480億米ドル |
| 世界のネットワークオペレーターの消費者向けサービスからの収益 (~2029年): | 6,830億米ドル |
| 予測期間: | 2025-2029年 |
当レポートでは、ネットワークオペレーターの収益動向と戦略を調査し、世界60カ国にまたがるデータをもとに、ダイナミックで競争の激しいネットワークオペレーター市場の動向と、収益分析、コンシューマー市場の飽和、ネットワーク所有コストの上昇、5Gマネタイゼーションにおける課題など、現在の市場課題を分析しています。本レポートは、業界環境を理解するための重要なツールであり、ネットワークオペレーター、事業者向け技術ソリューションプロバイダー、規制機関や政策立案者が今後の戦略を策定する際に役立ちます。
本スイートには、60か国以上の複数のセグメントにわたる市場規模、主要予測データ、主要なトレンド、課題、関係者への重要な提言を包括的に評価する戦略・動向文書が含まれています。これらは総合的に、この急成長する市場を理解するための重要なツールとなり、ネットワークオペレーターや技術ベンダーが将来の戦略を構築するために役立ちます。
主な特徴
- 主な要点と戦略的提言:ネットワークオペレーターの市場に関する詳細な分析から得られた主な知見を要約し、現在および近い将来の市場をナビゲートするための事業者への主要な戦略的提言を添えています。
- 今後の市場展望:世界の主要8地域、セルラー技術、消費者/企業部門別に、契約数と収益の伸びなど、今後の市場見通しに関する洞察を掲載しています。また、ネットワークオペレーターの収益に関する洞察も含まれています。
- AIの展開
- モバイルメッセージング
- モバイルローミング
- 事業者にとっての新たな機会:本調査では、事業者が近い将来の収益戦略の一環として注目すべきネットワークサービス提供の3つの主要技術分野を評価しています。以下はその一例です。
- マネージド&コンサルティングサービス
- ネットワークAPI
- 旅行eSIMソリューション
- 市場予測・主な要点:本レポートに付随するデータセットから、8つの主要地域別に分類された重要な予測統計の一部を抜粋し、主要なポイントに関する分析や、それに対してネットワークオペレーターがどのように対応すべきかについての考察も含まれています。
データ&インタラクティブ予測
加入者普及率、ネットワークオペレーターの収益、ネットワーク技術別、セクター別、主要8地域別、61カ国別など、さまざまな指標に関する広範な過去データと5年間の予測データを掲載しています。指標には以下が含まれます。
- モバイル加入数
- 世界のネットワークオペレーター請求による総収益
- 世界のネットワークオペレーターの総ARPU
- セルラーIoT総接続数
- セルラーIoT総収益
エンタープライズ、コンシューマー、2G/3G、4G、5G、LPWA、6Gの市場内訳
- SMSトラフィック合計
- SMSあたりの平均収益
- SMS総収益
- RCS対応モバイル加入者総数
- RCSトラフィック合計
- RCSの総収益
P2PおよびA2Pのセクター別内訳を含みます。
サンプルビュー
市場動向・予測

目次
第1章 重要ポイント・戦略的提言
- 重要ポイント・戦略的提言
- 戦略的提言
第2章 将来の市場見通し
- 将来の市場見通し
- ネットワーク収益化の未来
- エンタープライズサービスの収益化
- AI導入
- モバイルメッセージング
- SMS
- SMSのコスト
- 会話型コマース
- SMS詐欺
- 企業向け双方向SMS
- モバイルローミング
第3章 事業者にとっての新たな機会
- オペレーターにとっての新たな機会
- マネージド&コンサルティングサービス
- ネットワークAPI
- 旅行向けeSIMソリューション
- 旅行用SIM
第4章 市場予測・重要ポイント
- オペレーターの収益予測:イントロダクション
- 予測調査手法
- 世界のネットワークオペレーターのARPU
- 世界のネットワークオペレーター請求による収益
- ネットワークオペレーターの消費者向けサービス収益
- ネットワークオペレーターの企業向けサービス収益
- 4Gネットワークオペレーター請求による総収益
- 4Gネットワークオペレーターの消費者向けサービス収益
- 4Gネットワークオペレーターの企業向けサービス収益
- 5Gネットワークオペレーター請求による収益
- 5Gネットワークオペレーターの消費者向けサービス収益
- 5Gネットワークオペレーターの企業向けサービス収益
'Mobile Network Operators' Enterprise Revenue to Reach $348bn by 2029'
| KEY STATISTICS | |
|---|---|
| Global network operator revenue by 2029: | $1tn |
| Global network operator enterprise revenue in 2029: | $348bn |
| Global network operator consumer revenue by 2029: | $683bn |
| Forecast period: | 2025-2029 |
Overview
Discover invaluable insights into trends and strategies for network operator revenue in our latest report, Operator Revenue Strategies. With data split across 60 countries, this extensive forecast analyses the dynamic and competitive network operator market and the current market challenges posed by slowing revenue, high market saturation in the consumer market, rising network ownership costs, and challenges in 5G monetisation. The report is a critical tool for understanding the industry environment; helping network operators, technical solutions providers for those operators, and regulatory bodies and policy makers to shape their future strategy.
The suite includes both a data deliverable, sizing the market and providing key forecast data for over 60 countries and several different segments, as well as a strategy and trends document which gives a complete assessment of the key trends, challenges and key recommendations for stakeholders. Collectively, they provide a critical tool for understanding this rapidly emerging market; allowing network operators and technology vendors to shape their future strategy.
All report content is delivered in the English language.
Key Features
- Key Takeaways & Strategic Recommendations: Key summarised findings from in-depth analysis into the network operators' market, accompanied by key strategic recommendations for operators to navigate the market at the present time and in the near future.
- Future Market Outlooks: Includes insights into the future market prospects, including the growth in mobile subscriptions and revenue, with splits for eight key world regions, by cellular technology, and by consumer and enterprise sectors. There are also insights into areas of network operator revenue including:
- AI Deployment
- Mobile Messaging
- Mobile Roaming
- Emerging Opportunities for Operators: The study assesses three key technical areas of network service provision which operators must be looking to as part of their revenue strategies going into the near future. These include:
- Managed & Consulting Services
- Network APIs
- Travel eSIM Solutions
- Market Forecasts & Key Takeaways: A selection of key forecasted statistics from the report's accompanying dataset, broken down by 8 key regions, with some accompanying analysis of key takeaways, as well as how network operators should act upon them.
Data & Interactive Forecast
Extensive historical and 5-year forecasted data on a wide array of metrics including subscriber penetration, network operator revenue, as well as breakdowns by different network technologies, sectors, and by our 8 key regions and 61 countries. Metrics include:
- Total Mobile Subscriptions
- Total Global Network Operator-billed Revenue
- Total Global Network Operator ARPU
- Total Cellular IoT Connections
- Total Cellular IoT Revenue
With market breakdowns for Enterprise, Consumer, 2G/3G, 4G, 5G, LPWA and 6G.
- Total SMS Traffic
- Average Revenue per SMS
- Total SMS Revenue
- Total RCS-capable Mobile Subscribers
- Total RCS Traffic
- Total RCS Revenue
With sector breakdowns for P2P and A2P.
SAMPLE VIEW
Market Trends & Forecasts

A comprehensive analysis of the current market landscape, alongside strategic recommendations and a walk-through of the forecasts.
Table of Contents
1. Key Takeaways & Strategic Recommendations
- 1.1. Key Takeaways and Strategic Recommendations
- 1.1.2. Strategic Recommendations
2. Future Market Outlooks
- 2.1. Future Market Outlooks
- Figure 2.1: Total Mobile Subscriptions, Split by 8 Key Regions, 2024-2029
- Figure 2.2: Total Mobile Subscriptions, 2025, Split by Cellular Technology
- 2.2. The Future of Network Monetisation
- Figure 2.3: Consumer Operator-billed Monthly ARPU ($), Split by 8 Key Regions, 2021-2029
- 2.3. Monetising Enterprise Services
- Figure 2.4: Global Operator Revenue ($m), Split by Consumer & Enterprise, 2025-2029
- Figure 2.5: MVNO Revenue as a Proportion of Total Network Operator Revenue (%), 2020-2029, Split by 8 Key Regions
- 2.4. AI Deployment
- 2.5. Mobile Messaging
- Figure 2.6: Total Mobile Messaging Traffic (m), 2025, Split by Service
- Figure 2.7: Total Mobile Messaging Traffic in 2025 (m), Split by 8 Key Regions
- 2.6. SMS
- Figure 2.8: Total SMS Traffic (m), Split by 8 Key Regions, 2024-2029
- 2.6.1. The Cost of SMS
- Figure 2.9: Average Revenue per A2P SMS ($), Split by 8 Key Regions, 2021-2029
- 2.6.2. Conversational Commerce
- 2.6.3. SMS Fraud
- Figure 2.10: Infographic with SMS Fraud Types
- i. AIT Fraud
- Figure 2.11: AIT Fraud Infographic
- ii. Tighter Global Restrictions
- 2.6.4. Two-way SMS for Businesses
- Figure 2.12: One-way vs Two-way Business SMS Infographic
- 2.7. Mobile Roaming
- Figure 2.13: Mobile Roaming Structure
- Figure 2.14: Total Wholesale Roaming Revenue ($m), Split by 8 Key Regions, 2024-2029
3. Emerging Opportunities for Operators
- 3.1. Emerging Opportunities for Operators
- 3.1.1. Managed & Consulting Services
- i. Managed Network Services
- ii. Network Consulting Services
- 3.1.2. Network APIs
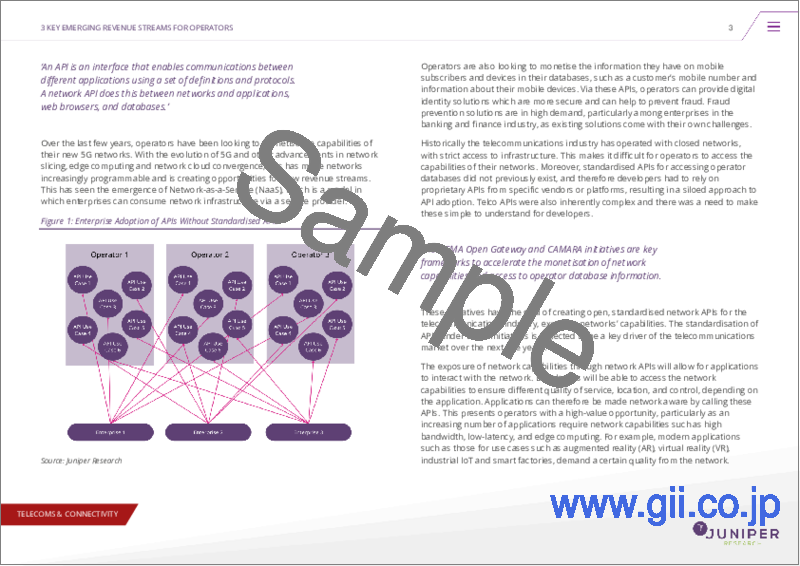
- Figure 3.1: Enterprise Adoption of APIs Without Standardised APIs
- Figure 3.2: Revenue Flow Without Telco APIs vs With
- 3.1.3. Travel eSIM Solutions
- Figure 3.3: Revenue From Travel SIMs & eSIMs ($m), Split by 8 Key Regions, 2024-2028
- Travel SIMs
- Figure 3.4: Travel SIM Packages Acquired Globally by Users (m) 2024-2028
- Figure 3.5: Proportion of Consumer Connected Devices Leveraging eSIMs for Connectivity in 2024 (%), Split by 8 Key Regions
- Figure 3.3: Revenue From Travel SIMs & eSIMs ($m), Split by 8 Key Regions, 2024-2028
- 3.1.1. Managed & Consulting Services
4. Market Forecasts & Key Takeaways
- 4.1. Introduction to Operator Revenue Forecasts
- 4.1.1. Forecast Methodology
- Figure 4.1: Operator Revenue Strategies Forecast Methodology
- 4.1.2. Global Network Operator ARPU
- Figure and Table 4.2: Global Network Operator ARPU ($), Split by 8 Key Regions, 2025-2029
- 4.1.3. Global Network Operator-billed Revenue
- Figure and Table 4.3: Global Network Operator-billed Revenue ($m), Split by 8 Key Regions, 2025-2029
- 4.1.4. Total Network Operator Consumer Revenue
- Figure and Table 4.4: Total Network Operator Consumer Revenue ($m), Split by 8 Key Regions, 2025-2029
- 4.1.5. Total Network Operator Enterprise Revenue
- Figure and Table 4.5: Total Network Operator Enterprise Revenue ($m), Split by 8 Key Regions, 2025-2029
- 4.1.6. Total 4G Network Operator-billed Revenue
- Figure and Table 4.6: Total Operator-billed Revenue ($m), Split by 8 Key Regions, 2025-2029
- 4.1.7. Total Consumer 4G Network Operator Revenue
- Figure and Table 4.7: Total Consumer 4G Network Operator Revenue ($m), Split by 8 Key Regions, 2025-2029
- 4.1.8. Total Enterprise 4G Network Operator Revenue
- Figure and Table 4.8: Total Enterprise 4G Network Operator Revenue ($m), Split by 8 Key Regions, 2025-2029
- 4.1.9. Total 5G Network Operator-billed Revenue
- Figure and Table 4.9: Total 5G Network Operator Revenue ($m), Split by 8 Key Regions, 2025-2029
- 4.1.10. Total Consumer 5G Network Operator Revenue
- Figure and Table 4.10: Total 5G Consumer Network Operator Revenue ($m), Split by 8 Key Regions, 2025-2029
- 4.1.11. Total Enterprise 5G Network Operator Revenue
- Figure and Table 4.11: Total 5G Enterprise Network Operator Revenue ($m), Split by 8 Key Regions, 2025-2029
- 4.1.1. Forecast Methodology


