
|
市場調査レポート
商品コード
1690122
魚:市場シェア分析、産業動向・統計、成長予測(2025年~2030年)Fish - Market Share Analysis, Industry Trends & Statistics, Growth Forecasts (2025 - 2030) |
||||||
カスタマイズ可能
適宜更新あり
|
|||||||
| 魚:市場シェア分析、産業動向・統計、成長予測(2025年~2030年) |
|
出版日: 2025年03月18日
発行: Mordor Intelligence
ページ情報: 英文 120 Pages
納期: 2~3営業日
|

全表示
- 概要
- 目次
概要
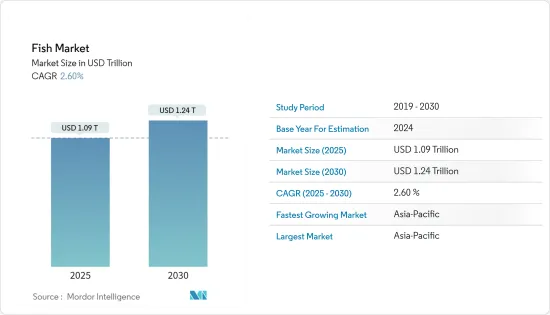
魚の市場規模は2025年に1兆900億米ドルと推計され、予測期間中(2025-2030年)のCAGRは2.6%で、2030年には1兆2,400億米ドルに達すると予測されます。
主なハイライト
- 食糧農業機関によると、魚は30億人以上の1人当たり平均動物性タンパク質摂取量の20%を占めています。魚はさまざまな地域で生鮮食品および加工食品として消費されています。魚は赤身のタンパク質とオメガ3脂肪酸の好ましい供給源であるため、より健康的な食生活の普及が魚の消費を促進しています。
- 北米や欧州のような地域での魚需要の増加は、中国、インド、インドネシア、ベトナムのような魚生産国に大きな輸出機会をもたらしています。2023年には、中国が10万2,972トンの魚を輸出し、世界の魚輸出を牽引しました。技術の進歩は魚の生産と物流に拍車をかけ、機械化されたボートや漁船、ソナー、漁師の魚の位置特定を助けるGPS技術に続き、魚の保存性を高め、輸送中の劣化を防ぐ冷蔵・低温貯蔵など、市場における魚の供給サイドを形成しています。
- 多くの政府は、国内生産と輸出を促進するため、補助金、助成金、支援規制を通じて水産業を振興しています。例えば、中国政府は2022年に、魚の生産と輸出を増加させるため、第14次国家漁業開発5ヵ年計画を導入しました。同様に、インド政府はPradhana Mantri Matsya Sampada Yojanaで水産業を支援しています。
魚市場の動向
魚の生産と輸送における技術の進歩が魚の供給に拍車をかける
- 技術の進歩は魚市場を大きく変貌させ、生産と流通の効率を高めています。水産業における人工知能は、魚の飼育、監視、収穫を改善することが期待される魚養殖の未来です。調査では、水質、摂餌パターン、魚の行動などのデータ分析に機械学習を使用し、病気の初期症状を検出します。これらの改善は、漁業技術、養殖、サプライチェーン物流に及び、市場における高品質な魚の増産につながります。
- さらに、"Fish-Finder "は、漁師がより正確かつ効率的に魚群の位置を特定し、時間と燃料費を削減できるよう、ソナーとGPS技術を駆使したイノベーションです。先進的な漁船は、より優れたエンジン、貯蔵施設、処理装置を備えており、より長い漁業と魚の品質維持を可能にしています。漁具の革新は、不要な魚の捕獲を減らし、環境への影響を最小限に抑えます。例えば、選択的漁具は特定の魚種を対象とし、対象外の魚種は無傷で逃がすことができます。
- 世界経済フォーラムの「世界の水生食品の損失と浪費の調査」と題する報告書によると、2021年の水生食品の損失または浪費は2,380万トンで、その年に生産される世界の水生食品の14.8%を占める。したがって、輸送中のこのような無駄を減らすために、物流における冷蔵・冷凍技術は、魚が捕獲されてから消費されるまで鮮度を保つことを保証し、最終的には輸送中の魚の劣化を減らすことになります。
アジア太平洋が市場を独占
- アジア太平洋は、新興経済諸国によってもたらされた機会により、重要な魚市場となっています。インドや中国のような国々は現在、本格的な魚を使った料理の中心地となっており、これはレストランのメニューの多様性からも明らかです。
- インドやインドネシアなどの国々における魚の生産は、市場成長の重要な促進要因です。都市化、可処分所得の増加、タンパク質が豊富な魚料理への需要の増加といった動向がこの傾向に寄与しています。さらに、鮮度と種類の豊富さによる消費者の高級品志向が、予測期間中の市場の成長を促進すると予想されます。
- さらに、この地域の政府は漁業と養殖業の重要性と可能性を認識しています。例えば、インド政府は2023年2月、7億2,660万米ドルを投資目標とするPM-MKSSY(Pradhan Mantri Matsya Kisan Samridhi Sah-Yojana)を導入し、National Fisheries Sector Digital Platform(NFDP)を通じて利害関係者の全国登録簿を作成し、漁業セクターの正式化を目指しています。このプロジェクトは、漁業に携わる零細・小規模企業の制度融資へのアクセスを容易にし、養殖保険へのインセンティブを提供し、安全・品質保証システムを促進するものです。
- さらに、この地域の水産加工施設は、高圧処理(HPP)技術を利用しています。高圧処理とは、圧力容器に入れた液体の中に魚を沈める非加熱技術で、海面における平均気圧の約6000倍の圧力を利用して魚肉を低温殺菌し、作業効率を向上させるものです。アヴュア・テクノロジーズ社とフード・サイエンス・オーストラリア社が開発したHPP技術は、水産加工に広く利用されています。シンガポールを拠点とするザ・シーフード・カンパニーは、水産加工にHPP技術を使用しています。
その他の特典
- エクセル形式の市場予測(ME)シート
- 3ヶ月のアナリスト・サポート
目次
第1章 イントロダクション
- 調査の前提条件と市場定義
- 調査範囲
第2章 調査手法
第3章 エグゼクティブサマリー
第4章 市場力学
- 市場概要
- 市場促進要因
- 魚の生産と輸送における技術の進歩
- 魚食の健康効果による需要の高まり
- 政府の支援と政策が市場を牽引
- 市場抑制要因
- 養殖場での主な疾病発生
- 魚の貯蔵と輸送のための限られたコールドチェーンインフラ
- バリューチェーン分析
第5章 市場セグメンテーション
- タイプ
- 淡水魚
- 海水魚
- 地域
- 北米
- 米国
- 生産分析
- 消費分析(金額と数量)
- 輸入市場の分析(金額と数量)
- 輸出市場の分析(金額と数量)
- 価格動向分析
- カナダ
- 生産分析
- 消費市場の分析(金額と数量)
- 輸入市場の分析(金額と数量)
- 輸出市場の分析(金額と数量)
- 価格動向分析
- メキシコ
- 生産分析
- 消費市場の分析(金額と数量)
- 輸入市場の分析(金額と数量)
- 輸出市場の分析(金額と数量)
- 価格動向分析
- 欧州
- フランス
- 生産分析
- 消費市場の分析(金額と数量)
- 輸入市場の分析(金額と数量)
- 輸出市場の分析(金額と数量)
- 価格動向分析
- スペイン
- 生産分析
- 消費市場の分析(金額と数量)
- 輸入市場の分析(金額と数量)
- 輸出市場の分析(金額と数量)
- 価格動向分析
- 英国
- 生産分析
- 消費市場の分析(金額と数量)
- 輸入市場の分析(金額と数量)
- 輸出市場の分析(金額と数量)
- 価格動向分析
- ノルウェー
- 生産分析
- 消費市場の分析(金額と数量)
- 輸入市場の分析(金額と数量)
- 輸出市場の分析(金額と数量)
- 価格動向分析
- スウェーデン
- 生産分析
- 消費市場の分析(金額と数量)
- 輸入市場の分析(金額と数量)
- 輸出市場の分析(金額と数量)
- 価格動向分析
- オランダ
- 生産分析
- 消費市場の分析(金額と数量)
- 輸入市場の分析(金額と数量)
- 輸出市場の分析(金額と数量)
- 価格動向分析
- アジア太平洋
- 中国
- 生産分析
- 消費市場の分析(金額と数量)
- 輸入市場分析(金額と数量)
- 輸出市場の分析(金額と数量)
- 価格動向分析
- 日本
- 生産分析
- 消費市場の分析(金額と数量)
- 輸入市場の分析(金額と数量)
- 輸出市場の分析(金額と数量)
- 価格動向分析
- インドネシア
- 生産分析
- 消費市場の分析(金額と数量)
- 輸入市場の分析(金額と数量)
- 輸出市場の分析(金額と数量)
- 価格動向分析
- ベトナム
- 生産分析
- 消費市場の分析(金額と数量)
- 輸入市場の分析(金額と数量)
- 輸出市場の分析(金額と数量)
- 価格動向分析
- インド
- 生産分析
- 消費市場の分析(金額と数量)
- 輸入市場の分析(金額と数量)
- 輸出市場の分析(金額と数量)
- 価格動向分析
- ミャンマー
- 生産分析
- 消費市場の分析(金額と数量)
- 輸入市場の分析(金額と数量)
- 輸出市場の分析(金額と数量)
- 価格動向分析
- 南米
- ブラジル
- 生産分析
- 消費市場の分析(金額と数量)
- 輸入市場の分析(金額と数量)
- 輸出市場の分析(金額と数量)
- 価格動向分析
- チリ
- 生産分析
- 消費市場の分析(金額と数量)
- 輸入市場の分析(金額と数量)
- 輸出市場の分析(金額と数量)
- 価格動向分析
- アフリカ
- エジプト
- 生産分析
- 消費市場の分析(金額と数量)
- 輸入市場の分析(金額と数量)
- 輸出市場の分析(金額と数量)
- 価格動向分析
- ナイジェリア
- 生産分析
- 消費市場の分析(金額と数量)
- 輸入市場の分析(金額と数量)
- 輸出市場の分析(金額と数量)
- 価格動向分析
- コートジボワール
- 生産分析
- 消費市場の分析(金額と数量)
- 輸入市場の分析(金額と数量)
- 輸出市場の分析(金額と数量)
- 価格動向分析
- 北米
第6章 市場機会と今後の動向
目次
Product Code: 70034
The Fish Market size is estimated at USD 1.09 trillion in 2025, and is expected to reach USD 1.24 trillion by 2030, at a CAGR of 2.6% during the forecast period (2025-2030).
Key Highlights
- According to the Food and Agriculture Organization, fish accounted for 20% of the average per capita animal protein intake of more than 3 billion people. Fish is consumed as fresh and processed food in different regions. The growing adoption of healthier diets is driving fish consumption as fish is a preferred source of lean protein and omega-3 fatty acids.
- Increasing demand for fish in regions like North America and Europe has created significant export opportunities for fish-producing countries like China, India, Indonesia, and Vietnam. In 2023, China exported 102,972 metric tons of fish, driving the global fish exports. The advancements in technology are fueling fish production and logistics, shaping the supply side of fish in the market like mechanized boats and fishing vessels, sonar, and GPS technology aiding fishermen in locating fish followed by refrigerated and cold storage enhancing the shelf life of fish and preventing deterioration in the transit.
- Many governments promote the fishing industry through subsidies, grants, and supportive regulations to boost domestic production and exports. For instance, in 2022, the Chinese government introduced the 14th Five-Year National Fisheries Development Plan to increase fish production and exports. Similarly, the Indian government is supporting its fisheries industry with Pradhana Mantri Matsya Sampada Yojana.
Fish Market Trends
Technological Advancements in Fish Production and Transportation is Fueling the Supply of Fish
- Technological advancements have significantly transformed the fish market, enhancing production and distribution efficiency. Artificial intelligence in the fisheries industry is the future of fish farming, which is expected to improve fish breeding, monitoring, and harvesting. The research uses machine learning for data analysis, including water quality, feeding patterns, and the fish's behavior to detect early disease symptoms. These improvements span fishing techniques, aquaculture, and supply chain logistics, leading to increased production of quality fish in the market.
- Moreover, "Fish-Finder" is an innovation involving sonar and GPS technology to help fishermen locate fish groups more accurately and efficiently, reducing time and fuel costs. The advanced fishing boats have better engines, storage facilities, and processing units, allowing for longer fishing trips and maintaining fish quality. Innovations in fishing gear rods reduce unwanted fish catch and minimize environmental impact. For instance, selective fishing gear targets specific species, allowing non-target species to escape unharmed.
- According to the World Economic Forum's report titled "Investigating Global Aquatic Food Loss and Waste," the loss or wastage of aquatic food in 2021 is 23.8 million metric tons, accounting for 14.8% of the global aquatic food produced in that year. Therefore, to reduce this wastage in transit, refrigeration and freezing technologies in logistics ensure fish remain fresh from the point of capture to consumption, ultimately reducing fish deterioration in transit.
Asia-Pacific Dominates the Market
- Asia Pacific is a significant fish market due to opportunities created by developing economies. Countries like India and China are now culinary hubs for authentic fish-based dishes, which is evident from the diverse offerings on their restaurant menus.
- Fish production in countries like India and Indonesia is a significant driver of the market's growth. Factors such as urbanization, rising disposable income, and increased demand for protein-rich fish food contribute to this trend. Additionally, consumers' preference for premium-quality products due to freshness and variety is expected to fuel the market's growth during the forecast period.
- Furthermore, governments in the region are identifying the significance and potential of fisheries and aquaculture. For instance, in February 2023, the Government of India introduced the Pradhan Mantri Matsya Kisan Samridhi Sah-Yojana (PM-MKSSY) with a targeted investment of USD 726.6 million that aims to formalize the fisheries sector by creating a national registry of stakeholders through the National Fisheries Sector Digital Platform (NFDP). It facilitates access to institutional financing for micro and small enterprises in fisheries, provides incentives for aquaculture insurance, and promotes safety and quality assurance systems.
- In addition, fish processing establishments in the region are using high-pressure processing (HPP) technology, which is a non-thermal technology in which the fish is submerged in a liquid placed in a pressure vessel and uses pressures of about 6000 times the average air pressure at sea level to pasteurize fish meat to improve operational efficiency. HPP technologies developed by Avure Technologies and Food Science Australia are widely used in fish processing. The Seafood Company, a Singapore-based company, uses HPP technology for seafood processing.
Additional Benefits:
- The market estimate (ME) sheet in Excel format
- 3 months of analyst support
TABLE OF CONTENTS
1 INTRODUCTION
- 1.1 Study Assumptions and Market Definition
- 1.2 Scope of the Study
2 RESEARCH METHODOLOGY
3 EXECUTIVE SUMMARY
4 MARKET DYNAMICS
- 4.1 Market Overview
- 4.2 Market Drivers
- 4.2.1 Technological Advancements in Fish Production and Transportation
- 4.2.2 Rising Demand Due to Health Benefits of Fish Consumption
- 4.2.3 Government Support and Policies are Driving the Market
- 4.3 Market Restraints
- 4.3.1 Major Disease Outbreaks in Fish Farms
- 4.3.2 Limited Cold Chain Infrastructure for Fish Storage and Transportation
- 4.4 Value Chain Analysis
5 MARKET SEGMENTATION
- 5.1 Type
- 5.1.1 Freshwater Fish
- 5.1.2 Marine Water Fish
- 5.2 Geography
- 5.2.1 North America
- 5.2.1.1 United States
- 5.2.1.1.1 Production Analysis
- 5.2.1.1.2 Consumption Analysis (Value and Volume)
- 5.2.1.1.3 Import Market Analysis (Value and Volume)
- 5.2.1.1.4 Export Market Analysis (Value and Volume)
- 5.2.1.1.5 Price Trend Analysis
- 5.2.1.2 Canada
- 5.2.1.2.1 Production Analysis
- 5.2.1.2.2 Consumption Analysis (Value and Volume)
- 5.2.1.2.3 Import Market Analysis (Value and Volume)
- 5.2.1.2.4 Export Market Analysis (Value and Volume)
- 5.2.1.2.5 Price Trend Analysis
- 5.2.1.3 Mexico
- 5.2.1.3.1 Production Analysis
- 5.2.1.3.2 Consumption Analysis (Value and Volume)
- 5.2.1.3.3 Import Market Analysis (Value and Volume)
- 5.2.1.3.4 Export Market Analysis (Value and Volume)
- 5.2.1.3.5 Price Trend Analysis
- 5.2.2 Europe
- 5.2.2.1 France
- 5.2.2.1.1 Production Analysis
- 5.2.2.1.2 Consumption Analysis (Value and Volume)
- 5.2.2.1.3 Import Market Analysis (Value and Volume)
- 5.2.2.1.4 Export Market Analysis (Value and Volume)
- 5.2.2.1.5 Price Trend Analysis
- 5.2.2.2 Spain
- 5.2.2.2.1 Production Analysis
- 5.2.2.2.2 Consumption Analysis (Value and Volume)
- 5.2.2.2.3 Import Market Analysis (Value and Volume)
- 5.2.2.2.4 Export Market Analysis (Value and Volume)
- 5.2.2.2.5 Price Trend Analysis
- 5.2.2.3 United Kingdom
- 5.2.2.3.1 Production Analysis
- 5.2.2.3.2 Consumption Analysis (Value and Volume)
- 5.2.2.3.3 Import Market Analysis (Value and Volume)
- 5.2.2.3.4 Export Market Analysis (Value and Volume)
- 5.2.2.3.5 Price Trend Analysis
- 5.2.2.4 Norway
- 5.2.2.4.1 Production Analysis
- 5.2.2.4.2 Consumption Analysis (Value and Volume)
- 5.2.2.4.3 Import Market Analysis (Value and Volume)
- 5.2.2.4.4 Export Market Analysis (Value and Volume)
- 5.2.2.4.5 Price Trend Analysis
- 5.2.2.5 Sweden
- 5.2.2.5.1 Production Analysis
- 5.2.2.5.2 Consumption Analysis (Value and Volume)
- 5.2.2.5.3 Import Market Analysis (Value and Volume)
- 5.2.2.5.4 Export Market Analysis (Value and Volume)
- 5.2.2.5.5 Price Trend Analysis
- 5.2.2.6 Netherlands
- 5.2.2.6.1 Production Analysis
- 5.2.2.6.2 Consumption Analysis (Value and Volume)
- 5.2.2.6.3 Import Market Analysis (Value and Volume)
- 5.2.2.6.4 Export Market Analysis (Value and Volume)
- 5.2.2.6.5 Price Trend Analysis
- 5.2.3 Asia-Pacific
- 5.2.3.1 China
- 5.2.3.1.1 Production Analysis
- 5.2.3.1.2 Consumption Analysis (Value and Volume)
- 5.2.3.1.3 Import Market Analysis (Value and Volume)
- 5.2.3.1.4 Export Market Analysis (Value and Volume)
- 5.2.3.1.5 Price Trend Analysis
- 5.2.3.2 Japan
- 5.2.3.2.1 Production Analysis
- 5.2.3.2.2 Consumption Analysis (Value and Volume)
- 5.2.3.2.3 Import Market Analysis (Value and Volume)
- 5.2.3.2.4 Export Market Analysis (Value and Volume)
- 5.2.3.2.5 Price Trend Analysis
- 5.2.3.3 Indonesia
- 5.2.3.3.1 Production Analysis
- 5.2.3.3.2 Consumption Analysis (Value and Volume)
- 5.2.3.3.3 Import Market Analysis (Value and Volume)
- 5.2.3.3.4 Export Market Analysis (Value and Volume)
- 5.2.3.3.5 Price Trend Analysis
- 5.2.3.4 Vietnam
- 5.2.3.4.1 Production Analysis
- 5.2.3.4.2 Consumption Analysis (Value and Volume)
- 5.2.3.4.3 Import Market Analysis (Value and Volume)
- 5.2.3.4.4 Export Market Analysis (Value and Volume)
- 5.2.3.4.5 Price Trend Analysis
- 5.2.3.5 India
- 5.2.3.5.1 Production Analysis
- 5.2.3.5.2 Consumption Analysis (Value and Volume)
- 5.2.3.5.3 Import Market Analysis (Value and Volume)
- 5.2.3.5.4 Export Market Analysis (Value and Volume)
- 5.2.3.5.5 Price Trend Analysis
- 5.2.3.6 Myanmar
- 5.2.3.6.1 Production Analysis
- 5.2.3.6.2 Consumption Analysis (Value and Volume)
- 5.2.3.6.3 Import Market Analysis (Value and Volume)
- 5.2.3.6.4 Export Market Analysis (Value and Volume)
- 5.2.3.6.5 Price Trend Analysis
- 5.2.4 South America
- 5.2.4.1 Brazil
- 5.2.4.1.1 Production Analysis
- 5.2.4.1.2 Consumption Analysis (Value and Volume)
- 5.2.4.1.3 Import Market Analysis (Value and Volume)
- 5.2.4.1.4 Export Market Analysis (Value and Volume)
- 5.2.4.1.5 Price Trend Analysis
- 5.2.4.2 Chile
- 5.2.4.2.1 Production Analysis
- 5.2.4.2.2 Consumption Analysis (Value and Volume)
- 5.2.4.2.3 Import Market Analysis (Value and Volume)
- 5.2.4.2.4 Export Market Analysis (Value and Volume)
- 5.2.4.2.5 Price Trend Analysis
- 5.2.5 Africa
- 5.2.5.1 Egypt
- 5.2.5.1.1 Production Analysis
- 5.2.5.1.2 Consumption Analysis (Value and Volume)
- 5.2.5.1.3 Import Market Analysis (Value and Volume)
- 5.2.5.1.4 Export Market Analysis (Value and Volume)
- 5.2.5.1.5 Price Trend Analysis
- 5.2.5.2 Nigeria
- 5.2.5.2.1 Production Analysis
- 5.2.5.2.2 Consumption Analysis (Value and Volume)
- 5.2.5.2.3 Import Market Analysis (Value and Volume)
- 5.2.5.2.4 Export Market Analysis (Value and Volume)
- 5.2.5.2.5 Price Trend Analysis
- 5.2.5.3 Cote d'Ivoire
- 5.2.5.3.1 Production Analysis
- 5.2.5.3.2 Consumption Analysis (Value and Volume)
- 5.2.5.3.3 Import Market Analysis (Value and Volume)
- 5.2.5.3.4 Export Market Analysis (Value and Volume)
- 5.2.5.3.5 Price Trend Analysis
- 5.2.1 North America

