
|
市場調査レポート
商品コード
1685847
アイスクリーム:市場シェア分析、産業動向と統計、成長予測(2025年~2030年)Ice Cream - Market Share Analysis, Industry Trends & Statistics, Growth Forecasts (2025 - 2030) |
||||||
カスタマイズ可能
適宜更新あり
|
|||||||
| アイスクリーム:市場シェア分析、産業動向と統計、成長予測(2025年~2030年) |
|
出版日: 2025年03月18日
発行: Mordor Intelligence
ページ情報: 英文 323 Pages
納期: 2~3営業日
|

全表示
- 概要
- 目次
概要
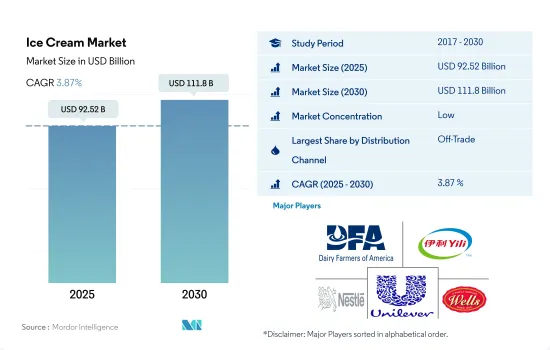
アイスクリームの市場規模は2025年に925億2,000万米ドルと推計され、2030年には1,118億米ドルに達すると予測され、予測期間(2025年~2030年)のCAGRは3.87%で成長します。
組織小売チャネルの強力な浸透が市場成長を後押し
- 世界のアイスクリーム市場の流通チャネルを支配しているのは、非商業部門です。オフ・トレード・セグメントでは、消費者はスーパーマーケットやハイパーマーケットでアイスクリームを購入することを好みます。その結果、オフ・トレード・チャネルはアイスクリーム販売の主要流通チャネルと見なされ、2023年時点で世界全体の売上高の74%以上を占めています。
- コンビニエンスストアは、スーパーマーケット、ハイパーマーケットに次ぐアイスクリームの販売チャネルです。2022年、コンビニエンスストアを通じたアイスクリームの販売額は、2021年比で3.4%増加しました。多くのコンビニエンスストアは従来の小売店よりも長く営業しており、その結果、企業の製品が販売される1日の時間が長くなっています。
- アイスクリームはレストランや外食チャネルで食後のスナックとして消費されるのが一般的で、これが世界のアイスクリーム市場の成長をさらに後押ししています。2022年現在、消費者の47%がレストランで食事とアイスクリームを消費し、消費者の31%がフードサービス・チャネルで食事を注文しています。
- アフリカは、オン・トレード・チャネルを通じたアイスクリームの売上が世界で最も高く、2023年には50%の主要シェアを占めました。この売上を牽引しているのは、同地域における外食志向の強さです。南アフリカとエジプトは、アフリカにおけるオン・トレード・チャネルでのアイスクリーム販売の主要国です。2022年、この2カ国は、同地域のオン・トレード・チャネルを通じたアイスクリーム販売全体のうち、販売量ベースで79%を占めました。2022年には、南アフリカでは350万件の予約があり、国内のレストランで1,780万人が食事をしました。2020年には、パンデミックにもかかわらず、アフリカの人々の約68%が外食に意欲を示しています。
甘い嗜好品への消費者の嗜好の高まりが市場成長を牽引しています。
- 世界のアイスクリーム業界は、2021年と比較して2022年には2.83%の成長を観察しました。この成長は、甘党の消費者が世界的に増加していることに起因しています。2022年、キウイ(ニュージーランド国民)の平均アイスクリーム消費量は28.4リットルでした。米国、オーストラリア、フィンランドの1人当たり消費量は、2022年にそれぞれ20.8リットル、18.0リットル、14.2リットルでした。
- 北米では、プレミアム・アイスクリームとレギュラー・アイスクリームが市場の80%を占めています。2022年には、北米の全人口の16%がチョコレート風味のアイスクリームを好み、クッキーNクリームとバニラがそれに続き、それぞれ13%と12%が好みます。クッキー生地やミント・チョコレート・ディップのようなフレーバーは、人口の11%が好みました。2022年には、37%の消費者がアイスクリームをボウルから出して食べることを好みました。
- 中東では、消費者は商品を便利に保存するために賞味期限を優先します。アイスクリームの賞味期限は長く、温度にもよるが12カ月から24カ月です。中東の消費者は自宅でアイスクリームを消費することを好みます。
- レビュー期間(2017年~2022年)中、アジア太平洋では、中国がなんと43億l相当のアイスクリームを生産し、アイスクリーム業界を支配しました。インド、ベトナム、インドネシアは合計130億相当のアイスクリームを販売しました。インドは2021年に6億5,700万のアイスクリームを販売しました。アイスクリーム業界における技術革新の増加に伴い、こうした製品の需要は予測期間(2025年~2029年)中に拡大すると予想されます。
世界のアイスクリーム市場動向
アイスクリーム・パーラーの強力な普及、多様なフレーバーの入手可能性、贅沢で健康的なデザート・オプションに対する消費者の嗜好が、アイスクリームの消費を促進しています。
- アイスクリームは、世界的に最も広く消費されている乳製品デザートであり、さまざまな国に広く浸透しています。アイスクリームの需要は、さまざまなフレーバーのアイスクリームに対する消費者の高い消費意欲に応えて、アイスクリーム・パーラーやスクープ・ショップが大量に出現していることによって牽引されています。欧州は世界的にアイスクリームの重要な消費国です。2022年には、ドイツ、英国、イタリア、スペインがアイスクリーム消費全体の29.28%を占めています。
- 米国、英国、ドイツ、オーストラリアなどの新興国市場では、健康への関心が高まっています。そのため、この地域の消費者は、遺伝子組み換え作物不使用、防腐剤不使用、乳製品不使用、低カロリー、有機・無脂肪のアイスクリーム製品を好みます。
- アジアのアイスクリーム市場は成長しており、各ブランドは嗜好と健康の観点からアイスクリームの動向に注目しています。例えば、インドにおけるアイスクリームの一人当たり消費量は、2023年から2024年にかけて5.90%増加すると予想されます。飲食品への消費支出の増加、新フレーバーの導入、衝動買いの増加、消費者の健康的なアイスクリーム製品に対する強い需要が、アイスクリームの消費を増加させる主な要因のいくつかです。アジアの消費者の75%は、アイスクリーム製品を購入する際、新しい品種や異なる品種を試すことが多いです。
アイスクリーム業界の概要
アイスクリーム市場は細分化されており、上位5社で29.03%を占めています。この市場の主要企業は以下の通り。 Dairy Farmers of America Inc., Inner Mongolia Yili Industrial Group, Nestle SA, Unilever PLC and Wells Enterprises Inc..
その他の特典
- エクセル形式の市場予測(ME)シート
- 3ヶ月間のアナリストサポート
目次
第1章 エグゼクティブサマリーと主な調査結果
第2章 レポートのオファー
第3章 イントロダクション
- 調査の前提条件と市場定義
- 調査範囲
- 調査手法
第4章 主要産業動向
- 一人当たり消費量
- 原材料/商品生産量
- 牛乳
- 規制の枠組み
- ブラジル
- カナダ
- ドイツ
- イタリア
- 日本
- メキシコ
- 米国
- バリューチェーンと流通チャネル分析
第5章 市場セグメンテーション
- 流通チャネル
- オフ・トレード
- コンビニエンスストア
- オンライン小売
- 専門小売店
- スーパーマーケットとハイパーマーケット
- その他(倉庫クラブ、ガソリンスタンドなど)
- オン・トレード
- オフ・トレード
- 地域
- アフリカ
- 流通チャネル別
- エジプト
- ナイジェリア
- 南アフリカ
- その他のアフリカ
- アジア太平洋
- 流通チャネル別
- オーストラリア
- 中国
- インド
- インドネシア
- 日本
- マレーシア
- ニュージーランド
- パキスタン
- 韓国
- その他のアジア太平洋
- 欧州
- 流通チャネル別
- ベルギー
- フランス
- ドイツ
- イタリア
- オランダ
- ロシア
- スペイン
- トルコ
- 英国
- その他の欧州
- 中東
- 流通チャネル別
- バーレーン
- イラン
- クウェート
- オマーン
- カタール
- サウジアラビア
- アラブ首長国連邦
- その他の中東
- 北米
- 流通チャネル別
- カナダ
- メキシコ
- 米国
- その他の北米
- 南米
- 流通チャネル別
- アルゼンチン
- ブラジル
- その他の南米
- アフリカ
第6章 競合情勢
- 主要な戦略的動き
- 市場シェア分析
- 企業情勢
- 企業プロファイル.
- Blue Bell Creameries LP
- Dairy Farmers of America Inc.
- Inner Mongolia Yili Industrial Group Co. Ltd
- Lotte Corporation
- Nestle SA
- Smith Foods Inc.
- Unilever PLC
- Wells Enterprises Inc.
第7章 CEOへの主な戦略的質問
第8章 付録
- 世界概要
- 概要
- ファイブフォース分析フレームワーク
- 世界のバリューチェーン分析
- 市場力学(DROs)
- 情報源と参考文献
- 図表一覧
- 主要洞察
- データパック
- 用語集
目次
Product Code: 48470
The Ice Cream Market size is estimated at 92.52 billion USD in 2025, and is expected to reach 111.8 billion USD by 2030, growing at a CAGR of 3.87% during the forecast period (2025-2030).
Strong penetration of organized retail channels propelling the market growth.
- The off-trade segment dominates the distribution channels of the global ice cream market. In the off-trade segment, consumers prefer buying ice cream majorly from supermarkets and hypermarkets, as people get discount coupons for bulk shopping in supermarkets. As a result, the off-trade channel is considered the primary distribution channel for the sales of ice cream, with more than 74% of overall sales as of 2023 globally.
- Convenience stores are the second-largest channel for the sales of ice cream after supermarkets and hypermarkets. In 2022, the sales value of ice cream through convenience stores increased by 3.4% compared to 2021. Many convenience stores stay open longer than traditional retail stores, resulting in more time in the day for the companies' products to be sold.
- Ice creams are commonly consumed as after-meal snacks in restaurants and foodservice channels, which is further boosting the global ice cream market growth. As of 2022, 47% of consumers consumed meals and ice cream at restaurants, and 31% of consumers ordered their food from foodservice channels globally.
- Africa had the highest sales of ice cream through on-trade channels globally, accounting for a major share of 50% in 2023. The sales are driven by the strong preference for eating out in the region. South Africa and Egypt are the leading countries in terms of sales of ice cream through on-trade channels in Africa. In 2022, the two countries covered 79% of sales in terms of volume in the total ice cream sales through on-trade channels in the region. In 2022, there were 3.5 million reservations in South Africa, seating 17.8 million diners at restaurants across the country. In 2020, despite the pandemic, around 68% of African people showed a willingness to eat out.
Consumer growing preference towards sweet indulgence driving the market growth.
- The global ice cream industry observed growth of 2.83% in 2022 compared to 2021. The growth was attributed to the rising number of consumers with a sweet tooth globally. In 2022, it was observed that the average Kiwi (People of New Zealand) consumed 28.4 l of ice cream. The United States, Australia, and Finland had a per capita consumption of volume of 20.8 l, 18.0 l, and 14.2 l in 2022, respectively.
- In North America, premium and regular ice cream hold 80% of the market. In 2022, 16% of the total population of North America preferred chocolate-flavored ice cream, followed by cookie N cream and vanilla, preferred by 13% and 12% of the population, respectively. Some flavors, such as cookie dough and mint chocolate dip, were preferred by 11% of the population. In 2022, 37% of consumers preferred eating ice cream out of a bowl.
- In the Middle East, consumers prioritize products' shelf life to store them conveniently. Ice creams have a longer shelf life, ranging from 12 to 24 months, depending on the temperature. Consumers in the Middle East prefer to consume ice cream at home.
- During the review period (2017-2022), in Asia-Pacific, China dominated the ice cream industry with a production of a whopping 4.3 billion l worth of ice cream. India, Vietnam, and Indonesia amassed a total of 13 billion l worth of ice cream sales. India sold 657 million l of ice cream in 2021. With the increased innovation in the ice cream industry, the demand for such products is expected to grow during the forecast period (2025-2029).
Global Ice Cream Market Trends
The strong penetration of ice cream parlors, the availability of diverse flavors, and the consumer preference for indulgent and healthier dessert options are driving the consumption of ice cream.
- Ice cream is the most widely consumed dairy dessert globally, with strong penetration across different countries. The demand for ice cream is driven by the significant number of ice cream parlors and scoop shops emerging in response to the high consumer spending on different flavors of ice creams. Europe is a significant consumer of ice cream globally. In 2022, Germany, the United Kingdom, Italy, and Spain collectively covered 29.28% of the overall ice cream consumption.
- Developed markets like the United States, the United Kingdom, Germany, and Australia are witnessing rising health concerns. Thus, consumers across the region prefer ice cream products that are GMO-free, preservative-free, dairy-free, low in calories, and organic and fat-free.
- The Asian ice cream market is growing, with brands tapping into the ice cream trend from an indulgence and a health perspective. For example, per capita consumption of ice cream in India is expected to increase by 5.90% from 2023-2024. The growing consumer expenditure on food and beverages, the introduction of new flavors, increasing impulse purchasing, and strong demand for healthy ice cream products among consumers are some of the primary factors increasing the consumption of ice cream. 75% of consumers in Asia often try new or different varieties when purchasing ice cream products.
Ice Cream Industry Overview
The Ice Cream Market is fragmented, with the top five companies occupying 29.03%. The major players in this market are Dairy Farmers of America Inc., Inner Mongolia Yili Industrial Group Co. Ltd, Nestle SA, Unilever PLC and Wells Enterprises Inc. (sorted alphabetically).
Additional Benefits:
- The market estimate (ME) sheet in Excel format
- 3 months of analyst support
TABLE OF CONTENTS
1 EXECUTIVE SUMMARY & KEY FINDINGS
2 REPORT OFFERS
3 INTRODUCTION
- 3.1 Study Assumptions & Market Definition
- 3.2 Scope of the Study
- 3.3 Research Methodology
4 KEY INDUSTRY TRENDS
- 4.1 Per Capita Consumption
- 4.2 Raw Material/commodity Production
- 4.2.1 Milk
- 4.3 Regulatory Framework
- 4.3.1 Brazil
- 4.3.2 Canada
- 4.3.3 Germany
- 4.3.4 Italy
- 4.3.5 Japan
- 4.3.6 Mexico
- 4.3.7 United States
- 4.4 Value Chain & Distribution Channel Analysis
5 MARKET SEGMENTATION (includes market size in Value in USD and Volume, Forecasts up to 2030 and analysis of growth prospects)
- 5.1 Distribution Channel
- 5.1.1 Off-Trade
- 5.1.1.1 Convenience Stores
- 5.1.1.2 Online Retail
- 5.1.1.3 Specialist Retailers
- 5.1.1.4 Supermarkets and Hypermarkets
- 5.1.1.5 Others (Warehouse clubs, gas stations, etc.)
- 5.1.2 On-Trade
- 5.1.1 Off-Trade
- 5.2 Region
- 5.2.1 Africa
- 5.2.1.1 By Distribution Channel
- 5.2.1.2 Egypt
- 5.2.1.3 Nigeria
- 5.2.1.4 South Africa
- 5.2.1.5 Rest of Africa
- 5.2.2 Asia-Pacific
- 5.2.2.1 By Distribution Channel
- 5.2.2.2 Australia
- 5.2.2.3 China
- 5.2.2.4 India
- 5.2.2.5 Indonesia
- 5.2.2.6 Japan
- 5.2.2.7 Malaysia
- 5.2.2.8 New Zealand
- 5.2.2.9 Pakistan
- 5.2.2.10 South Korea
- 5.2.2.11 Rest of Asia Pacific
- 5.2.3 Europe
- 5.2.3.1 By Distribution Channel
- 5.2.3.2 Belgium
- 5.2.3.3 France
- 5.2.3.4 Germany
- 5.2.3.5 Italy
- 5.2.3.6 Netherlands
- 5.2.3.7 Russia
- 5.2.3.8 Spain
- 5.2.3.9 Turkey
- 5.2.3.10 United Kingdom
- 5.2.3.11 Rest of Europe
- 5.2.4 Middle East
- 5.2.4.1 By Distribution Channel
- 5.2.4.2 Bahrain
- 5.2.4.3 Iran
- 5.2.4.4 Kuwait
- 5.2.4.5 Oman
- 5.2.4.6 Qatar
- 5.2.4.7 Saudi Arabia
- 5.2.4.8 United Arab Emirates
- 5.2.4.9 Rest of Middle East
- 5.2.5 North America
- 5.2.5.1 By Distribution Channel
- 5.2.5.2 Canada
- 5.2.5.3 Mexico
- 5.2.5.4 United States
- 5.2.5.5 Rest of North America
- 5.2.6 South America
- 5.2.6.1 By Distribution Channel
- 5.2.6.2 Argentina
- 5.2.6.3 Brazil
- 5.2.6.4 Rest of South America
- 5.2.1 Africa
6 COMPETITIVE LANDSCAPE
- 6.1 Key Strategic Moves
- 6.2 Market Share Analysis
- 6.3 Company Landscape
- 6.4 Company Profiles (includes Global Level Overview, Market Level Overview, Core Business Segments, Financials, Headcount, Key Information, Market Rank, Market Share, Products and Services, and Analysis of Recent Developments).
- 6.4.1 Blue Bell Creameries LP
- 6.4.2 Dairy Farmers of America Inc.
- 6.4.3 Inner Mongolia Yili Industrial Group Co. Ltd
- 6.4.4 Lotte Corporation
- 6.4.5 Nestle SA
- 6.4.6 Smith Foods Inc.
- 6.4.7 Unilever PLC
- 6.4.8 Wells Enterprises Inc.
7 KEY STRATEGIC QUESTIONS FOR DAIRY AND DAIRY ALTERNATIVE CEOS
8 APPENDIX
- 8.1 Global Overview
- 8.1.1 Overview
- 8.1.2 Porter's Five Forces Framework
- 8.1.3 Global Value Chain Analysis
- 8.1.4 Market Dynamics (DROs)
- 8.2 Sources & References
- 8.3 List of Tables & Figures
- 8.4 Primary Insights
- 8.5 Data Pack
- 8.6 Glossary of Terms

