
|
市場調査レポート
商品コード
1693998
米国ペット用おやつ:市場シェア分析、産業動向、成長予測(2025~2030年)US Pet Treats - Market Share Analysis, Industry Trends & Statistics, Growth Forecasts (2025 - 2030) |
||||||
カスタマイズ可能
適宜更新あり
|
|||||||
| 米国ペット用おやつ:市場シェア分析、産業動向、成長予測(2025~2030年) |
|
出版日: 2025年03月18日
発行: Mordor Intelligence
ページ情報: 英文 204 Pages
納期: 2~3営業日
|

全表示
- 概要
- 目次
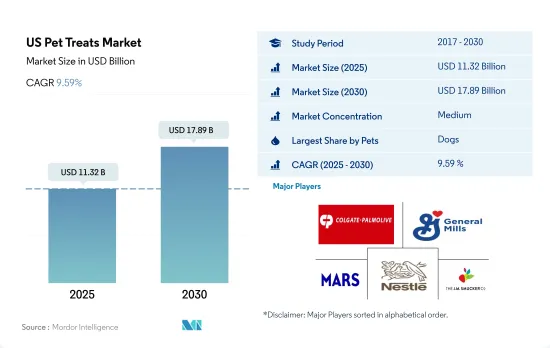
米国のペット用おやつ市場規模は2025年に113億2,000万米ドルと推定され、2030年には178億9,000万米ドルに達すると予測され、予測期間中(2025~2030年)のCAGRは9.59%で成長する見込みです。
犬は歯の病気にかかりやすいため、おやつの主要な消費者であり、これが市場成長の原動力となっています。
- 米国のペット用おやつ市場は、プレミアム製品や天然製品へのシフトが見られます。ペットの飼い主は、高品質の原料を使用し、人工添加物を使用していないおやつを求めるようになっています。この動向を後押ししているのは、ペットの健康全般における栄養の重要性に対する意識の高まりです。
- 米国のペット用おやつ市場は犬が支配的で、2022年の市場金額の約53.4%を占めています。この優位性は主に、他のペットに比べて犬の飼育数が多いことに起因しており、より高級なおやつの需要にシフトしています。犬用ペット用おやつの市場規模は、予測期間中にCAGR 11.2%を記録し、ペットの中で最も急速に成長し、増加すると予測されます。
- 猫は第2位の市場シェアを占め、2022年には市場の約24.9%を占めます。しかし、猫の市場規模が相対的に小さいのは、犬に比べ人口が少ないためと考えられます。同年の米国における猫のペット数は、犬より42.9%少なかりました。したがって、猫のおやつ消費量は犬よりもかなり少ないです。
- 米国のペット数の約34.3%を占めているにもかかわらず、鳥、魚、げっ歯類などのその他のペット動物は2022年の市場の約21.6%にしか寄与していないです。この低いシェアは、ペットのサイズが小さいため、大型のペットに比べて餌の必要量が少ないことに起因しています。しかし、その他の動物は犬や猫に比べて比較的手入れが簡単なため、ペットとしての関心が高まっている
- ペットを飼う人の意識の高まりと国内のペット数の増加が、予測期間中のペット用おやつ市場を牽引すると予想されます。
米国のペット用おやつ市場動向
ミレニアル世代の間でコンパニオンペットとして猫を求める人が増加し、猫の飼育が増加しています。
- 米国では猫の飼育数が増加しています。同国では、コンパニオンとしての需要が高く、他のペットに比べて猫のペットフードへの支出が少ないため、ペットとして猫が採用されています。同国では、ペットの人間化が進み、猫が犬よりも生活するのに必要な面積が少ないことから、2017~2022年にかけてペットとしての猫の採用が10.8%増加しました。例えば米国では、2020年には26%の世帯が猫をペットとして飼っていたが、2022年には53.5%に増加しました。
- 米国では、在宅勤務の文化があるため、ペットとして猫を飼う割合が高く、同伴者の需要が高まり、ペットを飼う人の多くがミレニアル世代になりました。例えば、2022年には、米国ではミレニアル世代がペットの親の33%を占め、2020年には、米国では猫のペット数の40%が動物保護施設から引き取られました。ペットの親は収入の増加によりペットショップから猫を購入。2020年、米国では猫の親の43%がペットショップから猫を購入。同国のペットとしての猫は2020~2022年にかけて4.5%増加。
- 猫を家族の一員として扱うキャットペアレントは、2017~2018年にかけて76%を占めました。そのため、栄養価の高い専用のペットフードが提供されると予想され、ペットフードを含むペット用品の成長に役立つと期待されています。また、人々は愛する人に猫を贈ることもあり、2021年には米国における猫の飼い主の3%を占めています。
- 猫の養子縁組や購入の増加、ペットの人間化の進展といった要因がペット数の増加に役立つと予想され、ペット数の増加は同国のペットフード市場の成長に寄与します。
ペット用おやつへの嗜好の高まり、ペットの人間化の進展、さまざまな流通チャネルを通じたペット用おやつの入手可能性の拡大が、米国のペット支出を促進しています。
- 米国のペット支出は、ここ数年着実に増加しています。同国のペット支出全体は、2021年の1,236億米ドルから2022年には1,368億米ドルへと10.7%増加しました。このペット支出の増加は主に、ペットの人間化の進展、様々な種類のペット用おやつの入手可能性の増加、国内におけるペットフードのプレミアム化の進展に起因しています。
- ペット用おやつへの支出は、2022年のペット1匹当たりの平均ペットフード支出の約26.1%を占めました。同国のペット1匹当たりのペット用おやつへの支出は、2017年の212.4米ドルから2022年には260.7米ドルに増加しました。このペット用おやつへの支出増加は主に、ペット用おやつへの嗜好の高まりとペットの人間化の進展に起因します。ペット動物の中では、犬に対するペット用おやつ支出が最も高く、2022年には犬1匹当たり103.5米ドルと評価されます。次いで猫91.4米ドル、犬65.8米ドルです。一般に、犬の一人当たり消費量は猫のそれよりも高いです。そのため、犬のペット用おやつへの支出は他のペット動物よりも高いです。
- ペットの親は、オンライン小売店、スーパーマーケット、ペットショップを通じてペット用おやつを購入します。専門店やオンライン小売業者を通じたペット用おやつの売上は高く、ペットの親はeコマースプラットフォームで膨大な数のペット用おやつ製品を入手できるためです。パンデミックはオンライン注文の需要を高めました。国内のオンラインチャネルを通じたペット用おやつ販売のシェアは上昇し、2022年にはペット用おやつ市場の18.6%に達しました。高品質フードの利点に対する意識の高まりとペットフード製品のプレミアム化は、同国におけるペット支出を引き続き促進すると予想されます。
米国のペット用おやつ産業概要
米国のペット用おやつ市場は適度に統合されており、上位5社で60.10%を占めています。この市場の主要企業は、Colgate-Palmolive Company(Hill's Pet Nutrition Inc.)、General Mills Inc.、Mars Incorporated、Nestle(Purina)、The J. M. Smucker Companyです。
その他の特典
- エクセル形式の市場予測(ME)シート
- 3ヶ月のアナリストサポート
目次
第1章 エグゼクティブサマリーと主要調査結果
第2章 レポートのオファー
第3章 イントロダクション
- 調査の前提条件と市場定義
- 調査範囲
- 調査手法
第4章 主要産業動向
- ペット数
- 猫
- 犬
- その他
- ペット支出
- 規制の枠組み
- バリューチェーンと流通チャネル分析
第5章 市場セグメンテーション
- サブ製品
- カリカリおやつ
- デンタルトリーツ
- フリーズドライとジャーキートリーツ
- ソフト&チューイートリーツ
- その他のおやつ
- ペット
- 猫
- 犬
- その他
- 流通チャネル
- コンビニエンスストア
- オンラインチャネル
- 専門店
- スーパーマーケット/ハイパーマーケット
- その他のチャネル
第6章 競合情勢
- 主要な戦略動向
- 市場シェア分析
- 企業情勢
- 企業プロファイル
- ADM
- Clearlake Capital Group, L.P.(Wellness Pet Company Inc.)
- Colgate-Palmolive Company(Hill's Pet Nutrition Inc.)
- Dechra Pharmaceuticals PLC
- General Mills Inc.
- Mars Incorporated
- Nestle(Purina)
- Sunshine Mills Inc.
- The J. M. Smucker Company
- Virbac
第7章 CEOへの主要戦略的質問
第8章 付録
- 世界概要
- 概要
- ファイブフォース分析フレームワーク
- 世界のバリューチェーン分析
- 市場力学(DROs)
- 情報源と参考文献
- 図表一覧
- 主要な洞察
- データパック
- 用語集
The US Pet Treats Market size is estimated at 11.32 billion USD in 2025, and is expected to reach 17.89 billion USD by 2030, growing at a CAGR of 9.59% during the forecast period (2025-2030).
Dogs are the major consumers of treats as they are susceptible to dental problems, which is driving market growth
- The US pet treats market witnessed a shift toward premium and natural products. Pet owners are increasingly seeking treats that are made with high-quality ingredients and free from artificial additives. This trend is driven by the rising awareness of the importance of nutrition in pets' overall well-being.
- Dogs dominate the US pet treats market, and they accounted for about 53.4% of the market value in 2022. This dominance is mainly due to the large population of dogs in the country compared to other pets, which has led to a shift in the demand for more premium treats. The market value of pet treats for dogs is anticipated to increase, registering a CAGR of 11.2% during the forecast period, which is the fastest-growing among pets.
- Cats held the second-largest market share, representing about 24.9% of the market in 2022. However, the relatively lower market size for cats can be attributed to their smaller population compared to dogs. In the same year, the population of pet cats in the United States was 42.9% less than that of dogs. Thus, the consumption of treats among cats is considerably lower than that of dogs.
- Despite comprising about 34.3% of the pet population in the United States, other pet animals such as birds, fish, and rodents contributed to only about 21.6% of the market in 2022. This low share can be attributed to their smaller size, resulting in lower food requirements than larger pets. However, there is a growing interest in other animals as pets, as they are relatively low-maintenance compared to dogs and cats.
- The increasing awareness among pet owners and the growing population of pets in the country are expected to drive the pet treats market during the forecast period.
US Pet Treats Market Trends
The increase in people seeking cats as companion pets among millennials is increasing cat adoption in the country
- There is a growth in the cat population in the United States. Cats as pets have been adopted in the country due to the high demand for companionship and less expenditure on pet food for cats than other pets. In the country, the adoption of cats as pets increased by 10.8% between 2017 and 2022 due to a rise in pet humanization and the lesser area cats require to live than dogs. For instance, in the United States, 26% of households owned cats as pets in 2020, which increased to 53.5% in 2022.
- The United States witnessed higher adoption of cats as pets during the pandemic because of the work-from-home culture, leading to a demand for companionship and a higher number of pet owners being millennials. For instance, in 2022, millennials were 33% of pet parents in the United States, and in 2020, 40% of the cat pet population was adopted from animal shelters in the United States. Pet parents purchased cats from pet stores due to growth in income. In 2020, 43% of cat parents in the United States purchased cats from pet stores. Cats as pets in the country increased by 4.5% between 2020 and 2022.
- Cat parents who treat their cats as a part of their family accounted for 76% during 2017-2018. This is expected to help in the growth of pet products, including pet food, as they are anticipated to be provided with nutritious specialized pet food. People also gift cats to their loved ones, and they accounted for 3% of cat owners in the United States in 2021.
- Factors such as an increase in the adoption and purchase of cats and an increase in pet humanization are expected to help in the growth of the pet population, and the rise of the pet population will help in the growth of the pet food market in the country.
Higher preference for treats for pets, increasing pet humanization, and the growing availability of pet treats through various distribution channels are driving the pet expenditure in the United States
- Pet expenditure in the United States has been on a steady increase over the years. The overall pet expenditure in the country increased from USD 123.6 billion in 2021 to USD 136.8 billion in 2022, representing a 10.7% increase in the overall pet expenditure. This rise in pet expenditure is mainly attributed to the growing pet humanization, increased availability of different types of pet treats, and growing pet food premiumization in the country.
- Expenditure on pet treats accounted for about 26.1% of the average pet food expenditure per pet in 2022. The expenditure for pet treats per pet in the country increased from USD 212.4 in 2017 to USD 260.7 in 2022. This increase in pet expenditure on pet treats is mainly attributed to the higher preference for treats for pets and increasing pet humanization. Among pet animals, the pet treats expenditure on dogs is highest, valued at USD 103.5 per dog in 2022. This is followed by cats and dogs, which are valued at USD 91.4 and USD 65.8 in the same year. Generally, the per capita consumption of dogs is higher than that of cats. Thus, the expenditure on pet treats for dogs is higher than other pet animals.
- Pet parents purchase pet treats through online retailers, supermarkets, and pet stores. Pet treat sales through specialty stores and online retailers are high, as pet parents have a vast number of pet treat products available on e-commerce platforms. The pandemic increased the demand for online orders. The share of pet treat sales through online channels in the country increased and reached 18.6% of the pet treats market in 2022. The growing awareness of the benefits of quality food and the premiumization of pet food products are anticipated to continue driving pet expenditure in the country.
US Pet Treats Industry Overview
The US Pet Treats Market is moderately consolidated, with the top five companies occupying 60.10%. The major players in this market are Colgate-Palmolive Company (Hill's Pet Nutrition Inc.), General Mills Inc., Mars Incorporated, Nestle (Purina) and The J. M. Smucker Company (sorted alphabetically).
Additional Benefits:
- The market estimate (ME) sheet in Excel format
- 3 months of analyst support
TABLE OF CONTENTS
1 EXECUTIVE SUMMARY & KEY FINDINGS
2 REPORT OFFERS
3 INTRODUCTION
- 3.1 Study Assumptions & Market Definition
- 3.2 Scope of the Study
- 3.3 Research Methodology
4 KEY INDUSTRY TRENDS
- 4.1 Pet Population
- 4.1.1 Cats
- 4.1.2 Dogs
- 4.1.3 Other Pets
- 4.2 Pet Expenditure
- 4.3 Regulatory Framework
- 4.4 Value Chain & Distribution Channel Analysis
5 MARKET SEGMENTATION (includes market size in Value in USD and Volume, Forecasts up to 2030 and analysis of growth prospects)
- 5.1 Sub Product
- 5.1.1 Crunchy Treats
- 5.1.2 Dental Treats
- 5.1.3 Freeze-dried and Jerky Treats
- 5.1.4 Soft & Chewy Treats
- 5.1.5 Other Treats
- 5.2 Pets
- 5.2.1 Cats
- 5.2.2 Dogs
- 5.2.3 Other Pets
- 5.3 Distribution Channel
- 5.3.1 Convenience Stores
- 5.3.2 Online Channel
- 5.3.3 Specialty Stores
- 5.3.4 Supermarkets/Hypermarkets
- 5.3.5 Other Channels
6 COMPETITIVE LANDSCAPE
- 6.1 Key Strategic Moves
- 6.2 Market Share Analysis
- 6.3 Company Landscape
- 6.4 Company Profiles
- 6.4.1 ADM
- 6.4.2 Clearlake Capital Group, L.P. (Wellness Pet Company Inc.)
- 6.4.3 Colgate-Palmolive Company (Hill's Pet Nutrition Inc.)
- 6.4.4 Dechra Pharmaceuticals PLC
- 6.4.5 General Mills Inc.
- 6.4.6 Mars Incorporated
- 6.4.7 Nestle (Purina)
- 6.4.8 Sunshine Mills Inc.
- 6.4.9 The J. M. Smucker Company
- 6.4.10 Virbac
7 KEY STRATEGIC QUESTIONS FOR PET FOOD CEOS
8 APPENDIX
- 8.1 Global Overview
- 8.1.1 Overview
- 8.1.2 Porter's Five Forces Framework
- 8.1.3 Global Value Chain Analysis
- 8.1.4 Market Dynamics (DROs)
- 8.2 Sources & References
- 8.3 List of Tables & Figures
- 8.4 Primary Insights
- 8.5 Data Pack
- 8.6 Glossary of Terms
