
|
市場調査レポート
商品コード
1911785
シンガポールのフードサービス:市場シェア分析、業界動向と統計、成長予測(2026年~2031年)Singapore Foodservice - Market Share Analysis, Industry Trends & Statistics, Growth Forecasts (2026 - 2031) |
||||||
カスタマイズ可能
適宜更新あり
|
|||||||
| シンガポールのフードサービス:市場シェア分析、業界動向と統計、成長予測(2026年~2031年) |
|
出版日: 2026年01月12日
発行: Mordor Intelligence
ページ情報: 英文 218 Pages
納期: 2~3営業日
|

概要
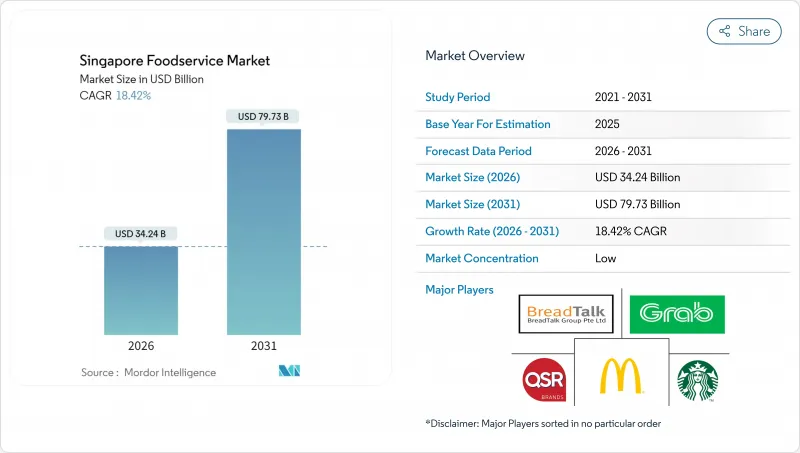
シンガポールのフードサービス市場は、2025年の289億2,000万米ドルから2026年には342億4,000万米ドルへ成長し、2026年から2031年にかけてCAGR18.42%で推移し、2031年までに797億3,000万米ドルに達すると予測されております。
この成長は、観光産業の回復、テクノロジーに精通した人口、デジタル決済システムを推進する強力な政府施策などの要因によって牽引されています。非接触型注文、ロイヤルティプログラム、創造的なメニュー提供などの革新技術を導入する事業者は、顧客一人当たりの平均収益を増加させながら人件費を削減できる可能性が高いです。サービス形態別では、フードデリバリーサービスが従来の店内飲食オプションよりも急速に成長しており、変化する消費者の嗜好を反映しています。フードサービス形態においては、クラウドキッチンがクイックサービスレストラン(QSR)に対する強力な競合として台頭しており、利便性と効率性を提供しています。店舗形態では、チェーン店の拡大にもかかわらず、独立系レストランが堅調さを示しています。ホテルなどの宿泊施設内にある外食施設は、観光業の回復の恩恵を受けています。シンガポールフードサービス市場の競合情勢は依然として厳しい状況です。しかしながら、市場の集中度が低いことから、多国籍企業と地元独立事業者の双方が、独自性のある差別化されたサービスを提供することで、収益性の高い成長の機会を得ています。
シンガポールのフードサービス市場の動向と洞察
スペシャルティ飲料の需要拡大と堅調なコーヒー文化
シンガポールのコーヒー文化は、伝統的なコピティアム(コーヒー店)の遺産から、プレミアムでユニークな体験を求める消費者の関心の高まりを背景に、ダイナミックなスペシャルティ飲料市場へと進化しています。2024年以降、ラッキンコーヒー、ティムホートンズ、コピ・ケナンガンなどの国際ブランドが同市での展開を拡大し、スピード、カスタマイズ、高品質な製品に焦点を当てたデジタルファーストの店舗形態を提供しています。「ホーカーズ・ゴー・デジタル」などの政府プログラムは、モバイル注文やデジタル決済システムの普及を通じて、地元のコーヒー事業者の近代化に重要な役割を果たしてきました。これにより、スペシャルティコーヒーがより幅広い層に親しまれるようになりました。通商産業省によると、シンガポールの飲食品サービス量指数は2023年に4.2%増加し、消費支出の堅調さと活気あるカフェ文化が、フードサービス市場の成長を支え続けていることを示しています。
社交や仕事帰りの集まりへの嗜好の高まり
雇用率の上昇と都市生活のリズムが正常化する中、シンガポールでは社交や仕事帰りの食事体験を好む傾向が強まっています。パンデミック規制の緩和に伴い、柔軟な座席配置やグループ利用に適した空間を提供する飲食店や施設では顧客回転率が向上しており、社交的交流への重視が浮き彫りとなっています。特にミレニアル世代や専門職層を中心とした若年層では、健康志向のライフスタイルに合致しつつ長時間の集まりを楽しめる、低アルコール飲料やノンアルコール飲料への嗜好が高まっています。国際通貨基金(IMF)によれば、シンガポールの雇用率は97.9%に達し、安定した収入を支えるとともに、ストレス解消や楽しみを求めて仕事後の頻繁な外食を後押ししています。スーパーマーケットチェーンはこの動向に対応し、店内バーやカジュアルな飲食スペースを併設することで、食料品の買い物と社交の機会を融合させています。
原材料費の上昇とサプライチェーンの混乱
投入コストの上昇と継続するサプライチェーンの課題は、シンガポールのフードサービスにとって依然として重大な障壁となっています。シンガポール金融管理局の報告によれば、食品インフレ率は2024年12月に2.5%で止まりましたが、同国が輸入食材に依存している状況は、世界の価格変動の影響を受けやすい状態です。地政学的緊張や異常気象といった要因が、小麦、パーム油、魚介類などの主要商品の供給を混乱させ、調達や輸送コストの上昇を招いています。こうした課題は消費者に直接的な影響を与えており、ホーカー(屋台)の食事価格は2008年以来の急騰を記録しました。これは事業者がコストを吸収し、顧客に転嫁せずに済む余地が限られていることを示しています。こうした問題に対処するため、オラム・グループなどのサプライヤーは、サプライチェーンの回復力と透明性の向上を目的とした、トレーサビリティとEUの動物由来食品規制(EUDR)に準拠した調達ソリューションを導入しています。
セグメント分析
シンガポールのフードサービス市場では、店内飲食が2025年時点で市場シェアの65.12%を占め、依然として主要セグメントです。この優位性は、デジタルプラットフォームでは完全には再現できない「美味しい料理」「雰囲気」「社交性」を組み合わせた飲食体験を消費者が好むことを示しています。オーチャードロードやマリーナベイなどの人気エリアを中心に、レストラン、カフェ、カジュアルダイニング店舗は引き続き顧客を惹きつけております。店内飲食体験の向上を図るため、事業者様はテーマ性のある内装、ライブクッキングステーション、シェフ監修メニューなどの導入を進めており、これらが記憶に残る体験の創出とリピート客の促進に寄与しております。
一方、デリバリーは急速に成長するサービスチャネルとなりつつあり、2026年から2031年にかけてCAGR20.10%で収益拡大が見込まれています。利便性と柔軟な食事オプションへの需要増加がこの成長を牽引しており、GrabFoodやFoodpandaといったプラットフォームがこれを支えています。多くの飲食店ではコスト削減と効率化を図るため、クラウドキッチンを導入し、デリバリーアグリゲーターとの提携を進めています。オンラインメニュー、キャッシュレス決済、ロイヤルティプログラムなどのデジタルツールの統合により、顧客のデリバリー体験が向上しています。この変化により、デリバリーはシンガポールの進化するフードサービス市場における成長の主要な推進力として位置づけられています。
クイックサービスレストラン(QSR)はシンガポールのフードサービス市場において重要な位置を占め、2025年には66.88%という大きなシェアを維持しています。これらの飲食店は、標準化されたメニュー、効率的な運営、広範な立地により成功を収めており、お客様に一貫した品質と利便性を提供しています。特に、迅速で手頃な価格の食事を好む多忙な都市部の消費者に人気があります。競争力を維持するため、QSRは期間限定メニューやヘルシーな選択肢など、新たなメニューを定期的に導入し、変化する消費者の嗜好に対応しています。強力なブランド認知度とロイヤルティプログラムにより、これらのレストランは店内飲食とデリバリーサービスの両分野で優位性を保っています。
クラウドキッチンはシンガポールのフードサービス市場において最も急成長している分野の一つとなりつつあり、2026年から2031年にかけてCAGR20.05%で収益が拡大すると予測されています。これらのキッチンは従来の店舗を持たず、共有スペースと資産軽量モデルを活用し、デリバリー業務に完全に特化しています。この手法により、事業者はコストを抑えつつ事業範囲を拡大することが可能となります。オンラインフードデリバリープラットフォームとの提携や、メニュー最適化・マーケティングのためのデジタルツール活用により、クラウドキッチンは効率性と収益性の向上を図っています。利便性を求めてアプリベースの食事オプションを利用する消費者が増える中、クラウドキッチンはシンガポールのフードサービスの未来を形作る上で重要な役割を担う見込みです。
その他の特典:
- エクセル形式の市場予測(ME)シート
- アナリストによる3ヶ月間のサポート
よくあるご質問
目次
第1章 イントロダクション
- 調査の前提条件と市場の定義
- 調査範囲
第2章 調査手法
第3章 エグゼクティブサマリー
第4章 市場情勢
- 市場概要
- 業界動向分析
- 店舗数
- 平均注文金額
- メニュー分析
- 市場促進要因
- 特殊飲料への需要拡大と堅調なコーヒー文化
- 社交や仕事後の集まりに対する嗜好の高まり
- デジタル決済および非接触型取引方法の利用増加
- ユニークな食体験と社会的交流への需要
- 変化する消費者の嗜好とメニュー提供の拡大
- 観光・ホスピタリティ業界の拡大
- 市場抑制要因
- 規制遵守とライセンシングの複雑性への対応における課題
- 労働力不足と高い従業員離職率
- 複数ブランドグループにおける自社ブランド間の競合
- 原材料コストの上昇とサプライチェーンの混乱
- 規制の見通し
- ポーターのファイブフォース
- 新規参入業者の脅威
- 買い手の交渉力
- 供給企業の交渉力
- 代替品の脅威
- 競争企業間の敵対関係
第5章 市場規模と成長予測
- サービスタイプ別
- 店内飲食
- テイクアウト
- デリバリー
- フードサービスタイプ別
- カフェとバー
- 料理別
- バーとパブ
- カフェ
- ジュース・スムージー・デザートバー
- 専門コーヒー・紅茶店
- 料理別
- クラウドキッチン
- フルサービスレストラン
- 料理別
- アジア料理
- 欧州料理
- ラテンアメリカ料理
- 中東料理
- 北米料理
- その他のフルサービスレストラン料理
- 料理別
- クイックサービスレストラン
- 料理別
- ベーカリー
- バーガー
- アイスクリーム
- 肉料理
- ピザ
- その他のクイックサービスレストラン料理
- 料理別
- カフェとバー
- 店舗別
- チェーン店
- 独立店舗
- ロケーション別
- レジャー
- 宿泊施設
- 小売り
- 単独
- 旅行
第6章 競合情勢
- 市場集中度
- 戦略的動向
- 市場シェア分析
- 企業プロファイル
- BreadTalk Group Ltd
- Crystal Jade Culinary Concepts Holding
- DFI Retail Group Holdings Limited
- Doctor's Associates Inc.(Subway)
- Fidelis Express Holdings Pte. Ltd(Pizza Express)
- Foodpanda(Delivery Hero SE)
- Grab Holdings Inc.
- Hanbaobao Pte Ltd(McDonald's)
- Jollibee Foods Corporation
- Nando's Chickenland Singapore Pte Ltd
- Paradise Group Holdings Pte Ltd
- QSR Brands(M)Holdings Sdn Bhd(KFC)
- Restaurant Brands International Inc.
- Sakae Holdings Ltd
- No Signboard Holdings Ltd
- Starbucks Corporation
- Paradise Group
- Tung Lok Restaurants(2000)Ltd
- FairPrice Group(Kopitiam)
- 4Fingers Singapore Pte Ltd.

