
|
市場調査レポート
商品コード
1693431
加工食肉-市場シェア分析、産業動向・統計、成長予測(2025~2030年)Processed Meat - Market Share Analysis, Industry Trends & Statistics, Growth Forecasts (2025 - 2030) |
||||||
カスタマイズ可能
適宜更新あり
|
|||||||
| 加工食肉-市場シェア分析、産業動向・統計、成長予測(2025~2030年) |
|
出版日: 2025年03月18日
発行: Mordor Intelligence
ページ情報: 英文 422 Pages
納期: 2~3営業日
|

全表示
- 概要
- 目次
概要
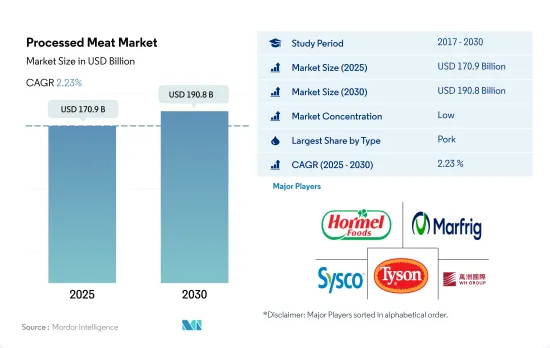
加工食肉市場規模は2025年に1,709億米ドルと推定され、2030年には1,908億米ドルに達すると予測され、予測期間中(2025~2030年)のCAGRは2.23%で成長します。
食肉産業の革新が市場を牽引
- 加工肉は安定した成長を続けています。2017~2022年のCAGRは15.38%を記録しました。最も消費されている加工肉タイプは豚肉加工品です。豚肉を消費しない地域やコミュニティがあるとしても、欧州とアジアでは最も消費されている食肉であり、世界では鶏肉に次いで2番目に消費されています。ランチミート、ホットドッグ、ベーコン、ソーセージ、スモークハム、その他の豚肉加工品が豚肉加工品のカテゴリーを構成しています。様々な人種を考慮すると、豚肉加工品はアフリカ系アメリカ人やヒスパニック系コミュニティの間で特に人気があります。
- マトン肉部門は、予測期間中にCAGR 2.74%を記録し、最も急成長している加工肉部門になると予想されます。羊肉加工肉部門は、より健康的な加工肉を求める消費者の継続的な需要に焦点を当てています。そのアプローチは、塩化ナトリウム、亜硝酸塩、硝酸塩を減らすといった不健康な原料の数を減らすことに重点を置くか、硝酸塩をセロリ粉末のような他の硬化剤に置き換えるといった、健康にプラスの効果をもたらす原料の数を増やすことに重点を置くかのいずれかです。
- 商取引外のチャネルでは、加工食肉は主にスーパーマーケットのような小売店を通じて販売されています。2022年には、豚肉の販売額が食肉販売額全体の63.96%を占め、牛肉は21.31%を占めます。その背景には、世界的に起きている食肉製品のイノベーションがあります。業務用ミート・スナッキングは、ここ数年で大爆発を経験しています。人気を博したミート・スナッキング製品の例としては、マイ・プロテインのビーフ・ビルトン、バイタル・プロテインズの牛レバー、ジムのジャーキー、ザ・ストック・マーチャントのグラスフェッド・ビーフ・ストック、プロテインキックのペペラミ・ビーフバーなどがあります。
国内生産の増加が市場成長を後押し
- 世界の加工食肉の売上は緩やかな成長率で伸びており、2022年の前年比成長率は3.42%でした。調理・加工品、特に加工肉の需要はアジア全域で高まっており、顧客は時間に制約されるようになるにつれ、これらの商品の利便性を受け入れています。2017~2022年にかけて、収益は23.4%上昇しました。各国は食肉製品の小売価格を引き下げるため、国内生産の拡大に注力しています。中国の2022年の豚肉生産量は前年比4.6%増の5,541万トンに達しました。
- 欧州は、加工肉の硬化剤として硝酸塩を使用することの危険性に対する消費者の意識の高まりにより、2022年の市場で2番目に高いシェアを占め、これが欧州諸国におけるベーコンのような亜硝酸塩を含まない加工肉製品の需要を押し上げており、2020~2022年の間に売上高を6.12%押し上げました。加工肉市場は競争が激しく、多くの地域的・国際的競合が存在し、ホーメル・フーズ・コーポレーション、コナグラ・ブランズインク、WHグループ・リミテッドのような企業が独占しています。
- アフリカは、予測期間中のCAGRが4.88%で、最も急成長する地域と予測されます。消費者の間で需要が高まっているため、南アフリカの国内鶏肉供給量は2018年の170万7,000トンから2022年には194万7,000トンに増加し、生産施設や養鶏場への投資により年平均2.80%で成長しています。アフリカの国内生産量は、生産施設や養鶏場への投資により、2017~2022年にかけて13.8%増加しました。さらに、鶏肉はアフリカで2番目に消費される肉であり、1人当たりの消費量は34.79kg/人です。
世界の加工肉市場動向
地域間の生産が需要の伸びを後押ししそうだ
- 牛肉生産量は2017~2022年にかけて6.90%増加しました。USDAの2022年4月の予測によると、2023年の世界の牛肉生産量は1%近く増加して5,960万トンになると予想されています。アルゼンチンの干ばつにより牛群の離散が増え、生産量は前年比6%増加しました。同様に、肥育ストールの大型化と牛のと殺頭数の増加により、米国の生産量は2022年4月から1%増加すると予想されます。ニュージーランドの生産量は、雄の乳用子牛が肉用牛として販売されるようになったため、3%増加します。
- 投入コストが高いため、EUの生産量はと殺頭数の減少と体重の減少により1%減少します。ニュージーランド、オーストラリア、アルゼンチン、ブラジルの展望が上方修正され、メキシコ、英国、EUの展望の減少を相殺しました。中国の旺盛な需要がブラジルとアルゼンチンの供給を引きつけると予想されます。オーストラリアは、日本と韓国の需要増加の恩恵を受けそうです。さらに、米国の加工牛肉に対する旺盛な需要が、オーストラリアとニュージーランドからの供給を押し上げると考えられます。
- 牛肉生産は北米が主流で、2022年には32.13%を生産しました。北米の牛肉生産は、干ばつによる生産コストの上昇と飼料費の増加によって大きな影響を受けました。干ばつは北米西部の産地にも悪影響を与えました。2022年1月1日、カナダの肉牛在庫は5年連続で1%減少し、350万頭に達しました。米国全体の肉牛在庫は前年比2%減の9,190万頭に達しました。南米も世界の牛肉生産に貢献しており、2022年には世界の牛肉生産のほぼ20.12%を生産します。世界の牛肉需要の増加により、生産と生産性の向上が進みました。
地域間の生産不安が価格に影響
- 牛肉の世界平均価格は2017~2022年にかけて9.15%上昇し、米国が6.93米ドル/kgと最も高い価格を占めました。牛肉は世界中で旺盛な需要と高値に直面しており、国際市場力学が目に見えて変化しています。個々の国や地域における干ばつや消費者需要の増加といった地域的な混乱は、今や世界貿易により大きな影響を及ぼしています。
- 牛肉生産上位国の価格を左右する主要因には、米国における需要主導型の牛肉価格高騰があります。米国の牛肉セクタは明らかに需要主導型市場にあり、2022年の価格は2017年比で40.75%上昇しました。ブラジルでは、季節的な雨の遅れにより牛の生産頭数が減少し、加工業者は特に中国市場の需要を考慮して牛の価格を引き上げ、供給を維持せざるを得なくなりました。市場はEU全域で家畜供給の減少に直面し、その結果、家畜部門の収益性が悪化しました。2023年6月の米国における様々な形態の牛肉の小売価格は、挽肉が5.028米ドル/ポンド、牛ロースが7.020米ドル/ポンド、ビーフステーキが10.359米ドル/ポンドでした。
- 中国では、国内牛肉生産量の伸びが鈍化し、アフリカ豚熱の発生時に豚肉から牛肉への代替を促した国内消費量の伸びに追いつけなかったため、2021年と2022年に牛肉の輸入が増加し、これが国内価格の上昇につながりました。豪州の供給は世界市場にも影響を与えました。連続する干ばつと大規模な牛群整理により、豪州の牛の頭数は過去30年間で最低となりました。2021年2月のオーストラリアの若齢牛の価格は、前年比で約20%上昇しました。
加工食肉産業概要
加工食肉市場は細分化されており、上位5社で21.78%を占めています。この市場の主要企業は、Hormel Foods Corporation、Marfrig Global Foods S.A.、Sysco Corporation、Tyson Foods Inc.、WH Group Limitedなどです。
その他の特典
- エクセル形式の市場予測(ME)シート
- 3ヶ月のアナリストサポート
目次
第1章 エグゼクティブサマリーと主要調査結果
第2章 イントロダクション
- 調査の前提条件と市場定義
- 調査範囲
- 調査手法
第3章 主要産業動向
- 価格動向
- 牛肉
- 羊肉
- 豚肉
- 家禽類
- 生産動向
- 牛肉
- 羊肉
- 豚肉
- 家禽類
- 規制の枠組み
- カナダ
- メキシコ
- 米国
- バリューチェーンと流通チャネル分析
第4章 市場セグメンテーション
- タイプ
- 牛肉
- 羊肉
- 豚肉
- 家禽類
- その他の食肉
- 流通チャネル
- オフトレード
- コンビニエンスストア
- オンラインチャネル
- スーパーマーケットとハイパーマーケット
- その他
- オントレード
- オフトレード
- 地域
- アフリカ
- 国別
- エジプト
- ナイジェリア
- 南アフリカ
- その他のアフリカ
- アジア太平洋
- 国別
- オーストラリア
- 中国
- インド
- インドネシア
- 日本
- マレーシア
- 韓国
- その他のアジア太平洋
- 欧州
- 国別
- フランス
- ドイツ
- イタリア
- オランダ
- ロシア
- スペイン
- 英国
- その他の欧州
- 中東
- 国別
- バーレーン
- クウェート
- オマーン
- カタール
- サウジアラビア
- アラブ首長国連邦
- その他の中東
- 北米
- 国別
- カナダ
- メキシコ
- 米国
- その他の北米
- 南米
- 国別
- アルゼンチン
- ブラジル
- その他の南米諸国
- アフリカ
第5章 競合情勢
- 主要な戦略動向
- 市場シェア分析
- 企業情勢
- 企業プロファイル
- BRF S.A.
- Cargill Inc.
- COFCO Corporation
- Conagra Brands Inc.
- Hormel Foods Corporation
- Itoham Yonekyu Holdings, Inc.
- JBS SA
- Marfrig Global Foods S.A.
- OSI Group
- Sysco Corporation
- The Kraft Heinz Company
- Tyson Foods Inc.
- Wen's Food Group Co. Ltd
- WH Group Limited
第6章 CEOへの主要戦略的質問
第7章 付録
- 世界概要
- 概要
- ファイブフォース分析フレームワーク
- 世界のバリューチェーン分析
- 市場力学(DROs)
- 情報源と参考文献
- 図表一覧
- 主要な洞察
- データパック
- 用語集
目次
Product Code: 92490
The Processed Meat Market size is estimated at 170.9 billion USD in 2025, and is expected to reach 190.8 billion USD by 2030, growing at a CAGR of 2.23% during the forecast period (2025-2030).
Innovations in the meat industry drive the market
- Processed meat has been growing at a steady rate. It registered a CAGR of 15.38% from 2017 to 2022. The most consumed processed meat type is processed pork. Even though some communities or regions do not consume pork, it is the most consumed meat in Europe and Asia and the second most consumed worldwide, after poultry. Lunch meats, hot dogs, bacon, sausage, smoked ham, and other processed pork make up the category of processed pork. Considering various ethnicities, processed pork is particularly popular among the African-American and Hispanic communities.
- The mutton meat category is expected to be the fastest-growing processed meat segment, recording a CAGR of 2.74% during the forecast period. The mutton processed meat sector focuses on the ongoing demand of consumers for healthier processed meats. The approaches are either focused on decreasing the number of unhealthy ingredients, such as less sodium chloride, nitrite, and nitrate, or raising the number of ingredients that have positive health effects, such as replacing nitrate with other curing agents, like celery powder.
- In terms of off-trade channels, processed meat products were primarily sold through retail outlets like supermarkets. In 2022, pork sales represented 63.96% of the total value of meat sold, while beef meat contributed 21.31% through the off-trade channel. It is because of innovations in meat products occurring globally. Commercial meat snacking has experienced a massive explosion in the last few years. Some examples of meat-snacking products that have gained popularity include My Protein's beef biltong, Vital Proteins' beef liver, Jim's Jerky, The Stock Merchant's Grass Fed Beef Stock, and Protein Kick's Peperami Beef Bars.
Increased domestic production is propelling the market growth
- Sales for processed meat around the world are growing at a moderate growth rate, which observed a Y-o-Y growth rate of 3.42% in 2022. The demand for prepared and processed goods, especially processed meats, is rising throughout Asia as customers have embraced the convenience of these goods as they become more time-constrained. From 2017 to 2022, revenues climbed by 23.4%. Countries are focusing on increasing domestic production to reduce the retail prices for meat products. China's pork production increased by 4.6% Year-on-Year in 2022, reaching 55.41 million tons, and nearly 700 million pigs were slaughtered.
- Europe held the second highest share in the market in 2022 owing to the growing consumer awareness of the dangers of using nitrate as a curing agent in processed meat, which is driving up demand for nitrite-free processed meat products like bacon in European nations, which boosted sales by 6.12% between 2020 and 2022. The processed meat market is competitive and comprises many regional and international competitors, which are dominated by players like Hormel Foods Corporation, Conagra Brands Inc., and WH Group Limited.
- Africa is projected to be the fastest-growing region with a CAGR of 4.88% by value during the forecasted period. Owing to the rising demand among consumers, the domestic poultry meat supply in South Africa increased from 1,707 thousand tons in 2018 to 1,947 thousand tons in 2022, which is growing at an average annual rate of 2.80% due to investments in production facilities and poultry farms. Domestic production in Africa increased by 13.8% from 2017 to 2022 due to investments in production facilities and poultry farms. Moreover, poultry is the second most consumed meat in Africa, with a per capita consumption of 34.79 kg/capita.
Global Processed Meat Market Trends
Production across regions is likely to boost a growth in demand
- Beef production grew by 6.90% between 2017 and 2022. Global beef production for 2023 is anticipated to increase by nearly 1% to 59.6 million tons, according to USDA's April 2022 forecast. The drought in Argentina has led to more herd break-ups and increased production by 6% compared to the previous year. Similarly, larger fattening stalls and higher slaughter of cows are expected to boost US production by 1% from April 2022. New Zealand production will increase by 3% as male dairy calves are now marketed for beef.
- Due to the high input costs, EU production is cut by 1% due to lower slaughter numbers and lower weights. Upward revisions in forecasts for New Zealand, Australia, Argentina, and Brazil offset declines in forecasts for Mexico, the United Kingdom, and the European Union. Strong demand from China is expected to attract supplies from Brazil and Argentina. Australia is likely to benefit from increasing demand from Japan and South Korea. Additionally, strong US demand for processed beef will boost supplies from Australia and New Zealand.
- Beef production is dominated by North America, which produced 32.13% in 2022. Beef production in North America was highly impacted by the increased production costs and increased feed expenses due to dry conditions. The drought also negatively affected locations in western North America. On January 1, 2022, in Canada, beef cow inventories were down by 1% for the fifth consecutive year, reaching 3.5 million heads. The total US cattle inventories were down by 2% compared to last year, reaching 91.9 million heads. South America also caters to global beef production, producing almost 20.12% of global beef production in 2022. The increased beef demand worldwide increased production and productivity gains.
Production uncertainties across regions are impacting the prices
- The average global price of beef increased by 9.15% between 2017 and 2022, with the United States accounting for the highest price at USD 6.93/kg. Beef has faced strong demand and high prices worldwide, with a visible change in international market dynamics. Local disruptions, such as droughts and increasing consumer demand in individual countries or regions, now exert a greater impact on global trade.
- Key drivers influencing prices in top beef-producing countries include a demand-driven surge in beef prices in the United States. The US beef sector has clearly been in a demand-driven market, witnessing a 40.75% price increase in 2022 compared to 2017. In Brazil, a delay in seasonal rains leads to the production of fewer cattle, forcing processors to raise cattle prices and maintain supply, particularly given demand in the Chinese market. The market faced a reduction in livestock supply across the European Union, resulting in poor profitability of the sector. In June 2023, the retail prices of different forms of beef in the United States were USD 5.028/lb for ground beef, USD 7.020/lb for uncooked beef roasts, and USD 10.359/lb for beef steaks.
- In China, slow growth in domestic beef production, which failed to keep up with local consumption growth prompted by pork-to-beef substitution during the African swine fever outbreak, led to rising beef imports in 2021 and 2022, which, in turn, led to a rise in prices in the country. Australia's supply also impacted the world market, as consecutive years of drought and large herd liquidations resulted in the country's lowest cattle population in 30 years. Australian young stock prices were up by almost 20% in February 2021 compared to the previous year.
Processed Meat Industry Overview
The Processed Meat Market is fragmented, with the top five companies occupying 21.78%. The major players in this market are Hormel Foods Corporation, Marfrig Global Foods S.A., Sysco Corporation, Tyson Foods Inc. and WH Group Limited (sorted alphabetically).
Additional Benefits:
- The market estimate (ME) sheet in Excel format
- 3 months of analyst support
TABLE OF CONTENTS
1 EXECUTIVE SUMMARY & KEY FINDINGS
2 INTRODUCTION
- 2.1 Study Assumptions & Market Definition
- 2.2 Scope of the Study
- 2.3 Research Methodology
3 KEY INDUSTRY TRENDS
- 3.1 Price Trends
- 3.1.1 Beef
- 3.1.2 Mutton
- 3.1.3 Pork
- 3.1.4 Poultry
- 3.2 Production Trends
- 3.2.1 Beef
- 3.2.2 Mutton
- 3.2.3 Pork
- 3.2.4 Poultry
- 3.3 Regulatory Framework
- 3.3.1 Canada
- 3.3.2 Mexico
- 3.3.3 United States
- 3.4 Value Chain & Distribution Channel Analysis
4 MARKET SEGMENTATION (includes market size in Value in USD, Forecasts up to 2030 and analysis of growth prospects)
- 4.1 Type
- 4.1.1 Beef
- 4.1.2 Mutton
- 4.1.3 Pork
- 4.1.4 Poultry
- 4.1.5 Other Meat
- 4.2 Distribution Channel
- 4.2.1 Off-Trade
- 4.2.1.1 Convenience Stores
- 4.2.1.2 Online Channel
- 4.2.1.3 Supermarkets and Hypermarkets
- 4.2.1.4 Others
- 4.2.2 On-Trade
- 4.2.1 Off-Trade
- 4.3 Region
- 4.3.1 Africa
- 4.3.1.1 By Type
- 4.3.1.2 By Distribution Channel
- 4.3.1.3 By Country
- 4.3.1.3.1 Egypt
- 4.3.1.3.2 Nigeria
- 4.3.1.3.3 South Africa
- 4.3.1.3.4 Rest of Africa
- 4.3.2 Asia-Pacific
- 4.3.2.1 By Type
- 4.3.2.2 By Distribution Channel
- 4.3.2.3 By Country
- 4.3.2.3.1 Australia
- 4.3.2.3.2 China
- 4.3.2.3.3 India
- 4.3.2.3.4 Indonesia
- 4.3.2.3.5 Japan
- 4.3.2.3.6 Malaysia
- 4.3.2.3.7 South Korea
- 4.3.2.3.8 Rest of Asia-Pacific
- 4.3.3 Europe
- 4.3.3.1 By Type
- 4.3.3.2 By Distribution Channel
- 4.3.3.3 By Country
- 4.3.3.3.1 France
- 4.3.3.3.2 Germany
- 4.3.3.3.3 Italy
- 4.3.3.3.4 Netherlands
- 4.3.3.3.5 Russia
- 4.3.3.3.6 Spain
- 4.3.3.3.7 United Kingdom
- 4.3.3.3.8 Rest of Europe
- 4.3.4 Middle East
- 4.3.4.1 By Type
- 4.3.4.2 By Distribution Channel
- 4.3.4.3 By Country
- 4.3.4.3.1 Bahrain
- 4.3.4.3.2 Kuwait
- 4.3.4.3.3 Oman
- 4.3.4.3.4 Qatar
- 4.3.4.3.5 Saudi Arabia
- 4.3.4.3.6 United Arab Emirates
- 4.3.4.3.7 Rest of Middle East
- 4.3.5 North America
- 4.3.5.1 By Type
- 4.3.5.2 By Distribution Channel
- 4.3.5.3 By Country
- 4.3.5.3.1 Canada
- 4.3.5.3.2 Mexico
- 4.3.5.3.3 United States
- 4.3.5.3.4 Rest of North America
- 4.3.6 South America
- 4.3.6.1 By Type
- 4.3.6.2 By Distribution Channel
- 4.3.6.3 By Country
- 4.3.6.3.1 Argentina
- 4.3.6.3.2 Brazil
- 4.3.6.3.3 Rest of South America
- 4.3.1 Africa
5 COMPETITIVE LANDSCAPE
- 5.1 Key Strategic Moves
- 5.2 Market Share Analysis
- 5.3 Company Landscape
- 5.4 Company Profiles (includes Global level Overview, Market level overview, Core Business Segments, Financials, Headcount, Key Information, Market Rank, Market Share, Products and Services, and analysis of Recent Developments)
- 5.4.1 BRF S.A.
- 5.4.2 Cargill Inc.
- 5.4.3 COFCO Corporation
- 5.4.4 Conagra Brands Inc.
- 5.4.5 Hormel Foods Corporation
- 5.4.6 Itoham Yonekyu Holdings, Inc.
- 5.4.7 JBS SA
- 5.4.8 Marfrig Global Foods S.A.
- 5.4.9 OSI Group
- 5.4.10 Sysco Corporation
- 5.4.11 The Kraft Heinz Company
- 5.4.12 Tyson Foods Inc.
- 5.4.13 Wen's Food Group Co. Ltd
- 5.4.14 WH Group Limited
6 KEY STRATEGIC QUESTIONS FOR MEAT INDUSTRY CEOS
7 APPENDIX
- 7.1 Global Overview
- 7.1.1 Overview
- 7.1.2 Porter's Five Forces Framework
- 7.1.3 Global Value Chain Analysis
- 7.1.4 Market Dynamics (DROs)
- 7.2 Sources & References
- 7.3 List of Tables & Figures
- 7.4 Primary Insights
- 7.5 Data Pack
- 7.6 Glossary of Terms

