
|
市場調査レポート
商品コード
1692079
北米の加工肉:市場シェア分析、産業動向と統計、成長予測(2025年~2030年)North America Processed Meat - Market Share Analysis, Industry Trends & Statistics, Growth Forecasts (2025 - 2030) |
||||||
カスタマイズ可能
適宜更新あり
|
|||||||
| 北米の加工肉:市場シェア分析、産業動向と統計、成長予測(2025年~2030年) |
|
出版日: 2025年03月18日
発行: Mordor Intelligence
ページ情報: 英文 238 Pages
納期: 2~3営業日
|

全表示
- 概要
- 目次
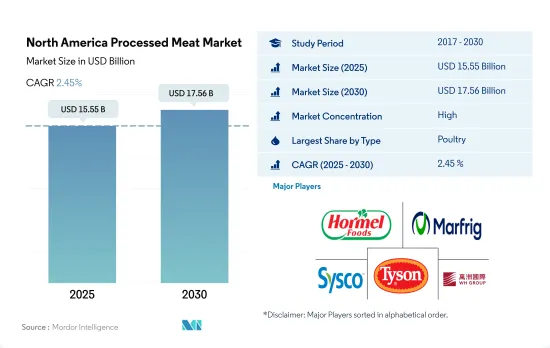
北米の加工肉市場規模は2025年に155億5,000万米ドルと推定され、2030年には175億6,000万米ドルに達し、予測期間中(2025年~2030年)のCAGRは2.45%で成長すると予測されます。
加工肉増産への政府投資が売上を促進
- 加工肉全体の売上高は、2020年から2022年にかけて金額ベースで9.4%増加しました。各社は消費者の関心を得るために製品を革新しています。また、ソーセージ、サラミ、ホットドッグ、ハム、ベーコン、コンビーフなど、品質保持のために保存が効く食肉製品の市場供給も拡大しています。
- 北米加工肉市場のその他の食肉分野には、ロブスター、カニ、カキが含まれます。この分野は2020年から2022年にかけて金額ベースで7.3%の成長を遂げました。手早く食べられる食事への需要の高まりと食肉製造業の成長により、市場は今後数年で拡大すると予測されます。例えば、キューバでは、ロブスター料理が1個買うと1個もらえるキャンペーンを実施しているため、オン・トレード・チャネルではロブスターの売上が高いです。特にハバナでの観光客の増加が、このチャネルを後押ししています。
- 牛肉加工品セグメントは2022年に21.9%の最大の売上シェアを占めたが、これは牛肉加工品の消費量が2022年には26.27kg/人と増加しているためです。予測期間中、農家が使用する有機飼料が市場の成長を牽引するとみられます。消費者の可処分所得の増加と、2021年に34%増加した社会人数が市場を牽引しています。
- 2021年7月、米農務省は、加工肉と鶏肉の生産能力を拡大するため、アメリカン・レスキュー・プランの基金に5億米ドルを投資する意向を発表しました。この投資により、市場は予測期間中、一定の前年比成長率2%を維持するとみられます。米国農務省(USDA)も「米国産」ラベルに関する新規則を発表し、加工肉市場をさらに牽引する可能性があります。
加工施設への投資が成長を後押し
- 北米では、加工肉全体の販売額は2020年から2022年にかけて8.91%増加しました。同地域の消費者の間では、多忙なライフスタイルを背景に、すぐに食べられる肉や調理済みの肉に対する需要が高まっています。保存期間が長く、衛生的に加工・保存された肉などの要因が、北米の加工肉市場の成長を後押ししています。
- 米国は北米で加工肉を消費する主要国です。加工肉全体の販売額は、2021年と比較して2022年には3.42%増加しました。すべての加工肉の中で、加工鶏肉は米国で最も消費されており、2022年の金額で47.6%の主要シェアを占め、加工豚肉が36.54%で続きます。加工肉はスーパーマーケット、コンビニエンスストア、デパート、自動販売機で広く入手可能であり、米国での市場成長をさらに後押ししています。
- メキシコは北米で加工肉の消費が最も急成長している国であり、予測期間中に金額ベースで2.54%のCAGRで推移すると予測されます。メキシコ人は通常、加工肉、特に鶏肉の消費を好みます。このため、メキシコの動物衛生当局は、将来的に鳥インフルエンザ無発生地域の認定を得ることに熱心であり、これが市場の成長を促進すると予想されます。
- さらに、米国の政府機関は米国の農家に利益をもたらすために加工施設に投資しています。例えば、2021年7月、米国農務省は食肉・鶏肉加工施設に5億米ドルを投資し、生産能力を向上させ、農産物市場をより利用しやすくしました。また、市場で競争し消費者層を拡大するために、既存の小規模加工施設に1億5,000万米ドル以上を投資することも発表しました。
北米の加工肉市場の動向
需要の拡大と輸入の減少が生産を押し上げる
- 牛肉市場は、過去一定期間の生産コスト上昇の影響を強く受けました。生産コストの上昇は主に乾燥条件によるものでした。しかし、2022年の同地域の牛肉生産量は2021年と比較して1.25%増加しました。過去数年間の北米西部の干ばつは、この地域の生産に悪影響を与えました。家畜に十分な餌を確保することが困難なため、カナダ西部からメキシコ北部の州まで、家畜を飼育する農家は損失を被っています。家畜に与える飼料を北米の他の地域から購入している農家もあります。
- カナダは米国に次いで北米第2位の牛肉生産国です。2022年の生産シェアはカナダが5.46%、米国が50.15%です。牛群の減少にもかかわらず、生牛の輸入はカナダの食肉生産にプラスの影響を与えます。2022年には、水分レベルが牛の取引を監視する上で極めて重要な要素になると思われます。カナダで干ばつが収まっても米国で干ばつが続けば、より多くの牛が北へ移動するかもしれないです。
- カナダと米国における牛群の減少と子牛の収量の減少により、北米の牛肉供給は長期的に逼迫しています。2022年1月1日、カナダでは肉牛在庫は5年連続で1%減の350万頭となりました。カナダでは農場の61%が47頭未満で、肉牛は59万6,419頭と牛群の16%を占めています。2023年1月1日現在の米国の全牛と子牛の合計は8,930万頭で、2022年1月1日の9,210万頭を3%下回りました。米国は世界最大の肥育牛産業であることに加え、世界最大の牛肉消費国でもあります。
小売需要の増加が牛肉卸売のニーズを押し上げ、市場成長を牽引
- 近年、小売需要の高まりが牛肉卸売のニーズを押し上げ、牛肉価格の上昇につながりました。2021年以降、牛肉小売価格はほぼ安定しており、月次価格の12ヵ月移動平均は2022年4月以降、ポンド当たり7.25米ドルを超えています。2022年の牛肉生産量が過去最高を記録し、国民1人当たりの牛肉消費量が58.9ポンドと2010年以来最大であることを考えると、これは牛肉需要が旺盛であることを示唆しています。2022年の全生鮮牛肉の小売価格は平均でポンド当たり7.30米ドルとなり、これは過去最高価格であり、2021年の価格を5.1%上回りました。テンダーロインとリブロースは前年比12%から15%上昇し、中間肉の価格が引き続き卸売価格を支配しています。
- 小売価格と同様、牛肉卸売価格も2022年の大半は小さなレンジ内で変動しています。3月以降、チョイス牛肉箱詰めの平均価格は261.77米ドル/重量で、週の最高値は272.48米ドル/重量、最低値は246.31米ドル/重量で、幅は26.17米ドル/重量です。非常に旺盛な卸売需要を受け、2021年のチョイスビーフ箱詰め価格は平均279.81米ドル/重量で、週ごとの最高値は347.02米ドル/重量、最低値は206.73米ドル/重量、年間レンジは140.29米ドル/重量でした。
- しかし、加工工場はパンデミック中も2021年も続く労働力不足に苦しみ、流行前と同じペースで食肉を加工する能力が制限されました。このような生産量の減少は、消費者やレストランからの牛肉需要の増加によるもので、そのため価格が上昇しました。地域の労働力不足は2021年も続き、2021年9月の労働力率は61.6%と、2020年1月の63.4%から低下しました。
北米の加工肉産業の概要
北米の加工肉市場はかなり統合されており、上位5社で81.17%を占めています。この市場の主要企業は以下の通り。 Hormel Foods Corporation, Marfrig Global Foods S.A., Sysco Corporation, Tyson Foods Inc. and WH Group Limited(sorted alphabetically).
その他の特典
- エクセル形式の市場予測(ME)シート
- 3ヶ月のアナリスト・サポート
目次
第1章 エグゼクティブサマリーと主な調査結果
第2章 イントロダクション
- 調査の前提条件と市場定義
- 調査範囲
- 調査手法
第3章 主要産業動向
- 価格動向
- 牛肉
- マトン
- 豚肉
- 家禽類
- 生産動向
- 牛肉
- 羊肉
- 豚肉
- 家禽類
- 規制の枠組み
- カナダ
- メキシコ
- 米国
- バリューチェーンと流通チャネル分析
第4章 市場セグメンテーション
- タイプ
- 牛肉
- マトン
- 豚肉
- 家禽類
- その他の食肉
- 流通チャネル
- オフ・トレード
- コンビニエンスストア
- オンライン・チャネル
- スーパーマーケットとハイパーマーケット
- その他
- オン・トレード
- オフ・トレード
- 国名
- カナダ
- メキシコ
- 米国
- その他の北米
第5章 競争情勢
- 主要な戦略動向
- 市場シェア分析
- 企業情勢
- 企業プロファイル
- BRF S.A.
- Continental Grain Company
- Hormel Foods Corporation
- Industrias Bachoco SA de CV
- JBS SA
- Maple Leaf Foods
- Marfrig Global Foods S.A.
- OSI Group
- Sysco Corporation
- Tyson Foods Inc.
- WH Group Limited
第6章 CEOへの主な戦略的質問
第7章 付録
- 世界概要
- 概要
- ファイブフォース分析フレームワーク
- 世界のバリューチェーン分析
- 市場力学(DROs)
- 情報源と参考文献
- 図表一覧
- 主要洞察
- データパック
- 用語集
The North America Processed Meat Market size is estimated at 15.55 billion USD in 2025, and is expected to reach 17.56 billion USD by 2030, growing at a CAGR of 2.45% during the forecast period (2025-2030).
Government investment in increasing processed meat production is propelling sales
- The overall sales for processed meat increased by 9.4% in value terms from 2020 to 2022. Companies are innovating their products to gain consumers' interest. They are also expanding the supply of meat products in the market for items like sausages, salami, hot dogs, ham, bacon, and corned beef, which are frequently preserved to maintain quality.
- The other meat segment of the North American processed meat market includes lobsters, crabs, and oysters. It witnessed a growth of 7.3% in value from 2020 to 2022. With the increasing demand for quick-to-eat meals and the growing meat manufacturing industry, the market is projected to expand in the coming years. For instance, in Cuba, the on-trade channel records high sales of lobsters, as the channel offers a buy 1 get 1 scheme for lobster dishes. The increasing number of tourists, especially in Havana, is boosting the channel.
- The processed beef segment held the largest revenue share of 21.9% in 2022, owing to the increasing consumption of processed beef meat, at 26.27 kg/capita, in 2022. Over the forecast period, the market's growth is likely to be driven by organic feed used by farmers. Increased consumer disposable income and the number of working professionals, which increased by 34% in 2021, have driven the market.
- In July 2021, the USDA announced its intent to invest USD 500 million in the American Rescue Plan's funds to expand the capacities of processed meat and poultry. With this investment, the market is likely to observe a constant Y-o-Y growth rate of 2% during the forecast period. The USDA also issued new rules on "Product of the USA" labels, which may further drive the processed meat market.
Investments in processing facilities to favor the growth
- In North America, the overall sales by value for processed meat increased by 8.91% from 2020 to 2022. There is an increasing demand for ready-to-eat or ready-to-cook meat among consumers across the region, owing to their busy lifestyles. Factors such as long shelf life and hygienically processed and stored meat are boosting the growth of the North American processed meat market.
- The United States is a major country that consumes processed meat in North America. The overall sales value for processed meat increased by 3.42% in 2022 compared to 2021. Of all processed meat, processed poultry is the most consumed in the United States and accounts for the major share of 47.6%, followed by processed pork with 36.54% by value in 2022. Processed meat has wide availability in supermarkets, convenience stores, departmental stores, and vending machines, further driving the market's growth in the United States.
- Mexico is expected to be the fastest-growing country in North America to consume processed meat and is projected to register a CAGR of 2.54% by value during the forecast period. Mexicans usually prefer to consume processed meat, especially poultry. Due to this, Mexican animal health authorities are keen to gain recognition of avian influenza disease-free zones in the future, which is expected to drive the market's growth.
- Moreover, government bodies in the United States are investing in processing facilities to benefit American farmers. For instance, in July 2021, USDA invested USD 500 million in meat and poultry processing facilities to increase capacity and make agricultural markets more accessible. It also announced more than USD 150 million for the existing small processing facilities to compete in the market and increase the consumer base.
North America Processed Meat Market Trends
Growing demand and reduced imports are boosting production
- The beef market was highly impacted by increased production costs during the historical period. The rise in production cost was primarily because of the dry conditions. However, beef production in the region was up by 1.25% in 2022 compared to 2021. Drought in locations throughout western North America during the past few years negatively impacted the region's production. Due to difficulty in locating enough food for their animals, farmers who rear cattle are losing money in regions ranging from western Canada to the states of northern Mexico. Some farmers buy feed for their livestock from other parts of North America.
- Canada is the second-largest beef producer in North America after the United States. The production share of Canada and the United States in 2022 was 5.46% and 50.15%, respectively. Despite a dwindling cow herd, live cattle imports positively affect Canadian meat production. In 2022, moisture levels were likely to be a crucial aspect in monitoring the trading of cattle. More cattle may be moved north if the drought subsides in Canada but continues in the United States.
- The declining cow herd and a smaller calf yield in Canada and the United States are resulting in long-term and tighter beef supplies in North America. On January 1, 2022, in Canada, beef cow inventories were down by 1% for the fifth consecutive year to 3.5 million heads. In Canada, 61% of farms have less than 47 cows, with 596,419 beef cows, 16% of the herd. All cattle and calves in the United States as of January 1, 2023, totaled 89.3 million heads, 3% below the 92.1 million heads on January 1, 2022. In addition to having the world's largest-fed cattle industry, the United States is also the world's largest consumer of beef, primarily high-value, grain-fed beef.
Rising retail demand boosted the need for wholesale beef and drove market growth
- The rising retail demand has boosted the need for wholesale beef in recent years, which led to higher beef prices. Since 2021, retail beef prices have been largely stable, and the 12-month moving average of monthly prices has exceeded USD 7.25 USD per pound since April 2022. Given the record beef production in 2022 and the greatest per-capita beef consumption since 2010, at 58.9 pounds, this suggests a strong beef demand. Retail prices for all fresh beef averaged USD 7.30 per pound in 2022, which was a record-high price and an increase of 5.1% above prices in 2021. Tenderloins and ribeyes are up 12% to 15% Y-o-Y, and middle meat prices continue to dominate wholesale prices.
- Like retail prices, wholesale boxed beef prices have fluctuated within a small range for most of 2022. Since March, Choice boxed beef has had an average price of USD 261.77/cwt, with a weekly high and minimum of 272.48/cwt and USD 246.31/cwt, respectively, for a range of USD 26.17/cwt. Following very strong wholesale demand, Choice boxed beef prices averaged USD 279.81/cwt in 2021, with weekly maximums of USD 347.02/cwt, weekly minimums of USD 206.73/cwt, and annual ranges of USD 140.29/cwt.
- However, processing plants struggled with labor shortages that continued during the pandemic and in 2021, limiting their ability to process meat at the same rate as before the outbreak. This decline in production was due to the increasing demand for beef from consumers and restaurants, thus boosting the prices. The regional labor shortage continued in 2021, with a labor force participation rate of 61.6% in September 2021, down from 63.4% in January 2020.
North America Processed Meat Industry Overview
The North America Processed Meat Market is fairly consolidated, with the top five companies occupying 81.17%. The major players in this market are Hormel Foods Corporation, Marfrig Global Foods S.A., Sysco Corporation, Tyson Foods Inc. and WH Group Limited (sorted alphabetically).
Additional Benefits:
- The market estimate (ME) sheet in Excel format
- 3 months of analyst support
TABLE OF CONTENTS
1 EXECUTIVE SUMMARY & KEY FINDINGS
2 INTRODUCTION
- 2.1 Study Assumptions & Market Definition
- 2.2 Scope of the Study
- 2.3 Research Methodology
3 KEY INDUSTRY TRENDS
- 3.1 Price Trends
- 3.1.1 Beef
- 3.1.2 Mutton
- 3.1.3 Pork
- 3.1.4 Poultry
- 3.2 Production Trends
- 3.2.1 Beef
- 3.2.2 Mutton
- 3.2.3 Pork
- 3.2.4 Poultry
- 3.3 Regulatory Framework
- 3.3.1 Canada
- 3.3.2 Mexico
- 3.3.3 United States
- 3.4 Value Chain & Distribution Channel Analysis
4 MARKET SEGMENTATION (includes market size in Value in USD, Forecasts up to 2030 and analysis of growth prospects)
- 4.1 Type
- 4.1.1 Beef
- 4.1.2 Mutton
- 4.1.3 Pork
- 4.1.4 Poultry
- 4.1.5 Other Meat
- 4.2 Distribution Channel
- 4.2.1 Off-Trade
- 4.2.1.1 Convenience Stores
- 4.2.1.2 Online Channel
- 4.2.1.3 Supermarkets and Hypermarkets
- 4.2.1.4 Others
- 4.2.2 On-Trade
- 4.2.1 Off-Trade
- 4.3 Country
- 4.3.1 Canada
- 4.3.2 Mexico
- 4.3.3 United States
- 4.3.4 Rest of North America
5 COMPETITIVE LANDSCAPE
- 5.1 Key Strategic Moves
- 5.2 Market Share Analysis
- 5.3 Company Landscape
- 5.4 Company Profiles (includes Global level Overview, Market level overview, Core Business Segments, Financials, Headcount, Key Information, Market Rank, Market Share, Products and Services, and analysis of Recent Developments)
- 5.4.1 BRF S.A.
- 5.4.2 Continental Grain Company
- 5.4.3 Hormel Foods Corporation
- 5.4.4 Industrias Bachoco SA de CV
- 5.4.5 JBS SA
- 5.4.6 Maple Leaf Foods
- 5.4.7 Marfrig Global Foods S.A.
- 5.4.8 OSI Group
- 5.4.9 Sysco Corporation
- 5.4.10 Tyson Foods Inc.
- 5.4.11 WH Group Limited
6 KEY STRATEGIC QUESTIONS FOR MEAT INDUSTRY CEOS
7 APPENDIX
- 7.1 Global Overview
- 7.1.1 Overview
- 7.1.2 Porter's Five Forces Framework
- 7.1.3 Global Value Chain Analysis
- 7.1.4 Market Dynamics (DROs)
- 7.2 Sources & References
- 7.3 List of Tables & Figures
- 7.4 Primary Insights
- 7.5 Data Pack
- 7.6 Glossary of Terms

