
|
市場調査レポート
商品コード
1693430
テクスチャード植物性タンパク質:市場シェア分析、産業動向・統計、成長予測(2025~2030年)Textured Vegetable Protein - Market Share Analysis, Industry Trends & Statistics, Growth Forecasts (2025 - 2030) |
||||||
カスタマイズ可能
適宜更新あり
|
|||||||
| テクスチャード植物性タンパク質:市場シェア分析、産業動向・統計、成長予測(2025~2030年) |
|
出版日: 2025年03月18日
発行: Mordor Intelligence
ページ情報: 英文 367 Pages
納期: 2~3営業日
|

全表示
- 概要
- 目次
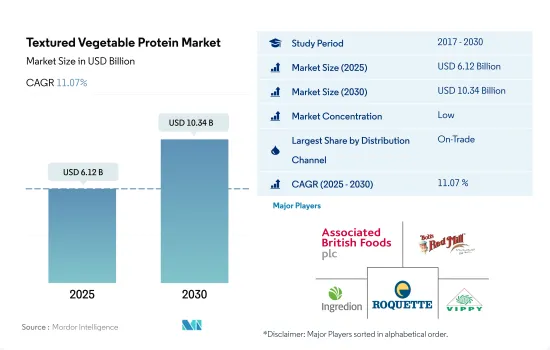
テクスチャード植物性タンパク質の市場規模は2025年に61億2,000万米ドルと推定・予測され、2030年には103億4,000万米ドルに達し、予測期間(2025~2030年)のCAGRは11.07%で成長すると予測されます。
菜食主義の動向がテクスチャード植物性タンパク質のメニューへの浸透を促進しています。
- オンチャネルは、テクスチャード植物性タンパク質の世界販売における最大の流通セグメントです。TVP消費総額の65%近くがこのチャネルを通じて満たされており、予測期間中、より顕著になり、金額で10.8%のCAGRで推移すると予想されます。2021年には、世界中で約7,900万人の菜食主義者がいた。菜食主義の動向は拡大しているが、それでも世界人口の1%に過ぎないです。菜食主義者の数はもっと高いレベルに達すると推定されます。この動向は、より多くのレストランやホテルがヴィーガン食に対応するためにTVPベースの代用肉を提供することに期待し、TVP市場を支えると考えられます。
- オフチャネルは2017~2022年に金額ベースで28.35%の成長を記録したが、これは主にスーパーマーケット/ハイパーマーケットチャネルの開発に起因します。テクスチャード植物性タンパク質の流通チャネルとして世界で最も急成長しているのはオンラインチャネルであり、予測期間中に金額ベースで15.83%のCAGRで推移すると予測されています。オンライン小売業者は、生、冷凍、加工された形で様々なTVPベースの製品を提供するため、消費者の間でより人気があります。
- すぐに調理できる(RTC)とレディトゥイート(RTE)カテゴリーの成長は、オンラインTVPチャネルの主要原動力です。2022年にオンラインチャネルを通じて販売されたTVPは、総販売額のわずか9.10%にすぎないです。この状況は変化し、2029年までにオンラインチャネルは市場全体の13.79%近いシェアを獲得すると予測されています。オンラインチャネルは資本集約的でないため、企業にとってはるかに容易な取引チャネルであり、製品の発売はオフラインの小売セグメントよりもはるかに簡単です。
菜食主義者とベジタリアン人口の増加が市場成長を後押し
- 2022年、欧州はTVPの世界主要市場でした。ヴィーガン食品の市場浸透が進み、欧州人口の間でヴィーガンやフレキシタリアンが増加したことで、同地域では代替肉市場が活況を呈しました。2022年現在、ドイツには約260万人の菜食主義者がおり、ドイツ人口の約3.2%が菜食主義者です。また、ヴィーガンの数は2017~2022年にかけて倍増しています。ドイツのフレキシタリアンたちは、パテ/バーガー、ソーセージ、ひき肉といった形でTVPを摂取することを好むが、それはこれらの製品が動物肉の味と食感を再現しているからです。フレキシタリアン層は、動物福祉に対する懸念から肉の消費を制限しています。
- 中東は、テクスチャード植物性タンパク質の消費に関して最も急成長している地域になると予想されています。予測期間中、金額ベースで11.45%のCAGRで推移すると予測されています。世界人口の大部分が観光目的でアラビア諸国を訪れているため、サウジアラビアやアラブ首長国連邦のような国では代替肉に対する需要が増加しています。中東の人々の間では、健康的なベジタリアン食に対する認識が高まっている
- 北米は世界のテクスチャード植物性タンパク質市場で2番目に高いシェアを占めています。米国はテクスチャード植物性タンパク質の主要市場の一つです。肉の代替食品に対する需要が高まっている背景には、菜食主義を採用したり、フレキシタリアン・ダイエットに転向したりするアメリカ人の数が増え続けていることがあります。米国における大豆の需要を満たすため、2022年には米国で約44億4,000万ブッシェルの大豆が生産され、8,720万エーカー(3,530万ヘクタール)の面積に植えられました。
世界のテクスチャード植物性タンパク質市場動向
TVP価格は、その市場構造の改善により最低限の成長率で推移すると予想される
- テクスチャード植物性タンパク質(TVP)の世界平均価格は、2017~2022年にかけて0.43%成長しました。TVPは主に大企業がブランド肉や肉代替製品を製造するためのテクスチャ剤として購入するため、市場では急な価格変動は見られないです。豆腐やテンペとは異なり、TVPの価格は単一の原料に完全に依存しているわけではないです。大豆、小麦、エンドウ豆の価格も、TVPの価格を決定する上で重要な役割を果たしています。
- TVPは多くの企業によって製造されるコモディティ化した製品となっているため、TVPの需要は今後も増え続けると考えられます。穀物価格と豆類価格の上昇は、TVPの市場均衡に大きな役割を果たしています。例えば、世界平均レベルでは、小麦価格は2019年3月の1kg当たり4.62米ドルから2022年5月には11.78米ドルまで上昇しました。価格上昇の大きな要因のひとつは、ロシアとの戦争により、主要小麦輸出国のひとつであるウクライナからの輸出が突然停止されたことです。この状況は、世界の供給懸念をさらに悪化させました。大豆価格も同様の動向を示し、2020年4月の8.32米ドルから2022年5月には17.32米ドルへと上昇しました。
- 非常に確立された従来型の食肉産業との競合は、植物由来の革新者にとってコスト面での課題となっています。例えば、2019年、オランダでは、ベジタリアン・チキン・カットは100g当たり0.83米ドル、動物性より高かったです。2022年には、ミートレスチキンカットは100gあたり0.13米ドル高いだけです。価格の位置づけとは別に、消費者は製品の味や地元の風味に大きく影響されるため、製品メーカーがこの市場で成功するためには不可欠です。
テクスチャード植物性タンパク質産業概要
テクスチャード植物性タンパク質市場はセグメント化されており、上位5社で4.27%を占めています。この市場の主要企業は、Associated British Foods PLC、Bob's Red Mill Natural Foods、Ingredion Inc.、Roquette Freres、Vippy Industries Ltdなどがあります。
その他の特典
- エクセル形式の市場予測(ME)シート
- 3ヶ月間のアナリストサポート
目次
第1章 エグゼクティブサマリーと主要調査結果
第2章 イントロダクション
- 調査の前提条件と市場定義
- 調査範囲
- 調査手法
第3章 主要産業動向
- 価格動向
- テクスチャード植物性タンパク質
- 規制の枠組み
- カナダ
- フランス
- ドイツ
- イタリア
- メキシコ
- 英国
- 米国
- バリューチェーンと流通チャネル分析
第4章 市場セグメンテーション
- 流通チャネル
- オフトレード
- コンビニエンスストア
- オンラインチャネル
- スーパーマーケットとハイパーマーケット
- その他
- オントレード
- オフトレード
- 地域
- アフリカ
- 流通チャネル別
- 国別
- エジプト
- ナイジェリア
- 南アフリカ
- その他のアフリカ
- アジア太平洋
- 流通チャネル別
- 国別
- オーストラリア
- 中国
- インド
- インドネシア
- 日本
- マレーシア
- 韓国
- その他のアジア太平洋
- 欧州
- 流通チャネル別
- 国別
- フランス
- ドイツ
- イタリア
- オランダ
- ロシア
- スペイン
- 英国
- その他の欧州
- 中東
- 流通チャネル別
- 国別
- バーレーン
- クウェート
- オマーン
- カタール
- サウジアラビア
- アラブ首長国連邦
- その他の中東
- 北米
- 流通チャネル別
- 国別
- カナダ
- メキシコ
- 米国
- その他の北米
- 南米
- 流通チャネル別
- 国別
- アルゼンチン
- ブラジル
- その他の南米地域
- アフリカ
第5章 競合情勢
- 主要な戦略動向
- 市場シェア分析
- 企業情勢
- 企業プロファイル
- AGT Food & Ingredients Inc.
- Associated British Foods PLC
- Bob's Red Mill Natural Foods
- Bunge Limited
- Cargill Inc.
- China Foodstuff & Protein Group Co. Ltd
- CHS Inc.
- Dixie Foods
- Do It Organic
- Ingredion Inc.
- International Flavors & Fragrances Inc.
- MGP Ingredients Inc.
- NOW Health Group, Inc.
- Roquette Freres
- Univar Solutions Inc.
- Vippy Industries Ltd
- Wholesome Provisions Inc.
第6章 CEOへの主要戦略的質問
第7章 付録
- 世界概要
- 概要
- ファイブフォース分析フレームワーク
- 世界のバリューチェーン分析
- 市場力学(DROs)
- 情報源と参考文献
- 図表一覧
- 主要な洞察
- データパック
- 用語集
The Textured Vegetable Protein Market size is estimated at 6.12 billion USD in 2025, and is expected to reach 10.34 billion USD by 2030, growing at a CAGR of 11.07% during the forecast period (2025-2030).
The veganism trend is driving the penetration of textured plant protein on the menu
- The on-trade channel is the largest distribution segment for the global sales of textured vegetable protein. Nearly 65% of the total value of TVP consumption is met through this channel, and it is expected to become more prominent and register a CAGR of 10.8% by value during the forecast period. In 2021, there were around 79 million vegans around the world. While the trend of veganism is growing, it still covers only 1% of the global population. The number of vegans is estimated to reach a much higher level. This trend will support the TVP market as more restaurants and hotels look forward to offering TVP-based meat substitutes to cater to vegan diets.
- The off-trade channel registered a growth of 28.35% by value during 2017-2022, which was majorly attributable to the development of the supermarkets/hypermarkets channel. The fastest-growing channel for the sales of textured vegetable protein worldwide is the online channel, which is projected to register a CAGR of 15.83% by value during the forecast period. Online retailers are more popular among consumers because they offer various TVP-based products in raw, frozen, and processed forms.
- The growth of the ready-to-cook (RTC) and ready-to-eat (RTE) categories is a major driving force for the online TVP channel, as consumers demand such products due to their busy lifestyles. Only 9.10% by value of the total TVP sold was through the online channel in 2022. This situation is expected to change as the online channel is projected to garner nearly 13.79% of the total market share by 2029. The online channel is a much easier trade channel for companies as it is less capital-intensive, and launching a product is much simpler than in the offline retail segment.
Increased vegan and vegetarian populations propelling the market growth
- Europe was the leading market for TVP in the world in 2022. With the growing market penetration of vegan food and the increasing number of vegans and flexitarians among the European population, the market for meat alternatives boomed in the region. There are approximately 2.6 million vegans in Germany as of 2022, and around 3.2% of the German population is vegan. Also, the number of vegans doubled from 2017 to 2022. German flexitarians prefer to consume TVP in the forms of patties/burgers, sausages, and ground meat because these products replicate the taste and texture of animal meat. The flexitarian population is limiting meat consumption due to concerns over animal welfare.
- The Middle East is anticipated to be the fastest-growing region in terms of consuming textured vegetable protein. It is projected to register a CAGR of 11.45% in terms of value during the forecast period. As a huge part of the global population is going to Arabic countries for tourism purposes, there is an increase in the demand for meat alternatives in countries like Saudi Arabia and the United Arab Emirates. There has been a growing perception of healthy vegetarian food options among people in the Middle East.
- North America holds the second-highest share of the global textured vegetable protein market. The United States is one of the key markets for textured vegetable protein. The higher demand for meat alternatives is backed by an ever-increasing number of Americans adopting veganism or turning to flexitarian diets. In order to meet the demand for soybeans in the country, around 4.44 billion bushels of soybeans were produced in the United States in 2022, planted in an area of 87.2 million acres (35.3 million hectares).
Global Textured Vegetable Protein Market Trends
TVP prices are anticipated to grow at a minimum rate owing to its improved market structure
- The average global price of textured vegetable protein (TVP) grew by 0.43% from 2017 to 2022. As TVP is mostly bought by large corporations as a texturant to produce their branded meat and meat substitute products, steep price variations have not been witnessed in the market. Unlike tofu and tempeh, the prices of TVP are not completely dependent on a single raw material. The prices of soybean, wheat, and peas also play key roles in determining the price of TVP.
- The demand for TVP will only continue to increase as it has become a commoditized product manufactured by many companies. The rising grain and legume prices play a huge role in the market equilibrium of TVP. For instance, on average, at the global level, wheat prices rose from USD 4.62 per kg in March 2019 to as high as USD 11.78 per kg in May 2022. One of the major reasons for the rise in prices was the abrupt suspension of exports from Ukraine, one of the major wheat exporters, due to the war with Russia. This situation further exacerbated global supply concerns. Soybean prices also witnessed a similar trend, rising from USD 8.32 in April 2020 to USD 17.32 in May 2022.
- Competition from the very established, conventional meat industry has made costs a challenge for plant-based innovators. For example, in 2019, vegetarian chicken cuts were USD 0.83 more expensive per 100 g in the Netherlands than their animal counterparts. In 2022, meatless chicken cuts were only USD 0.13 more expensive per 100 g. The price differential for ground beef decreased from USD 0.26 to USD 0.06 over the same period. Apart from price positioning, consumers are highly influenced by the product's taste and local flavors, making it essential for product manufacturers to thrive in this market.
Textured Vegetable Protein Industry Overview
The Textured Vegetable Protein Market is fragmented, with the top five companies occupying 4.27%. The major players in this market are Associated British Foods PLC, Bob's Red Mill Natural Foods, Ingredion Inc., Roquette Freres and Vippy Industries Ltd (sorted alphabetically).
Additional Benefits:
- The market estimate (ME) sheet in Excel format
- 3 months of analyst support
TABLE OF CONTENTS
1 EXECUTIVE SUMMARY & KEY FINDINGS
2 INTRODUCTION
- 2.1 Study Assumptions & Market Definition
- 2.2 Scope of the Study
- 2.3 Research Methodology
3 KEY INDUSTRY TRENDS
- 3.1 Price Trends
- 3.1.1 Textured Vegetable Protein
- 3.2 Regulatory Framework
- 3.2.1 Canada
- 3.2.2 France
- 3.2.3 Germany
- 3.2.4 Italy
- 3.2.5 Mexico
- 3.2.6 United Kingdom
- 3.2.7 United States
- 3.3 Value Chain & Distribution Channel Analysis
4 MARKET SEGMENTATION (includes market size in Value in USD, Forecasts up to 2030 and analysis of growth prospects)
- 4.1 Distribution Channel
- 4.1.1 Off-Trade
- 4.1.1.1 Convenience Stores
- 4.1.1.2 Online Channel
- 4.1.1.3 Supermarkets and Hypermarkets
- 4.1.1.4 Others
- 4.1.2 On-Trade
- 4.1.1 Off-Trade
- 4.2 Region
- 4.2.1 Africa
- 4.2.1.1 By Distribution Channel
- 4.2.1.2 By Country
- 4.2.1.2.1 Egypt
- 4.2.1.2.2 Nigeria
- 4.2.1.2.3 South Africa
- 4.2.1.2.4 Rest of Africa
- 4.2.2 Asia-Pacific
- 4.2.2.1 By Distribution Channel
- 4.2.2.2 By Country
- 4.2.2.2.1 Australia
- 4.2.2.2.2 China
- 4.2.2.2.3 India
- 4.2.2.2.4 Indonesia
- 4.2.2.2.5 Japan
- 4.2.2.2.6 Malaysia
- 4.2.2.2.7 South Korea
- 4.2.2.2.8 Rest of Asia-Pacific
- 4.2.3 Europe
- 4.2.3.1 By Distribution Channel
- 4.2.3.2 By Country
- 4.2.3.2.1 France
- 4.2.3.2.2 Germany
- 4.2.3.2.3 Italy
- 4.2.3.2.4 Netherlands
- 4.2.3.2.5 Russia
- 4.2.3.2.6 Spain
- 4.2.3.2.7 United Kingdom
- 4.2.3.2.8 Rest of Europe
- 4.2.4 Middle East
- 4.2.4.1 By Distribution Channel
- 4.2.4.2 By Country
- 4.2.4.2.1 Bahrain
- 4.2.4.2.2 Kuwait
- 4.2.4.2.3 Oman
- 4.2.4.2.4 Qatar
- 4.2.4.2.5 Saudi Arabia
- 4.2.4.2.6 United Arab Emirates
- 4.2.4.2.7 Rest of Middle East
- 4.2.5 North America
- 4.2.5.1 By Distribution Channel
- 4.2.5.2 By Country
- 4.2.5.2.1 Canada
- 4.2.5.2.2 Mexico
- 4.2.5.2.3 United States
- 4.2.5.2.4 Rest of North America
- 4.2.6 South America
- 4.2.6.1 By Distribution Channel
- 4.2.6.2 By Country
- 4.2.6.2.1 Argentina
- 4.2.6.2.2 Brazil
- 4.2.6.2.3 Rest of South America
- 4.2.1 Africa
5 COMPETITIVE LANDSCAPE
- 5.1 Key Strategic Moves
- 5.2 Market Share Analysis
- 5.3 Company Landscape
- 5.4 Company Profiles (includes Global level Overview, Market level overview, Core Business Segments, Financials, Headcount, Key Information, Market Rank, Market Share, Products and Services, and analysis of Recent Developments)
- 5.4.1 AGT Food & Ingredients Inc.
- 5.4.2 Associated British Foods PLC
- 5.4.3 Bob's Red Mill Natural Foods
- 5.4.4 Bunge Limited
- 5.4.5 Cargill Inc.
- 5.4.6 China Foodstuff & Protein Group Co. Ltd
- 5.4.7 CHS Inc.
- 5.4.8 Dixie Foods
- 5.4.9 Do It Organic
- 5.4.10 Ingredion Inc.
- 5.4.11 International Flavors & Fragrances Inc.
- 5.4.12 MGP Ingredients Inc.
- 5.4.13 NOW Health Group, Inc.
- 5.4.14 Roquette Freres
- 5.4.15 Univar Solutions Inc.
- 5.4.16 Vippy Industries Ltd
- 5.4.17 Wholesome Provisions Inc.
6 KEY STRATEGIC QUESTIONS FOR MEAT SUBSTITUTES INDUSTRY CEOS
7 APPENDIX
- 7.1 Global Overview
- 7.1.1 Overview
- 7.1.2 Porter's Five Forces Framework
- 7.1.3 Global Value Chain Analysis
- 7.1.4 Market Dynamics (DROs)
- 7.2 Sources & References
- 7.3 List of Tables & Figures
- 7.4 Primary Insights
- 7.5 Data Pack
- 7.6 Glossary of Terms
