
|
市場調査レポート
商品コード
1692076
米国のテクスチャード植物性タンパク質:市場シェア分析、産業動向・統計、成長予測(2025年~2030年)United States Textured Vegetable Protein - Market Share Analysis, Industry Trends & Statistics, Growth Forecasts (2025 - 2030) |
||||||
カスタマイズ可能
適宜更新あり
|
|||||||
| 米国のテクスチャード植物性タンパク質:市場シェア分析、産業動向・統計、成長予測(2025年~2030年) |
|
出版日: 2025年03月18日
発行: Mordor Intelligence
ページ情報: 英文 181 Pages
納期: 2~3営業日
|

全表示
- 概要
- 目次
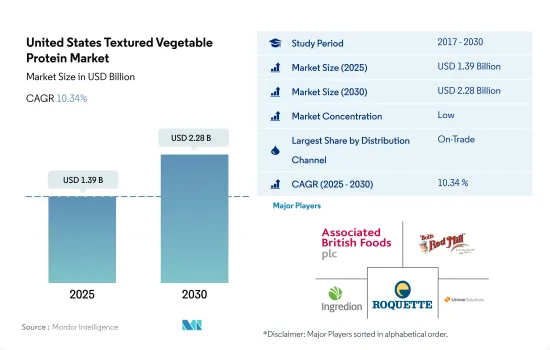
米国のテクスチャード植物性タンパク質市場規模は2025年に13億9,000万米ドルと推定され、2030年には22億8,000万米ドルに達すると予測され、予測期間中(2025-2030年)のCAGRは10.34%で成長します。
全国的な健康志向の高まりが、さまざまな流通チャネルを通じてTVPの需要を促進
- 米国では、テクスチャード植物性タンパク質の販売額は、オフトレード流通チャネルを通じて、2019年から2022年にかけて14.90%の成長率で増加しました。消費者が肉の代替品を探す中、すぐに食べられるTVP製品の需要が高まっています。この地域の学生人口が2022年には1,790万人に達するため、スーパーマーケットの売上は、配達オプションを提供する店舗もあることから増加しました。消費者のニーズに応えるため、スーパーマーケットの数は急速に増加しています。
- オン・トレード・チャネルは、予測期間中にCAGR 9.86%を記録し、最も急成長する流通チャネルになると予測されます。基準年においても主要な流通チャネルであり、2019年から2022年にかけて19.35%の値を記録しました。継続的な需要に対応するため、Beyond Meat、Sysco Corporation、Impossible Foodなどの大手企業は、米国のレストランや外食部門にテクスチャード植物性タンパク質を提供しています。
- 米国のオンライン食料品店の顧客は、宅配よりもクリック・アンド・コレクトを好むようになっています。2022年には、顧客はテクスチャード植物性タンパク質製品を含む約4.4倍の製品を閲覧し、オンライン・サイトに6倍の時間を費やしました。このように、オンライン・チャネルは最も急成長しているチャネルになりつつあり、予測期間中のCAGR値は15.76%を記録すると予測されています。しかし、スーパーマーケットでは、無料チェックアウト、自動課金、より本格的でクリーンラベルの代替肉製品の利用可能性などの高度な技術が、オフトレード・チャネルを通じてTVPの全体的な需要を増加させています。
米国のテクスチャード植物性タンパク質市場動向
植物性食生活の人気の高まりがTVP価格の流入をもたらした
- テクスチャード植物性タンパク質(TVP)価格は2017~2022年に1.92%上昇しました。植物性食品業界に参入する企業が増えたためTVP価格が上昇し、植物性食生活の人気の高まりによりTVPが流入しました。そのため、ブランド間の競合や価格戦略の違いがTVPの価格に影響を与えました。
- 大豆、小麦、トウモロコシ、エンドウ豆の価格もTVPの価格に重要な役割を果たしました。2020年の穀物価格の低迷を緩和する必要性から、TVPの価格は2021年には23.4米ドル/kgに達しました。同様に、大豆価格は2017年の12.04米ドル/kgという高値から2022年には9.40米ドル/kgとなりました。この価格変動は、2019年の天候不順が夏作物の栽培を低下させたためです。同時に、2021年のトウモロコシと大豆のコストはかなり高かったです。2018年のブッシェル当たり25米ドルから9月には33米ドルに25%上昇し、従来型大豆の価格は2021年に7年ぶりの高値に達しました。2021年から2022年にかけて、トウモロコシの平均価格は前年同期比21%上昇し、1ブッシェル当たり5.45米ドルとなりました。
- 価格上昇は消費者にも外食関係者にも影響を及ぼしています。価格の上昇は、食品を購入する際の最大の懸念事項であり、特に主食ではない植物性タンパク質に関してはそうです。買い物行動を変え、より手頃な小売店やブランドを積極的に探す消費者が増えています。ウクライナ戦争、金利、天候パターン、中国の状況はすべて大豆市場に影響を与えます。大豆は現在、史上最高値に近い水準で取引されています。しかし、天候に左右されます。ラニーニャ現象やエルニーニョ現象は、米国産大豆の収量に大きな影響を与えます。ラニーニャとエルニーニョは、70%以上の確率で大豆価格に影響を与えます。
米国のテクスチャード植物性タンパク質産業の概要
米国のテクスチャード植物性タンパク質市場は断片化されており、上位5社で8.90%を占めています。この市場の主要企業は以下の通りです。 Associated British Foods PLC, Bob's Red Mill Natural Foods, Ingredion Inc., Roquette Freres and Univar Solutions Inc.(sorted alphabetically).
その他の特典
- エクセル形式の市場予測(ME)シート
- 3ヶ月のアナリストサポート
目次
第1章 エグゼクティブサマリーと主な調査結果
第2章 イントロダクション
- 調査の前提条件と市場定義
- 調査範囲
- 調査手法
第3章 主要産業動向
- 価格動向
- テクスチャード植物性タンパク質
- 規制の枠組み
- 米国
- バリューチェーンと流通チャネル分析
第4章 市場セグメンテーション
- 流通チャネル
- オフトレード
- コンビニエンスストア
- オンライン・チャネル
- スーパーマーケットとハイパーマーケット
- その他
- オントレード
- オフトレード
第5章 競合情勢
- 主要な戦略動向
- 市場シェア分析
- 企業情勢
- 企業プロファイル
- AGT Food & Ingredients Inc.
- Associated British Foods PLC
- Axiom Foods Inc.
- Bob's Red Mill Natural Foods
- Bunge Limited
- Cargill Inc.
- CHS Inc.
- Dixie Foods
- Ingredion Inc.
- International Flavors & Fragrances Inc.
- MGP Ingredients Inc.
- NOW Health Group, Inc.
- Roquette Freres
- The Scoular Company
- Univar Solutions Inc.
- Wholesome Provisions Inc.
第6章 CEOへの主な戦略的質問
第7章 付録
- 世界概要
- 概要
- ファイブフォース分析フレームワーク
- 世界のバリューチェーン分析
- 市場力学(DROs)
- 情報源と参考文献
- 図表一覧
- 主要洞察
- データパック
- 用語集
The United States Textured Vegetable Protein Market size is estimated at 1.39 billion USD in 2025, and is expected to reach 2.28 billion USD by 2030, growing at a CAGR of 10.34% during the forecast period (2025-2030).
Rising health-conscious consumers across the country drive demand for TVP through various distribution channels
- In the United States, the sales value of textured vegetable protein increased at a growth rate of 14.90% from 2019 to 2022 through the off-trade distribution channel. As consumers search for meat alternatives, ready-to-eat TVP products have been in high demand. With the region's increasing student population hitting 17.9 million in 2022, supermarket sales rose as some stores also offered delivery options. The number of supermarkets is growing rapidly to meet the needs of consumers.
- The on-trade channel is projected to be the fastest-growing distribution channel, registering a CAGR of 9.86% during the forecast period, mainly due to the growing number of vegan restaurants in the country. It was also the major distribution channel in the base year, registering a value of 19.35% from 2019 to 2022. In order to cater to the ongoing demand, major companies such as Beyond Meat, Sysco Corporation, and Impossible Food are providing textured vegetable protein to restaurants and food service sectors in the United States.
- Online grocery customers in the United States have started preferring to click-and-collect over home delivery. In 2022, customers viewed around 4.4 times more products, including textured vegetable protein products, and spent six times more time on online sites. Thus, the online channel is becoming the fastest-growing channel, projected to register a CAGR value of 15.76% during the forecast period. However, the advanced technology at supermarkets, such as free checkout, auto-billing, and the availability of more authentic and clean-label alternative meat products, is increasing the overall demand for TVP through the off-trade channel.
United States Textured Vegetable Protein Market Trends
The growing popularity of plant-based diets has led to an influx of TVP prices
- Textured vegetable protein (TVP) prices increased by 1.92% during 2017-2022. TVP prices increased due to more companies entering the plant-based foods industry, and the growing popularity of plant-based diets led to an influx of TVPs. Thus, the competition among brands and their different pricing strategies influenced the prices of TVPs.
- The prices of soybean, wheat, corn, and peas also played a key role in the prices of TVP. The prices of TVP reached USD 23.4/kg in 2021 due to the need to alleviate the low grain prices in 2020. Similarly, soybean prices went from as high as USD 12.04/kg in 2017 to USD 9.40/kg in 2022. This fluctuation in prices was due to unfavorable weather conditions lowering the cultivation of summer crops in 2019. At the same time, the cost of corn and soybeans was quite high in 2021. With a 25% increase to USD 33 per bushel in September, from USD 25 per bushel in 2018, the price of conventional soybeans reached a seven-year high in 2021. During 2021-2022, the average corn price increased by 21% Y-o-Y to USD 5.45 per bushel.
- Rising prices have affected consumers and food service professionals alike. Rising prices are a top concern in purchasing food products, especially when it comes to plant-based protein, which is not a staple. An increasing number of consumers have altered their shopping behavior and actively look for more affordable retailers and brands. The war in Ukraine, interest rates, weather patterns, and conditions in China all affect the soybean market. Soybean is currently trading at near-record highs. However, it is weather-dependent. La Nina and El Nino patterns are major factors impacting US soybean yields. They affect soybean prices more than 70% of the time.
United States Textured Vegetable Protein Industry Overview
The United States Textured Vegetable Protein Market is fragmented, with the top five companies occupying 8.90%. The major players in this market are Associated British Foods PLC, Bob's Red Mill Natural Foods, Ingredion Inc., Roquette Freres and Univar Solutions Inc. (sorted alphabetically).
Additional Benefits:
- The market estimate (ME) sheet in Excel format
- 3 months of analyst support
TABLE OF CONTENTS
1 EXECUTIVE SUMMARY & KEY FINDINGS
2 INTRODUCTION
- 2.1 Study Assumptions & Market Definition
- 2.2 Scope of the Study
- 2.3 Research Methodology
3 KEY INDUSTRY TRENDS
- 3.1 Price Trends
- 3.1.1 Textured Vegetable Protein
- 3.2 Regulatory Framework
- 3.2.1 United States
- 3.3 Value Chain & Distribution Channel Analysis
4 MARKET SEGMENTATION (includes market size in Value in USD, Forecasts up to 2030 and analysis of growth prospects)
- 4.1 Distribution Channel
- 4.1.1 Off-Trade
- 4.1.1.1 Convenience Stores
- 4.1.1.2 Online Channel
- 4.1.1.3 Supermarkets and Hypermarkets
- 4.1.1.4 Others
- 4.1.2 On-Trade
- 4.1.1 Off-Trade
5 COMPETITIVE LANDSCAPE
- 5.1 Key Strategic Moves
- 5.2 Market Share Analysis
- 5.3 Company Landscape
- 5.4 Company Profiles (includes Global level Overview, Market level overview, Core Business Segments, Financials, Headcount, Key Information, Market Rank, Market Share, Products and Services, and analysis of Recent Developments)
- 5.4.1 AGT Food & Ingredients Inc.
- 5.4.2 Associated British Foods PLC
- 5.4.3 Axiom Foods Inc.
- 5.4.4 Bob's Red Mill Natural Foods
- 5.4.5 Bunge Limited
- 5.4.6 Cargill Inc.
- 5.4.7 CHS Inc.
- 5.4.8 Dixie Foods
- 5.4.9 Ingredion Inc.
- 5.4.10 International Flavors & Fragrances Inc.
- 5.4.11 MGP Ingredients Inc.
- 5.4.12 NOW Health Group, Inc.
- 5.4.13 Roquette Freres
- 5.4.14 The Scoular Company
- 5.4.15 Univar Solutions Inc.
- 5.4.16 Wholesome Provisions Inc.
6 KEY STRATEGIC QUESTIONS FOR MEAT SUBSTITUTES INDUSTRY CEOS
7 APPENDIX
- 7.1 Global Overview
- 7.1.1 Overview
- 7.1.2 Porter's Five Forces Framework
- 7.1.3 Global Value Chain Analysis
- 7.1.4 Market Dynamics (DROs)
- 7.2 Sources & References
- 7.3 List of Tables & Figures
- 7.4 Primary Insights
- 7.5 Data Pack
- 7.6 Glossary of Terms
