
|
市場調査レポート
商品コード
1692059
米国の食肉代替品:市場シェア分析、産業動向、統計、成長予測(2025年~2030年)United States Meat Substitutes - Market Share Analysis, Industry Trends & Statistics, Growth Forecasts (2025 - 2030) |
||||||
カスタマイズ可能
適宜更新あり
|
|||||||
| 米国の食肉代替品:市場シェア分析、産業動向、統計、成長予測(2025年~2030年) |
|
出版日: 2025年03月18日
発行: Mordor Intelligence
ページ情報: 英文 192 Pages
納期: 2~3営業日
|

全表示
- 概要
- 目次
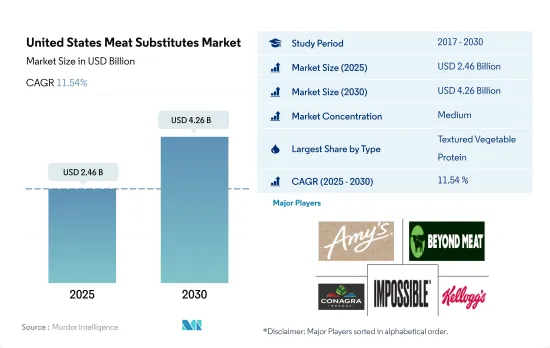
米国の食肉代替品市場規模は2025年に24億6,000万米ドルと推定され、2030年には42億6,000万米ドルに達すると予測され、予測期間中(2025年~2030年)のCAGRは11.54%で成長する見込みです。
米国人の間でのアジア料理人気の高まりが食肉代替品市場を牽引しています。
- 米国における食肉代替品の売上は近年大きく伸びており、2017年から2022年までのCAGRは4.49%を記録しました。売上の伸びは主に、肉の消費に関連する健康問題に対する意識の高まりと、全国のほとんどの流通拠点で植物性タンパク質の代替食品が入手可能になりつつあることに関連しています。米国では2022年に、植物性食品購入者の約69%がビーフスタイルの代替ハンバーガーを購入しています。
- 調査期間中に米国で最も消費された代替肉はテクスチャード・ベジタブル・プロテインでした。TVPは長年にわたり食肉と植物性食品の両方の原材料として使用されてきたが、食肉代替品食品メーカーが最も使用する原材料となりました。TVPの需要増は、パンデミック後の菜食傾向によるもので、2019年から2022年にかけて売上高は10.71%増加しました。TVPは植物ベースの代用肉製造用のテクスチャーとして大企業に購入されることがほとんどであるため、その売上高は今後も増加することが予想され、米国におけるTVPの市場価値は2028年までに推定18億1,000万米ドルに達すると予測されています。
- 豆腐もまた、米国で近年需要が高まっている代替肉です。豆腐の売上高は2017年から2022年にかけて38.05%増加したが、これは大部分、同国におけるアジアをテーマにしたレストランやファーストフードチェーンの増加によるものと考えられます。豆腐はアジア料理の主要な部分であり、外食産業は米国人の間で高まるアジア料理人気に対応しようとしています。アジア料理は急成長している料理のひとつと言われ、米国には38,000軒以上の中華料理店、25,000軒以上の日本料理店、5,000軒以上のタイ料理店があります。
米国の食肉代替品市場動向
大豆価格の上昇でテンペの価格が上昇
- テンペの価格は、主にインフレと大豆価格の上昇に対抗するため、ここ数年徐々に上昇しています。米国におけるテンペの価格は、2017年から2022年にかけて4.86%上昇しました。大豆はテンペの加工に使用される主原料であるため、大豆価格の上昇はセグメント市場価格に影響を与えました。これは、米国政府が大豆貿易に課した25%の関税とも関連しています。テンペ市場には数多くの種類のテンペが存在し、プレーン・テンペは他の付加価値製品に比べ低価格で販売されています。オーガニック・テンペは、現在市場で最も人気のある付加価値テンペであり、20%以上のプレミアム価格で販売されています。企業は、さまざまな用途に対応するため、缶やプラスチックパックなど、さまざまな包装形態で製品を提供しています。
- 2022年の米国の大豆生産量は42億8,000万ブッシェルとなり、2021年比で4%減少しました。1エーカー当たりの推定生産量は49.5ブッシェルで、2021年より2.2ブッシェル減少しました。2021年と比較すると、収穫面積は8,630万エーカーとわずかに増加しました。一方、2023年 5月31日のスポット価格は1ブッシェルあたり1,300セントで、前月同日より10.0%下落しました。2023年5月の農家レベル大豆価格は4.4%下落し、2022年5月より11.0%下落しました。2023年の農家レベル大豆価格の予測レンジは-14.8~8.0%で、下落率は4.8%と予測されました。これはテンペの一時的な価格調整に10~15%の影響を与えると予想されました。
米国の食肉代替品産業概要
米国の食肉代替品市場は適度に統合されており、上位5社で46.27%を占めています。この市場の主要企業は以下の通り。 Amy's Kitchen Inc., Beyond Meat Inc., Conagra Brands Inc., Impossible Foods Inc. and The Kellogg Company(sorted alphabetically).
その他の特典
- エクセル形式の市場予測(ME)シート
- アナリストによる3ヶ月間のサポート
目次
第1章 エグゼクティブサマリーと主な調査結果
第2章 イントロダクション
- 調査の前提条件と市場定義
- 調査範囲
- 調査手法
第3章 主要産業動向
- 価格動向
- テンペ
- テクスチャード・ベジタブル・プロテイン
- 豆腐
- 規制の枠組み
- 米国
- バリューチェーンと流通チャネル分析
第4章 市場セグメンテーション
- タイプ
- テンペ
- テクスチャード・ベジタブル・プロテイン
- 豆腐
- その他の食肉代替品食品
- 流通チャネル
- オフトレード
- コンビニエンスストア
- オンラインチャネル
- スーパーマーケットとハイパーマーケット
- その他
- オン・トレード
- オフトレード
第5章 競合情勢
- 主要な戦略動向
- 市場シェア分析
- 企業情勢
- 企業プロファイル
- Amy's Kitchen Inc.
- Beyond Meat Inc.
- Conagra Brands Inc.
- Hormel Foods Corporation
- Impossible Foods Inc.
- Maple Leaf Foods
- The Campbell Soup Company
- The Hain Celestial Group, Inc.
- The Kellogg Company
- The Kraft Heinz Company
- Wicked Foods, Inc.
第6章 CEOへの主な戦略的質問
第7章 付録
- 世界概要
- 概要
- ファイブフォース分析フレームワーク
- 世界のバリューチェーン分析
- 市場力学(DROs)
- 情報源と参考文献
- 図表一覧
- 主要洞察
- データパック
- 用語集
The United States Meat Substitutes Market size is estimated at 2.46 billion USD in 2025, and is expected to reach 4.26 billion USD by 2030, growing at a CAGR of 11.54% during the forecast period (2025-2030).
The increasing popularity of Asian food among Americans is driving the meat substitutes market
- The sales of meat substitutes in the US have seen sizable progress in recent years, registering a CAGR of 4.49% from 2017 to 2022. The inflation in sales can primarily be linked to the growing awareness regarding health issues related to the consumption of meat and the rising availability of plant-based protein alternatives in most of the distribution points across the country. Approximately 69% of plant-based food buyers purchased beef-style alternative burgers in the United States in 2022.
- The most consumed meat substitute in the United States during the study period was textured vegetable protein. TVP has been used as an ingredient in both meat and plant-based food products for many years but has become the go-to ingredient by meat substitute manufacturers. The rising demand for TVP increased due to the post-pandemic trend of eating vegan food, with sales rising by 10.71% from 2019 to 2022. Since TVP is mostly bought by large corporations as a texture for the production of plant-based meat alternatives, its sales are only expected to rise in the future, with the market value for TVP in the United States projected to reach an estimated USD 1.81 billion by 2028.
- Tofu is another meat substitute that has seen rising demand in the US in recent years. The sales of tofu rose by 38.05% from 2017 to 2022, which could be, for the most part, attributed to the rising number of Asian-themed restaurants and fast-food chains in the country. Tofu is a major part of Asian cuisines, and food service businesses are looking to cater to the increasing popularity of Asian food among Americans. Asian food is said to be one of the fastest-growing cuisines, with the country being home to more than 38,000 Chinese restaurants, 25,000 Japanese restaurants, and 5,000 Thai restaurants.
United States Meat Substitutes Market Trends
Rising soybean prices have resulted in increasing prices of tempeh
- The prices of tempeh have been gradually increasing over the years, mainly to combat inflation and the rising soybean prices. The price of tempeh in the United States grew by 4.86% in 2022 from 2017. Since soybeans are the main ingredient used in the processing of tempeh, the rise in the price of soybeans impacted the segmental market price. This can also be linked to the 25% tariff imposed by the US government on soybean trade. The market has seen the presence of numerous variants of tempeh, with plain tempeh being sold at a lower price compared to other value-added products. Organic tempeh is the most popular value-added tempeh form currently present in the market and is sold at a premium price of more than 20%. Players are offering products in various packaging formats, such as cans and plastic packs, to serve different utilities.
- Soybean prices surged above USD 15.5 per bushel, reaching their highest level since June 2022, driven by mounting concerns over supply shortages as production of soybeans in the United States totaled 4.28 billion bushels in 2022, a 4% decrease from 2021. The estimated production per acre was 49.5 bushels, which was 2.2 bushels less than in 2021. Compared to 2021, the harvested area increased slightly to 86.3 million acres. Meanwhile, on May 31, 2023, the spot price was USD 1,300 cents per bushel, which was down by 10.0% from the same day of the previous month. May 2023 had a 4.4% decline in farm-level soybean prices, which were 11.0% lower than May 2022. The projected range for farm-level soybean prices in 2023 was between -14.8 and 8.0%, with a predicted fall of 4.8%. This was expected to have an impact on the temporary adjustment of the prices of tempeh by 10-15%.
United States Meat Substitutes Industry Overview
The United States Meat Substitutes Market is moderately consolidated, with the top five companies occupying 46.27%. The major players in this market are Amy's Kitchen Inc., Beyond Meat Inc., Conagra Brands Inc., Impossible Foods Inc. and The Kellogg Company (sorted alphabetically).
Additional Benefits:
- The market estimate (ME) sheet in Excel format
- 3 months of analyst support
TABLE OF CONTENTS
1 EXECUTIVE SUMMARY & KEY FINDINGS
2 INTRODUCTION
- 2.1 Study Assumptions & Market Definition
- 2.2 Scope of the Study
- 2.3 Research Methodology
3 KEY INDUSTRY TRENDS
- 3.1 Price Trends
- 3.1.1 Tempeh
- 3.1.2 Textured Vegetable Protein
- 3.1.3 Tofu
- 3.2 Regulatory Framework
- 3.2.1 United States
- 3.3 Value Chain & Distribution Channel Analysis
4 MARKET SEGMENTATION (includes market size in Value in USD, Forecasts up to 2030 and analysis of growth prospects)
- 4.1 Type
- 4.1.1 Tempeh
- 4.1.2 Textured Vegetable Protein
- 4.1.3 Tofu
- 4.1.4 Other Meat Substitutes
- 4.2 Distribution Channel
- 4.2.1 Off-Trade
- 4.2.1.1 Convenience Stores
- 4.2.1.2 Online Channel
- 4.2.1.3 Supermarkets and Hypermarkets
- 4.2.1.4 Others
- 4.2.2 On-Trade
- 4.2.1 Off-Trade
5 COMPETITIVE LANDSCAPE
- 5.1 Key Strategic Moves
- 5.2 Market Share Analysis
- 5.3 Company Landscape
- 5.4 Company Profiles (includes Global level Overview, Market level overview, Core Business Segments, Financials, Headcount, Key Information, Market Rank, Market Share, Products and Services, and analysis of Recent Developments)
- 5.4.1 Amy's Kitchen Inc.
- 5.4.2 Beyond Meat Inc.
- 5.4.3 Conagra Brands Inc.
- 5.4.4 Hormel Foods Corporation
- 5.4.5 Impossible Foods Inc.
- 5.4.6 Maple Leaf Foods
- 5.4.7 The Campbell Soup Company
- 5.4.8 The Hain Celestial Group, Inc.
- 5.4.9 The Kellogg Company
- 5.4.10 The Kraft Heinz Company
- 5.4.11 Wicked Foods, Inc.
6 KEY STRATEGIC QUESTIONS FOR MEAT SUBSTITUTES INDUSTRY CEOS
7 APPENDIX
- 7.1 Global Overview
- 7.1.1 Overview
- 7.1.2 Porter's Five Forces Framework
- 7.1.3 Global Value Chain Analysis
- 7.1.4 Market Dynamics (DROs)
- 7.2 Sources & References
- 7.3 List of Tables & Figures
- 7.4 Primary Insights
- 7.5 Data Pack
- 7.6 Glossary of Terms

