
|
市場調査レポート
商品コード
1692057
北米の代替肉:市場シェア分析、産業動向・統計、成長予測(2025年~2030年)North America Meat Substitutes - Market Share Analysis, Industry Trends & Statistics, Growth Forecasts (2025 - 2030) |
||||||
カスタマイズ可能
適宜更新あり
|
|||||||
| 北米の代替肉:市場シェア分析、産業動向・統計、成長予測(2025年~2030年) |
|
出版日: 2025年03月18日
発行: Mordor Intelligence
ページ情報: 英文 220 Pages
納期: 2~3営業日
|

全表示
- 概要
- 目次
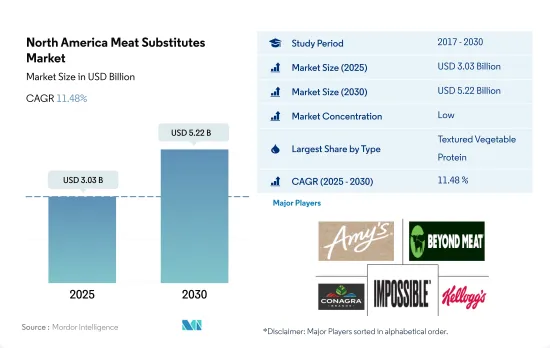
北米の代替肉の市場規模は2025年に30億3,000万米ドルと推定され、2030年には52億2,000万米ドルに達すると予測され、予測期間中(2025-2030年)のCAGRは11.48%で成長する見込みです。
高たんぱく質原料への需要が市場を牽引
- テクスチャード植物性タンパク質は、北米における豆腐市場の収益シェアの大半を占め、2018~2022年の金額で22.98%増加しました。テクスチャードたんぱく質は代替肉に使用される原料のほとんどが植物由来であるため、需要の増加は多くの理由に起因します。16歳から40歳の米国消費者のうち、66%が将来的に植物由来の代用肉により多くの支出を予定しています。食感や風味の良さから、代用肉への需要が高まっています。TVPは、植物性代替肉製造のための食感改良剤として大企業が購入することがほとんどであるため、その売上は今後増加することが予想されます。
- テンペは最も急成長している代替肉です。予測期間(2023~2029年)のCAGRは12.08%を記録すると予測されます。2022年には、米国で推定43億ブッシェルの大豆が生産されました。近年、テンペはインドネシアから米国への主要輸出製品となっています。テンペの需要が高まる中、米国は国内生産量が限られているため、主にインド、カナダ、トルコから大豆を輸入しています。
- この地域の代替肉は、主に非商業流通チャネルを通じて消費されています。市場セグメンテーションは予測期間中10.42%のCAGRで推移すると予測されます。スーパーマーケットやハイパーマーケットでは、大幅な割引や特売、大量購入が可能なため、そこでの買い物は費用対効果が高いと見られています。2022年には、米国の約10世帯のうち6世帯が植物ベースの食品を購入しています。スーパーマーケットがこの市場で優位を占めているのは、多種多様なブランドを提供し、棚面積が広く、値下げを頻繁に実施しているからです。
植物ベースの食品に対する政府投資の増加が市場の成長を牽引しています。
- 米国は北米における植物ベース製品の主要市場です。また予測期間中、金額ベースで最も速いCAGR 10.53%を記録すると予測されています。需要の高まりは、購買力の向上と健康・環境意識の高まりによるものです。アメリカの消費者は新製品を試すことに積極的であるため、絶え間ない製品の発売が、同国での植物性製品の販売を促進する主な要因のひとつとなっています。
- カナダは代替肉市場において第2位の市場です。政府の支援が、同国における植物性製品の売上を押し上げている主な要因です。カナダ政府は植物性食品を重要な成長産業と位置づけ、2021年にはその開発に1億5,000万米ドルを投資しました。カナダの代用肉市場は、予測期間中に数量ベースで10.36%のCAGRで推移する見込みです。
- この地域では近年、代替肉製品の数が急増しています。投資家は最近、代替たんぱく質の新興企業に111億米ドル以上を投資しています。顧客の需要と豊富な投資が研究開発に有利な環境を育み、より多くの新興企業や大手食品企業が植物由来の様々な代替食肉を提供しています。Bloom8、Precision Capital、CPT Capitalのような新しい投資家は、Impossible Foods、Beyond Meat、Upside Foodsのような代替肉の新興企業に投資しています。
- 健康への懸念が市場拡大を後押しし、テクスチャードベジタブル・プロテインによる様々な健康効果が市場成長を促進します。米国だけを見ても、2022年には前年比で約65%の消費者が植物性代替食品を消費しています。北米では約61%の消費者が健康上の懸念から代替肉に切り替えています。
北米の代替肉市場動向
同地域のテンペ価格は世界の大豆市場に大きく左右される
- テンペの価格は、主にインフレと大豆価格の上昇に対抗するため、数年かけて徐々に上昇しました。テンペの価格は2017年から2022年にかけて3.94%上昇しました。大豆はテンペの製造に使用される主原料であるため、世界市場における大豆コストの上昇がテンペ価格の上昇にほぼ寄与しています。生産コストと原材料コストの上昇に伴い、地域のメーカーは他の生産国の施設から輸入するか、別のメーカーと提携しています。
- テンペの価格は、メキシコとカナダでは比較的同程度で、米国よりも50%近く安いです。市場には数多くの種類のテンペが存在し、プレーン・テンペは他の付加価値製品に比べ低価格で販売されています。オーガニック・テンペは、現在市場で最も人気のある付加価値テンペであり、プレミアム価格で販売されています。プレーヤーは、様々な用途に対応するため、缶やプラスチックパックなど様々な包装形態で製品を提供しています。
- テンペの価格は北米の大豆価格に直結しており、市場の将来は大豆価格に大きく左右されます。2023年の大豆価格は、供給量の増加が見込まれ、見通しが下降傾向にあるため、5月に弱含みとなりました。2023年5月の平均価格は1ブッシェルあたり1,369セントで、4月の価格を8.0%下回り、前年同月比でも17.6%下落しました。一方、2023年 5月31日のスポット価格は1ブッシェル当たり1,300セントで、前月同日比10.0%下落しました。中国における通関検査の厳格化、おそらく国内大豆生産の需要を支えるための政府の動き、および中国の予想を下回る経済データが、調査期間中の市場価格をさらに押し下げると予想されます。
北米の代替肉産業の概要
北米の肉代替品市場は断片化されており、上位5社で36.85%を占めています。この市場の主要企業は以下の通りです。 Amy's Kitchen Inc., Beyond Meat Inc., Conagra Brands Inc., Impossible Foods Inc. and The Kellogg Company(sorted alphabetically).
その他の特典
- エクセル形式の市場予測(ME)シート
- 3ヶ月のアナリストサポート
目次
第1章 エグゼクティブサマリーと主な調査結果
第2章 イントロダクション
- 調査の前提条件と市場定義
- 調査範囲
- 調査手法
第3章 主要産業動向
- 価格動向
- テンペ
- テクスチャード植物性タンパク質
- 豆腐
- 規制の枠組み
- カナダ
- メキシコ
- 米国
- バリューチェーンと流通チャネル分析
第4章 市場セグメンテーション
- タイプ
- テンペ
- テクスチャード植物性タンパク質
- 豆腐
- その他の代替肉
- 流通チャネル
- オフトレード
- コンビニエンスストア
- オンラインチャネル
- スーパーマーケットとハイパーマーケット
- その他
- オントレード
- オフトレード
- 国
- カナダ
- メキシコ
- 米国
- その他北米地域
第5章 競争情勢
- 主要な戦略動向
- 市場シェア分析
- 企業情勢
- 企業プロファイル
- Amy's Kitchen Inc.
- Associated British Foods PLC
- Beyond Meat Inc.
- Cargill Inc.
- Conagra Brands Inc.
- Hormel Foods Corporation
- Impossible Foods Inc.
- International Flavors & Fragrances Inc.
- Maple Leaf Foods
- Nestle S.A.
- The Campbell Soup Company
- The Kellogg Company
第6章 CEOへの主な戦略的質問
第7章 付録
- 世界概要
- 概要
- ファイブフォース分析フレームワーク
- 世界のバリューチェーン分析
- 市場力学(DROs)
- 情報源と参考文献
- 図表一覧
- 主要洞察
- データパック
- 用語集
The North America Meat Substitutes Market size is estimated at 3.03 billion USD in 2025, and is expected to reach 5.22 billion USD by 2030, growing at a CAGR of 11.48% during the forecast period (2025-2030).
Demand for high-protein ingredients is driving the market
- Textured vegetable proteins accounted for the majority of the tofu market's revenue share in North America, with a 22.98% increase in value over 2018-2022. The increasing demand can be attributed to many reasons, as most of the ingredients used to make textured protein meat substitutes come from plant sources. Of US consumers aged between 16 and 40 years, 66% plan to spend more on plant-based meat alternatives in the future. The demand for meat substitutes is increasing due to their texture and flavor. Since TVP is mostly bought by large corporations as a texturant for the production of plant-based meat alternatives, its sales are only expected to rise in the future.
- Tempeh is the fastest-growing meat substitute type. It is projected to record a CAGR of 12.08% during the forecast period (2023-2029). In 2022, an estimated 4.3 billion bushels of soybeans were produced in the United States. In recent years, tempeh has become a key export product from Indonesia to the United States. With the rising demand for tempeh, the United States imports soybeans primarily from India, Canada, and Turkey due to the limited local output.
- Meat substitutes in the region are consumed majorly through the off-trade distribution channel. Supermarkets hold the major share of the market among all other off-trade segments, and the segment is projected to record a value CAGR of 10.42% during the forecast period. Owing to the significant discounts, specials, and bulk purchasing available at supermarkets and hypermarkets, shopping there is seen to be more cost-effective. Around 6 in 10 US households purchased plant-based foods in 2022. Supermarkets are dominant in the market because they offer a large variety of brands, have a large amount of shelf space, and frequently run price reductions.
Increased government investments in plant-based foods are driving the market's growth
- The United States is the leading market for plant-based products in North America. It is also projected to record the fastest CAGR of 10.53% by value during the forecast period. The higher demand is due to the higher purchasing power and surging health and environmental awareness. Constant product launches are among the key factors promoting the sales of plant-based products in the country, as American consumers are highly open to trying new products.
- Canada is the second-leading market for meat substitutes. Governmental support is the primary factor boosting the sales of plant-based products in the country. The Government of Canada identified plant-based foods as an important and growing industry and invested USD 150 million in its development in 2021. The Canadian meat substitute market is expected to register a CAGR of 10.36% by volume during the forecast period.
- There has been an upsurge in the number of alternative meat products in the region in recent years. Investors have recently invested more than USD 11.1 billion in alternative protein startups. Customer demand and abundant investment have fostered a favorable environment for research and development, with more startups and major food corporations offering a variety of plant-based meat alternatives. New investors like Bloom8, Precision Capital, and CPT Capital have invested in alternative meat startups like Impossible Foods, Beyond Meat, and Upside Foods.
- Concerns about health fuel market expansion and various health benefits from textured vegetable protein promote market growth. In the United States alone, around 65% of consumers consumed plant-based alternatives in 2022 compared to the previous year. Approximately 61% of consumers in North America have switched to meat alternatives due to health concerns.
North America Meat Substitutes Market Trends
Tempeh prices in the region are highly dependent on the global soybean market
- Tempeh prices gradually increased over the years, mainly to combat inflation and rising soybean prices. The price of tempeh grew by 3.94% in 2022 from 2017. Since soybeans are the main ingredient used to make tempeh, the rising cost of soybeans in the global market is mostly contributing to increasing tempeh prices. With the rising production and raw material costs, regional manufacturers either import from their facilities in other producing countries or partner with a different manufacturer.
- Prices of tempeh are comparatively similar in Mexico and Canada, which is almost 50% less than in the United States. The market has seen the presence of numerous variants of tempeh, with plain tempeh being sold at a lower price compared to other value-added products. Organic tempeh is the most popular value-added tempeh form currently present in the market and is sold at a premium price. Players are offering products in various packaging formats, such as cans and plastic packs, to serve different utilities.
- The price of tempeh is directly linked to the price of soybeans in North America, and the market's future is highly dependent on soybean prices. In 2023, soybean prices weakened in May due to expected growth in supplies and a downward trend in outlook. Prices averaged 1,369 cents per bushel in May 2023, which was 8.0% lower than April's price and also down by 17.6% from the same month in the previous year. Meanwhile, on May 31, 2023, the spot price was 1,300 cents per bushel, which was down by 10.0% from the same day of the previous month. Stricter customs checks in China, likely a government move to support demand for domestic soybean production, and weaker-than-expected economic data from China are expected to hinder market prices during the study period further.
North America Meat Substitutes Industry Overview
The North America Meat Substitutes Market is fragmented, with the top five companies occupying 36.85%. The major players in this market are Amy's Kitchen Inc., Beyond Meat Inc., Conagra Brands Inc., Impossible Foods Inc. and The Kellogg Company (sorted alphabetically).
Additional Benefits:
- The market estimate (ME) sheet in Excel format
- 3 months of analyst support
TABLE OF CONTENTS
1 EXECUTIVE SUMMARY & KEY FINDINGS
2 INTRODUCTION
- 2.1 Study Assumptions & Market Definition
- 2.2 Scope of the Study
- 2.3 Research Methodology
3 KEY INDUSTRY TRENDS
- 3.1 Price Trends
- 3.1.1 Tempeh
- 3.1.2 Textured Vegetable Protein
- 3.1.3 Tofu
- 3.2 Regulatory Framework
- 3.2.1 Canada
- 3.2.2 Mexico
- 3.2.3 United States
- 3.3 Value Chain & Distribution Channel Analysis
4 MARKET SEGMENTATION (includes market size in Value in USD, Forecasts up to 2030 and analysis of growth prospects)
- 4.1 Type
- 4.1.1 Tempeh
- 4.1.2 Textured Vegetable Protein
- 4.1.3 Tofu
- 4.1.4 Other Meat Substitutes
- 4.2 Distribution Channel
- 4.2.1 Off-Trade
- 4.2.1.1 Convenience Stores
- 4.2.1.2 Online Channel
- 4.2.1.3 Supermarkets and Hypermarkets
- 4.2.1.4 Others
- 4.2.2 On-Trade
- 4.2.1 Off-Trade
- 4.3 Country
- 4.3.1 Canada
- 4.3.2 Mexico
- 4.3.3 United States
- 4.3.4 Rest of North America
5 COMPETITIVE LANDSCAPE
- 5.1 Key Strategic Moves
- 5.2 Market Share Analysis
- 5.3 Company Landscape
- 5.4 Company Profiles (includes Global level Overview, Market level overview, Core Business Segments, Financials, Headcount, Key Information, Market Rank, Market Share, Products and Services, and analysis of Recent Developments)
- 5.4.1 Amy's Kitchen Inc.
- 5.4.2 Associated British Foods PLC
- 5.4.3 Beyond Meat Inc.
- 5.4.4 Cargill Inc.
- 5.4.5 Conagra Brands Inc.
- 5.4.6 Hormel Foods Corporation
- 5.4.7 Impossible Foods Inc.
- 5.4.8 International Flavors & Fragrances Inc.
- 5.4.9 Maple Leaf Foods
- 5.4.10 Nestle S.A.
- 5.4.11 The Campbell Soup Company
- 5.4.12 The Kellogg Company
6 KEY STRATEGIC QUESTIONS FOR MEAT SUBSTITUTES INDUSTRY CEOS
7 APPENDIX
- 7.1 Global Overview
- 7.1.1 Overview
- 7.1.2 Porter's Five Forces Framework
- 7.1.3 Global Value Chain Analysis
- 7.1.4 Market Dynamics (DROs)
- 7.2 Sources & References
- 7.3 List of Tables & Figures
- 7.4 Primary Insights
- 7.5 Data Pack
- 7.6 Glossary of Terms

