
|
市場調査レポート
商品コード
1693427
代替肉:市場シェア分析、産業動向・統計、成長予測(2025年~2030年)Meat Substitutes - Market Share Analysis, Industry Trends & Statistics, Growth Forecasts (2025 - 2030) |
||||||
カスタマイズ可能
適宜更新あり
|
|||||||
| 代替肉:市場シェア分析、産業動向・統計、成長予測(2025年~2030年) |
|
出版日: 2025年03月18日
発行: Mordor Intelligence
ページ情報: 英文 396 Pages
納期: 2~3営業日
|

全表示
- 概要
- 目次
概要
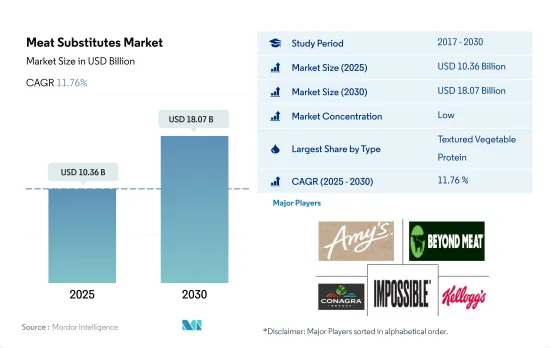
代替肉市場規模は2025年に103億6,000万米ドルと推定され、2030年には180億7,000万米ドルに達し、予測期間中(2025-2030年)のCAGRは11.76%で成長すると予測されます。
持続可能性と環境への配慮が菜食社会の成長を大きく後押ししている
- 2019-2022年の間、代替肉の販売額はCAGR 25.19%を記録し、プラス成長を観察したが、これは心血管疾患や糖尿病のような動物性タンパク質に関連する有害な健康上のトラブルと闘うために代替タンパク源を受け入れる意識の高まりによるものです。環境に優しいライフスタイルを選択しようという人々の意識の高まりも、代替肉需要を押し上げています。家畜由来の食肉製品の多くは保存期間が限られているが、大豆やその他の植物由来の代替食肉は1年間新鮮さを保つことができるため、嗜好性が高まっています。
- TVPは世界で最も消費されている代替肉です。TVPの販売額は増加し、2017年から2022年までのCAGRは6.54%を記録しました。大豆、小麦、エンドウ豆などの供給源からのTVPの出現は、動物性タンパク質から同様の栄養特性を持つ植物性タンパク質への消費者需要の変化を示しています。TVPの主要メーカーには、ADM、Cargill、Ingredion Incorporated、Kerry Group PLCなどがあります。主要メーカーは、Beyond Meat、Impossible Foods、Eat Just、Quornといった代替肉メーカーと提携し、市場への浸透を図っています。
- テンペは、予測期間中に金額ベースでCAGR 12.04%を記録し、最も急成長する代替肉食品になると予測されます。テンペに含まれる高タンパク質が、動物由来の肉の代替品として適しています。女性の間では、大豆を多く含む食事は乳がんのリスクが低いことが科学的に証明されており、現在世界中で約230万人の女性が罹患しています。テンペには、植物性食品では生物学的に利用できないビタミンB12が強化されていることが多く、食生活に取り入れられる理想的な代替肉食品のひとつとなっています。
健康への関心の高まりと幅広い代替肉の発売が売上を押し上げる
- 全地域の中でアジア太平洋が最も急成長する地域であり、予測期間中のCAGR値は12.38%と予測されます。これはベジタリアンとフレキシタリアン人口が多いためで、世界のベジタリアン数は約498万人です。このうち380万人はインド人であり、主にベジタリアン食を好む国です。そのため、こうした消費者は、肉に代わる健康的な食品として、肉に似た食感の製品を求めています。食用動物への不適切な抗生物質の使用は、抗菌剤耐性を助長します。したがって代替品の脅威は、抗生物質耐性や人獣共通感染症の脅威といった世界の公衆衛生問題のリスクを減少させることができます。
- 2022年時点の市場シェアは、欧州が北米を5%上回り、市場を独占しています。がんの死亡率が高い(死亡者数190万人)ことから肉の消費を減らすことを目的とし、肉消費の代替として植物性肉を推進するBECA(がん撲滅委員会)のような、代替肉に対する政府のプロモーションの高まりが、欧州の代替肉市場を牽引しています。
- しかし、中東は肉の代替食品を消費する高成長地域と推定され、予測期間中のCAGRは11.79%と予測されます。アラブ首長国連邦(834万人)やサウジアラビア(290万人)のような国々で外国人人口が増加しているため、Vbites、Fazenda Futuro、KBW venturesのようないくつかの新しい新興企業が肉の代替品に顧客を引き付けています。しかし、地球温暖化に対する認識や、継続的な肉食による様々な健康への懸念も、代替肉消費増加の一因となっています。
世界の代替肉市場動向
大豆価格の上昇がテンペ価格に影響
- テンペの世界平均価格は2017年から2022年にかけて0.93%上昇したが、これは主に大豆価格の影響を受けています。大豆はテンペの主原料であるため、世界市場における大豆価格の上昇がテンペ価格の上昇に寄与しています。また、テンペの価格はその品種にも左右されます。テンペ市場には数多くの種類のテンペが存在し、プレーンテンペは他の付加価値製品よりも低価格で販売されています。オーガニックテンペは、市場で最も人気のある付加価値テンペであり、プレミアム価格で販売されています。
- インドネシアは世界最大のテンペ生産国であり、アジア最大の大豆市場のひとつです。一般的に、インドネシアの大豆消費の約50%はテンペの形で消費されています。インドネシアで豆腐とテンペを生産するための輸入大豆の必要量は、年間300万トンに達すると予想されています。2021年に入ってから、テンペ生産者は製品の価格設定が難しくなり、輸入大豆価格の継続的な上昇に伴い、生産コストを削減するためにテンペ生産量を30%削減することを選択しました。インドネシアは2022年上半期に価格高騰を経験したが、これはロシアとウクライナの戦争による国際商品価格の上昇が原因でした。
- 北米では、2023年 5月に大豆価格が弱含みとなりました。5月の平均価格は1ブッシェルあたり1,369セントで、4月の価格を8.0%下回ったが、前年同月比では17.6%下落しました。2023年5月31日のスポット価格は1ブッシェル当たり1,300セントで、前月同日比10.0%下落しました。
代替肉産業の概要
代替肉市場は細分化されており、上位5社で11.16%を占めています。この市場の主要企業は以下の通り。 Amy's Kitchen Inc., Beyond Meat Inc., Conagra Brands Inc., Impossible Foods Inc. and The Kellogg Company(アルファベット順)
その他の特典
- エクセル形式の市場予測(ME)シート
- 3ヶ月のアナリストサポート
目次
第1章 エグゼクティブサマリーと主な調査結果
第2章 イントロダクション
- 調査の前提条件と市場定義
- 調査範囲
- 調査手法
第3章 主要産業動向
- 価格動向
- テンペ
- テクスチャード・ベジタブル・プロテイン
- 豆腐
- 規制の枠組み
- オーストラリア
- カナダ
- 中国
- フランス
- ドイツ
- インド
- イタリア
- 日本
- メキシコ
- 英国
- 米国
- バリューチェーンと流通チャネル分析
第4章 市場セグメンテーション
- タイプ
- テンペ
- テクスチャード・ベジタブル・プロテイン
- 豆腐
- その他の代替肉食品
- 流通チャネル
- オフトレード
- コンビニエンスストア
- オンラインチャネル
- スーパーマーケットとハイパーマーケット
- その他
- オントレード
- オフトレード
- 地域
- アフリカ
- タイプ別
- 流通チャネル別
- 国別
- エジプト
- ナイジェリア
- 南アフリカ
- その他のアフリカ
- アジア太平洋
- タイプ別
- 流通チャネル別
- 国別
- オーストラリア
- 中国
- インド
- インドネシア
- 日本
- マレーシア
- 韓国
- その他アジア太平洋地域
- 欧州
- タイプ別
- 流通チャネル別
- 国別
- フランス
- ドイツ
- イタリア
- オランダ
- ロシア
- スペイン
- 英国
- その他欧州
- 中東
- タイプ別
- 流通チャネル別
- 国別
- バーレーン
- クウェート
- オマーン
- カタール
- サウジアラビア
- アラブ首長国連邦
- その他中東
- 北米
- タイプ別
- 流通チャネル別
- 国別
- カナダ
- メキシコ
- 米国
- その他北米
- 南米
- タイプ別
- 流通チャネル別
- 国別
- アルゼンチン
- ブラジル
- その他南米諸国
- アフリカ
第5章 競合情勢
- 主要な戦略動向
- 市場シェア分析
- 企業情勢
- 企業プロファイル
- Amy's Kitchen Inc.
- Beyond Meat Inc.
- Cargill Inc.
- China Foodstuff & Protein Group Co. Ltd
- Conagra Brands Inc.
- House Foods Group Inc.
- Impossible Foods Inc.
- International Flavors & Fragrances Inc.
- Morinaga Milk Industry Co. Ltd
- The Kellogg Company
- Vitasoy International Holdings Ltd
第6章 CEOへの主な戦略的質問
第7章 付録
- 世界概要
- 概要
- ファイブフォース分析フレームワーク
- 世界のバリューチェーン分析
- 市場力学(DROs)
- 情報源と参考文献
- 図表一覧
- 主要洞察
- データパック
- 用語集
目次
Product Code: 92486
The Meat Substitutes Market size is estimated at 10.36 billion USD in 2025, and is expected to reach 18.07 billion USD by 2030, growing at a CAGR of 11.76% during the forecast period (2025-2030).
Sustainability and environmental concerns are majorly driving the growth of a vegan society
- During 2019-2022, the sales value of meat substitutes observed a positive growth, registering a CAGR of 25.19%, owing to the increasing consciousness toward accommodating alternate protein sources to combat the adverse health troubles associated with animal protein, like cardiovascular diseases and diabetes. The increasing consciousness among people to choose an eco-friendly lifestyle is also pushing the demand for meat substitutes. While most meat products derived from livestock have a limited shelf life, meat alternatives derived from soybeans and other plant-based sources can remain fresh for an entire year, thus increasing their preference.
- TVP is the most consumed meat substitute worldwide. The sales value of TVP increased, registering a CAGR of 6.54% from 2017 to 2022. The emergence of TVP from sources like soy, wheat, and peas demonstrates a change in consumer demand from animal protein to plant protein with similar nutritional characteristics. Some major TVP manufacturers are ADM, Cargill, Ingredion Incorporated, and Kerry Group PLC. Key players are partnering with meat alternative manufacturers, like Beyond Meat, Impossible Foods, Eat Just, and Quorn, to increase their market penetration.
- Tempeh is projected to be the fastest-growing meat substitute, recording a CAGR of 12.04% by value during the forecast period. The high level of protein in tempeh makes it a suitable alternative to animal-derived meat. Among women, a soy-rich diet is scientifically proven to pose a lower risk of breast cancer, which currently affects approximately 2.3 million women worldwide. Tempeh is often fortified with vitamin B12, which is not bioavailable in plant-based foods, making it one of the ideal meat substitutes accommodated in one's diet.
Rising health concerns and the launch of a wide range of meat substitutes boost sales
- Of all regions, Asia-Pacific is expected to be the fastest-growing region, with a projected CAGR value of 12.38% during the forecast period. This is due to a large vegetarian and flexitarian population, accounting for around 4.98 million vegetarians worldwide. Of these, 3.8 million were from India, a country that mainly prefers to consume vegetarian food. Therefore, such consumers look for meat-like texture products as a healthy alternative to meat. Inappropriate use of antibiotics in food animals contributes to antimicrobial resistance. Thus, meat substitutes can decrease the risk of global public health issues such as antibiotic resistance and zoonotic threats.
- Europe dominated the market with a 5% more market share than North America as of 2022. Rising government promotions for meat substitutes, like the committee on beating cancer, BECA, which aims to reduce meat consumption due to the high mortality rate of cancer (1.9 million deaths) and promotes plant-based meats as an alternative to meat consumption, are driving the European meat substitute market.
- However, the Middle East is estimated to be a high-growing region that consumes meat substitutes, with a projected CAGR of 11.79% during the forecast period. With the increasing expat population in countries like the United Arab Emirates (8.34 million) and Saudi Arabia (2.9 million), several new start-ups, like Vbites, Fazenda Futuro, and KBW ventures, are attracting customers toward meat substitutes. However, awareness about global warming and various health concerns of continuous meat consumption are also some reasons for the rising consumption of meat substitutes.
Global Meat Substitutes Market Trends
Rising soybean prices are impacting the prices of tempeh
- The average global price of tempeh grew by 0.93% between 2017 and 2022, mainly affected by soybean prices. As soybeans are the main ingredient used to make tempeh, the rising cost of soybeans in the global market contributes to the increasing tempeh prices. Prices of tempeh also depend on its variant. The market has seen the presence of numerous variants of tempeh, with plain tempeh being sold at a lower price than other value-added products. Organic tempeh is the most popular value-added tempeh form in the market and is sold at a premium price.
- Indonesia is the largest tempeh producer in the world and one of the largest soybean markets in Asia. In general, around 50% of Indonesian soybean consumption is in the form of tempeh. The need for imported soybeans to produce tofu and tempeh in Indonesia is expected to reach 3 million metric ton per year. Since the beginning of 2021, tempeh producers have experienced difficulties setting the price of their products and have chosen to reduce tempeh production by 30% to reduce production costs in line with the continuous increase in the price of imported soybeans. Indonesia experienced a price surge in the first half of 2022, caused by an increase in international commodity prices due to the war between Russia and Ukraine.
- In North America, soybean prices weakened in May 2023. The average price was 1,369 cents per bushel in May, 8.0% lower than April's price but down by 17.6% from the same month last year. On May 31, 2023, the spot price was 1,300 cents per bushel, down by 10.0% from the same day of the previous month.
Meat Substitutes Industry Overview
The Meat Substitutes Market is fragmented, with the top five companies occupying 11.16%. The major players in this market are Amy's Kitchen Inc., Beyond Meat Inc., Conagra Brands Inc., Impossible Foods Inc. and The Kellogg Company (sorted alphabetically).
Additional Benefits:
- The market estimate (ME) sheet in Excel format
- 3 months of analyst support
TABLE OF CONTENTS
1 EXECUTIVE SUMMARY & KEY FINDINGS
2 INTRODUCTION
- 2.1 Study Assumptions & Market Definition
- 2.2 Scope of the Study
- 2.3 Research Methodology
3 KEY INDUSTRY TRENDS
- 3.1 Price Trends
- 3.1.1 Tempeh
- 3.1.2 Textured Vegetable Protein
- 3.1.3 Tofu
- 3.2 Regulatory Framework
- 3.2.1 Australia
- 3.2.2 Canada
- 3.2.3 China
- 3.2.4 France
- 3.2.5 Germany
- 3.2.6 India
- 3.2.7 Italy
- 3.2.8 Japan
- 3.2.9 Mexico
- 3.2.10 United Kingdom
- 3.2.11 United States
- 3.3 Value Chain & Distribution Channel Analysis
4 MARKET SEGMENTATION (includes market size in Value in USD, Forecasts up to 2030 and analysis of growth prospects)
- 4.1 Type
- 4.1.1 Tempeh
- 4.1.2 Textured Vegetable Protein
- 4.1.3 Tofu
- 4.1.4 Other Meat Substitutes
- 4.2 Distribution Channel
- 4.2.1 Off-Trade
- 4.2.1.1 Convenience Stores
- 4.2.1.2 Online Channel
- 4.2.1.3 Supermarkets and Hypermarkets
- 4.2.1.4 Others
- 4.2.2 On-Trade
- 4.2.1 Off-Trade
- 4.3 Region
- 4.3.1 Africa
- 4.3.1.1 By Type
- 4.3.1.2 By Distribution Channel
- 4.3.1.3 By Country
- 4.3.1.3.1 Egypt
- 4.3.1.3.2 Nigeria
- 4.3.1.3.3 South Africa
- 4.3.1.3.4 Rest of Africa
- 4.3.2 Asia-Pacific
- 4.3.2.1 By Type
- 4.3.2.2 By Distribution Channel
- 4.3.2.3 By Country
- 4.3.2.3.1 Australia
- 4.3.2.3.2 China
- 4.3.2.3.3 India
- 4.3.2.3.4 Indonesia
- 4.3.2.3.5 Japan
- 4.3.2.3.6 Malaysia
- 4.3.2.3.7 South Korea
- 4.3.2.3.8 Rest of Asia-Pacific
- 4.3.3 Europe
- 4.3.3.1 By Type
- 4.3.3.2 By Distribution Channel
- 4.3.3.3 By Country
- 4.3.3.3.1 France
- 4.3.3.3.2 Germany
- 4.3.3.3.3 Italy
- 4.3.3.3.4 Netherlands
- 4.3.3.3.5 Russia
- 4.3.3.3.6 Spain
- 4.3.3.3.7 United Kingdom
- 4.3.3.3.8 Rest of Europe
- 4.3.4 Middle East
- 4.3.4.1 By Type
- 4.3.4.2 By Distribution Channel
- 4.3.4.3 By Country
- 4.3.4.3.1 Bahrain
- 4.3.4.3.2 Kuwait
- 4.3.4.3.3 Oman
- 4.3.4.3.4 Qatar
- 4.3.4.3.5 Saudi Arabia
- 4.3.4.3.6 United Arab Emirates
- 4.3.4.3.7 Rest of Middle East
- 4.3.5 North America
- 4.3.5.1 By Type
- 4.3.5.2 By Distribution Channel
- 4.3.5.3 By Country
- 4.3.5.3.1 Canada
- 4.3.5.3.2 Mexico
- 4.3.5.3.3 United States
- 4.3.5.3.4 Rest of North America
- 4.3.6 South America
- 4.3.6.1 By Type
- 4.3.6.2 By Distribution Channel
- 4.3.6.3 By Country
- 4.3.6.3.1 Argentina
- 4.3.6.3.2 Brazil
- 4.3.6.3.3 Rest of South America
- 4.3.1 Africa
5 COMPETITIVE LANDSCAPE
- 5.1 Key Strategic Moves
- 5.2 Market Share Analysis
- 5.3 Company Landscape
- 5.4 Company Profiles (includes Global level Overview, Market level overview, Core Business Segments, Financials, Headcount, Key Information, Market Rank, Market Share, Products and Services, and analysis of Recent Developments)
- 5.4.1 Amy's Kitchen Inc.
- 5.4.2 Beyond Meat Inc.
- 5.4.3 Cargill Inc.
- 5.4.4 China Foodstuff & Protein Group Co. Ltd
- 5.4.5 Conagra Brands Inc.
- 5.4.6 House Foods Group Inc.
- 5.4.7 Impossible Foods Inc.
- 5.4.8 International Flavors & Fragrances Inc.
- 5.4.9 Morinaga Milk Industry Co. Ltd
- 5.4.10 The Kellogg Company
- 5.4.11 Vitasoy International Holdings Ltd
6 KEY STRATEGIC QUESTIONS FOR MEAT SUBSTITUTES INDUSTRY CEOS
7 APPENDIX
- 7.1 Global Overview
- 7.1.1 Overview
- 7.1.2 Porter's Five Forces Framework
- 7.1.3 Global Value Chain Analysis
- 7.1.4 Market Dynamics (DROs)
- 7.2 Sources & References
- 7.3 List of Tables & Figures
- 7.4 Primary Insights
- 7.5 Data Pack
- 7.6 Glossary of Terms
