
アジア太平洋地域の代替肉:市場シェア分析、産業動向・統計、成長予測(2025年~2030年)
Asia-Pacific Meat Substitutes - Market Share Analysis, Industry Trends & Statistics, Growth Forecasts (2025 - 2030)- 発行日
- ページ情報
- 英文 209 Pages
- 納期
- 2~3営業日
- 商品コード
- 1692058
- カスタマイズ可能 お客様のご希望に応じて、既存データの加工や未掲載情報(例:国別セグメント)の追加などの対応が可能です。詳細はお問い合わせください。
- 適宜更新あり 本レポートは最新情報反映のため適宜更新し、内容構成変更を行う場合があります。ご検討の際はお問い合わせください。
- 翻訳ツール提供対象 PDF対応AI翻訳ツールの無料貸し出しサービスのご利用が可能です
概要
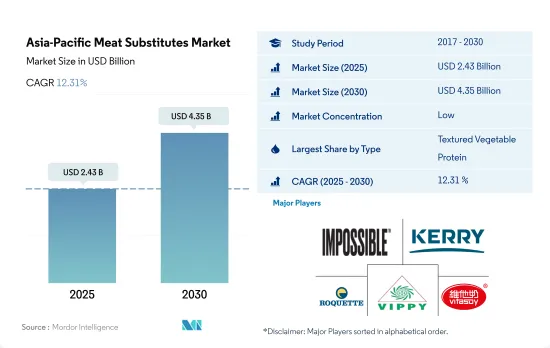
アジア太平洋地域の代替肉市場規模は2025年に24億3,000万米ドルと推定され、2030年には43億5,000万米ドルに達すると予測され、予測期間中(2025-2030年)のCAGRは12.31%で成長する見込みです。
持続可能性と環境への配慮が菜食社会の成長を牽引
- アジア太平洋地域の代替肉市場は著しい成長を示し、2017~2022年のCAGRは金額ベースで9.84%を記録しました。中国がアジア太平洋地域で最大の代替肉消費国であり、インドと日本がこれに続きます。中国では、主に植物ベースの肉とタンパク質の代替品の人気が成長を牽引しています。2021年に新たな食事ガイドラインを導入することで、中国政府は国民の肉消費量を50%削減する計画を発表しました。同国保健省は、個人が1日に摂取する肉の量を40g~75gに抑えるよう推奨しています。この措置は、公衆衛生を向上させると同時に、GHG排出量を大幅に削減することを目的としています。
- 代替肉の消費は、菜食主義のような食生活の普及により、年々増加し続けています。2022年、代替肉の販売額は2019年比で34.56%増加しました。アジアの植物性食肉生産者は、顧客が毎日の栄養所要量のために動物性または乳製品源に代わる健康的な代替品を探しているため、記録的な売上高を報告しました。世界のベジタリアン市場トップ5のうち4つがアジアにあります。2020年現在、アジアのベジタリアン人口の上位は以下の国に広がっている:インド(29.8%)、インドネシア(25.4%)、パキスタン(16.8%)、中国(3.8%)。
- 最も急成長しているセグメントタイプはテンペで、予測期間中に金額ベースで13.40%のCAGRで推移すると予測されています。消費者と投資家からの需要の高まりにより、アジアの代替肉市場は急成長が予測されます。この地域における新規参入企業や新興企業の出現は、GHG排出量削減目標を達成しようとする政府の支援とともに、この動向にとって明るい兆しです。
フュージョンとして植物性タンパク質を郷土料理に取り入れることが、この市場のセグメントを促進しています。
- インドは、アジア太平洋地域における代替肉の消費において最も急成長している国であり、予測期間中に金額ベースで13.03%のCAGRで推移すると予測されます。健康的な食品への需要が、インドにおける植物性代替肉の急速な拡大に拍車をかけています。アーチャー・ダニエルズ・ミッドランド社は、インドの植物性代替肉メーカー、イマジン・ミーツ社と提携しました。ADMは原材料を調達し、Imagine Meatsブランドの製品を製造するための技術提携に参加します。同様に、アラナ・グループの子会社であるティファニー・フーズは、最近インド市場にビヨンド・ミートのパテとソーセージの輸入を開始しました。
- 主要市場シェアは中国が占めています。2018年から2022年にかけて金額ベースで39.06%の成長を記録しました。植物性食品市場をリードする主要国際企業は、アメリカのImpossible Foods社とBeyond Meat社です。これらの企業は、スターバックス、KFC、タコベルなどのチェーンと提携するなど、さまざまな手段で中国市場に参入しました。中国市場に参入する中国企業は、現地の嗜好や文化を理解し、餃子などの郷土料理に注目したり、牛肉味ではなく豚肉味を選んだりしており、優位に立っています。
- インドネシアのような国では、代替肉市場が急激な成長を遂げています。2022年には、人口の約78%が肉の代替製品を試したことがあり、(24%が)ベジタリアンまたは植物ベースの食事を採用する予定です。需要が高く競合が比較的少ないため、ミートレス・キングダムのようなブランドは急成長を遂げる可能性が高いです。2021年2月、スターバックスはジャカルタとバリの57店舗で植物性メニューを導入しました。同様に、ピザハットとタコベルはビヨンド・ミート料理を導入しました。
アジア太平洋地域の代替肉市場動向
多層流通による原料価格高騰がテンペ価格を押し上げる
- アジア太平洋地域におけるテンペの平均価格は2022年に7.07米ドル/kgとなりました。同年、最高値を記録したのはインドとオーストラリアで、8米ドル/kgでした。2018年のテンペの最低価格は6米ドル/kgで、中国とインドネシアで記録されました。インドネシアは世界最大のテンペ生産国であり、アジア最大の大豆市場です。インドネシアの大豆消費の約50%はテンペの形で消費されています。インドネシアでテンペを生産するための輸入大豆の必要量は、年間300万トンに達すると予想されています。2021年に入ってから、テンペ生産者は製品の価格設定が難しくなり、輸入大豆価格の継続的な上昇に伴い、生産コストを削減するために30%の減産を選択しました。
- 加えて、世界の大豆価格が下がっても輸入大豆の仕入れ価格が高止まりしているという問題もあります。現在の大豆価格の高騰は、カルテル行為と官僚主義によって引き起こされました。大豆のような輸入食品の価格は比較的安いです。しかし、流通が多層化しているため、消費者に届くと高くなります。
- アジア諸国における大豆価格の高騰に対処するため、各国の大豆加工業者団体は、持続可能な解決策を見出すべく、各国政府の関与を要請しています。例えば、2021年6月、インドの大豆食品加工業界を代表する大豆食品振興福祉協会(SFPWA)は、インド政府に対し、国内の大豆価格が過去6ヶ月間で50%上昇したため、加工部門が米国から5万トンの食品用特殊大豆を無税で輸入することを許可するよう要請しました。
アジア太平洋地域の肉代替品産業概要
アジア太平洋地域の肉代替品市場は断片化されており、上位5社で15.32%を占めています。この市場の主要企業は以下の通りです。 Impossible Foods Inc., Kerry Group PLC, Roquette Freres, Vippy Industries Ltd and Vitasoy International Holdings Ltd(sorted alphabetically).
その他の特典
- エクセル形式の市場予測(ME)シート
- 3ヶ月のアナリストサポート
目次
第1章 エグゼクティブサマリーと主な調査結果
第2章 イントロダクション
- 調査の前提条件と市場定義
- 調査範囲
- 調査手法
第3章 主要産業動向
- 価格動向
- テンペ
- テクスチャード植物性タンパク質
- 豆腐
- 規制の枠組み
- オーストラリア
- 中国
- インド
- 日本
- バリューチェーンと流通チャネル分析
第4章 市場セグメンテーション
- タイプ
- テンペ
- テクスチャード植物性タンパク質
- 豆腐
- その他の代替肉
- 流通チャネル
- オフトレード
- コンビニエンスストア
- オンラインチャネル
- スーパーマーケットとハイパーマーケット
- その他
- オントレード
- オフトレード
- 国
- オーストラリア
- 中国
- インド
- インドネシア
- 日本
- マレーシア
- 韓国
- その他アジア太平洋地域
第5章 競合情勢
- 主要な戦略動向
- 市場シェア分析
- 企業情勢
- 企業プロファイル
- China Foodstuff & Protein Group Co. Ltd
- Flexitarian Foods Pty Ltd
- Impossible Foods Inc.
- Invigorate Foods Pvt. Ltd
- Kerry Group PLC
- Morinaga Milk Industry Co. Ltd
- Roquette Freres
- Vippy Industries Ltd
- Vitasoy International Holdings Ltd
第6章 CEOへの主な戦略的質問
第7章 付録
- 世界概要
- 概要
- ファイブフォース分析フレームワーク
- 世界のバリューチェーン分析
- 市場力学(DROs)
- 情報源と参考文献
- 図表一覧
- 主要洞察
- データパック
- 用語集
目次
The Asia-Pacific Meat Substitutes Market size is estimated at 2.43 billion USD in 2025, and is expected to reach 4.35 billion USD by 2030, growing at a CAGR of 12.31% during the forecast period (2025-2030).
Sustainability and environmental concerns majorly driving the growth of the vegan society
- The Asia-Pacific meat substitutes market witnessed significant growth, recording a CAGR of 9.84% by value over 2017-2022. China has the largest consumption of meat substitutes in Asia-Pacific, followed by India and Japan. In China, the growth is primarily led by the popularity of plant-based meat and protein alternatives. By introducing new dietary guidelines in 2021, the Chinese government announced plans to lower its citizens' meat consumption by 50%. The country's health ministry recommended that an individual consume only between 40 g and 75 g of meat each day. The measures aim to enhance public health while simultaneously attempting to significantly reduce GHG emissions.
- The consumption of meat substitutes has continued to progress over the years, owing to the growing adoption of diets like veganism. In 2022, the sales value of meat substitutes grew by 34.56% by value over 2019. Asian producers of plant-based meat reported record sales as customers looked for healthy alternatives against animal or dairy sources for daily nutrient requirements. Four of the top five global vegetarian markets are in Asia. As of 2020, the top Asian vegetarian population was spread over the following countries: India (29.8%), Indonesia (25.4%), Pakistan (16.8%), and China (3.8%).
- The fastest-growing segment type is tempeh, which is projected to register a CAGR of 13.40% by value during the forecast period. Due to rising demand from consumers and investors, the meat substitute market in Asia is predicted to experience rapid growth. The emergence of new entrants and startups in the region is a positive sign for this trend, along with supportive governments trying to meet their targets for reducing GHG emissions.
Incorporation of plant-based protein into local dishes as fusion is promoting the segment in the market
- India is expected to be the fastest-growing country in the consumption of meat substitutes in Asia-Pacific, and it is projected to register a CAGR of 13.03% by value during the forecast period. Demand for healthy foods is fueling the rapid expansion of plant-based meat substitutes in India. Archer Daniels Midland partnered with Imagine Meats, an Indian producer of plant-based meat substitutes. ADM will source raw ingredients and take part in a technology partnership to manufacture products under the Imagine Meats brand. Similarly, Tiffany Foods, a subsidiary of Allana Group, recently began importing Beyond Meat patties and sausages into the Indian market.
- China holds the major market share. It registered a growth of 39.06% by value from 2018 to 2022. The key international players leading the plant-based market are American companies Impossible Foods and Beyond Meat. These companies entered the Chinese market by various means, including partnering with chains such as Starbucks, KFC, and Taco Bell. Chinese companies entering the market are at an advantage as they understand local tastes and culture and are focusing on local dishes such as dumplings, as well as opting for pork rather than beef flavors.
- In countries like Indonesia, the market for meat substitutes is gaining exponential growth. In 2022, around 78% of the population had tried meat alternative products, (24%) planning to adopt a vegetarian or plant-based diet. With high demand and relatively little competition, brands such as the Meatless Kingdom are likely to see rapid growth. In February 2021, Starbucks introduced a plant-based menu at 57 stores in Jakarta and Bali. Similarly, Pizza Hut and Taco Bell introduced Beyond Meat dishes.
Asia-Pacific Meat Substitutes Market Trends
A hike in raw material prices driven by multilayered distribution is inflating tempeh prices
- The average price for tempeh in Asia-Pacific was USD 7.07/kg in 2022. In the same year, the highest price was recorded in India and Australia, at USD 8/kg. The lowest price for tempeh in 2018 was USD 6 kg, recorded in China and Indonesia. Indonesia is the largest tempeh producer in the world and the largest soybean market in Asia. Around 50% of Indonesian soybean consumption is in the form of tempeh. The need for imported soybeans to produce tempeh in Indonesia is expected to reach 3 million tons per year. Since the beginning of 2021, tempeh producers have experienced difficulties in setting the price of their products and have chosen to reduce production by 30% to reduce production costs in line with the continuous increase in the price of imported soybeans.
- In addition, other problems cause the purchase price of imported soybeans to remain high even though world soybean prices have decreased. The current high price of soybeans was caused by cartel practices and bureaucracy. Prices of imported food, such as soybeans, are relatively cheap. However, it becomes expensive when it reaches consumers because of its multi-layered distribution.
- To tackle rising soybean prices in Asian countries, associations of soybean processors in various countries have asked their governments to get involved to reach a sustainable solution. For instance, in June 2021, the Soy Food Promotion and Welfare Association (SFPWA), which represents the Indian soybean food processing industry, requested the Indian government to permit the processing sector to import 50,000 metric tons of food specialty soybeans from the United States duty-free as domestic soybean prices had increased by 50% over the previous six months.
Asia-Pacific Meat Substitutes Industry Overview
The Asia-Pacific Meat Substitutes Market is fragmented, with the top five companies occupying 15.32%. The major players in this market are Impossible Foods Inc., Kerry Group PLC, Roquette Freres, Vippy Industries Ltd and Vitasoy International Holdings Ltd (sorted alphabetically).
Additional Benefits:
- The market estimate (ME) sheet in Excel format
- 3 months of analyst support
TABLE OF CONTENTS
1 EXECUTIVE SUMMARY & KEY FINDINGS
2 INTRODUCTION
- 2.1 Study Assumptions & Market Definition
- 2.2 Scope of the Study
- 2.3 Research Methodology
3 KEY INDUSTRY TRENDS
- 3.1 Price Trends
- 3.1.1 Tempeh
- 3.1.2 Textured Vegetable Protein
- 3.1.3 Tofu
- 3.2 Regulatory Framework
- 3.2.1 Australia
- 3.2.2 China
- 3.2.3 India
- 3.2.4 Japan
- 3.3 Value Chain & Distribution Channel Analysis
4 MARKET SEGMENTATION (includes market size in Value in USD, Forecasts up to 2030 and analysis of growth prospects)
- 4.1 Type
- 4.1.1 Tempeh
- 4.1.2 Textured Vegetable Protein
- 4.1.3 Tofu
- 4.1.4 Other Meat Substitutes
- 4.2 Distribution Channel
- 4.2.1 Off-Trade
- 4.2.1.1 Convenience Stores
- 4.2.1.2 Online Channel
- 4.2.1.3 Supermarkets and Hypermarkets
- 4.2.1.4 Others
- 4.2.2 On-Trade
- 4.2.1 Off-Trade
- 4.3 Country
- 4.3.1 Australia
- 4.3.2 China
- 4.3.3 India
- 4.3.4 Indonesia
- 4.3.5 Japan
- 4.3.6 Malaysia
- 4.3.7 South Korea
- 4.3.8 Rest of Asia-Pacific
5 COMPETITIVE LANDSCAPE
- 5.1 Key Strategic Moves
- 5.2 Market Share Analysis
- 5.3 Company Landscape
- 5.4 Company Profiles (includes Global level Overview, Market level overview, Core Business Segments, Financials, Headcount, Key Information, Market Rank, Market Share, Products and Services, and analysis of Recent Developments)
- 5.4.1 China Foodstuff & Protein Group Co. Ltd
- 5.4.2 Flexitarian Foods Pty Ltd
- 5.4.3 Impossible Foods Inc.
- 5.4.4 Invigorate Foods Pvt. Ltd
- 5.4.5 Kerry Group PLC
- 5.4.6 Morinaga Milk Industry Co. Ltd
- 5.4.7 Roquette Freres
- 5.4.8 Vippy Industries Ltd
- 5.4.9 Vitasoy International Holdings Ltd
6 KEY STRATEGIC QUESTIONS FOR MEAT SUBSTITUTES INDUSTRY CEOS
7 APPENDIX
- 7.1 Global Overview
- 7.1.1 Overview
- 7.1.2 Porter's Five Forces Framework
- 7.1.3 Global Value Chain Analysis
- 7.1.4 Market Dynamics (DROs)
- 7.2 Sources & References
- 7.3 List of Tables & Figures
- 7.4 Primary Insights
- 7.5 Data Pack
- 7.6 Glossary of Terms
- 発行日
- 発行
- Mordor Intelligence
- ページ情報
- 英文 209 Pages
- 納期
- 2~3営業日


