
|
市場調査レポート
商品コード
1690964
北米のタンパク質:市場シェア分析、産業動向、成長予測(2025~2030年)North America Protein - Market Share Analysis, Industry Trends & Statistics, Growth Forecasts (2025 - 2030) |
||||||
カスタマイズ可能
適宜更新あり
|
|||||||
| 北米のタンパク質:市場シェア分析、産業動向、成長予測(2025~2030年) |
|
出版日: 2025年03月18日
発行: Mordor Intelligence
ページ情報: 英文 335 Pages
納期: 2~3営業日
|

全表示
- 概要
- 目次
概要
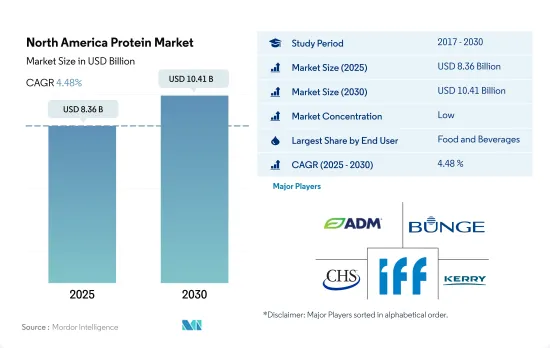
北米のタンパク質市場規模は2025年に83億6,000万米ドルと推定され、2030年には104億1,000万米ドルに達すると予測され、予測期間中(2025-2030年)のCAGRは4.48%で成長します。
乳製品、乳製品代替品、サプリメントのサブセグメントからの旺盛な需要により、飲食品セグメントが優位を占めています。
- 食品や飲料製品における乳清、小麦、エンドウ豆タンパク質のニーズの高まりにより、食品・飲料セグメントが市場を独占しています。大豆ベースの植物性タンパク質が広く使用されているため、乳製品と食肉代替物のサブセグメントが引き続き主導的地位を占めています。この2つのサブセグメントを合わせると、2022年の同地域の飲食品セグメントの総量の約60%を占めていました。大豆は線状の繊維に積み重ねると筋肉の質感を再現できるため、大豆タンパク質はタンパク質市場をリードしています。この特性により、大豆タンパク質は高水分押出、ゲル化、タンパク質強化に多く使用されています。必要な異方性製品構造を製造するため、これらの食肉類似物は高含水率(40%以上)と100℃以上の高温で押し出されます。
- 動物飼料は、家畜生産の拡大と高度な動物栄養技術の採用により、第2位のセグメントとなっています。昆虫タンパク質のような持続可能な代替タンパク源の導入により、動物飼料の市場潜在力はさらに拡大しています。2022年には、北米が世界の配合飼料生産で最も高いシェア(約2億6,100万トン、シェア20.6%)を占めました。
- パーソナルケアと化粧品は最も急成長している分野であり、2024年から2029年にかけて金額ベースで6.42%のCAGRで推移すると予測されています。米国では680万人が円形脱毛症などの毛髪の問題に苦しんでいます。コラーゲンの加水分解物であるコラーゲンペプチドは、毛球に栄養を与え、毛包を強化することで、健康な髪の成長に理想的な条件を育みます。OGXビオチン&コラーゲンシャンプー、サルコルコラーゲンヘアミスト、ヘアラヴィファンデーションコラーゲンエリクシールなどは、コラーゲンを配合したヘアケア製品の一例です。
様々な食品製造部門が存在するため、米国が市場の大半を占める
- 北米のタンパク質市場は、2020年から2023年にかけて販売額ベースで10.49%という良好な成長率を記録しました。米国は、高い製品統合と活発な競合情勢により市場をリードしました。各社は、小規模企業の買収、タンパク質生産部門の増強、製品ポートフォリオの拡大により、同国での存在感を強めています。Agropur、Anchor Ingredients、Hilmar Cheeseなどの企業は、レビュー期間中に生産能力を増強しました。このように、市場における絶え間ない製品開拓と差別化が、販売量の増加につながりました。
- カナダは、消費者がタンパク質源の多様化を推進していることを背景に、2023年も第2位の市場規模を維持しました。動物性タンパク質は、活況を呈する植物性タンパク質産業によって生み出される新しい機能性食品や付加価値製品に取って代わられつつあります。2021年には、カナダでは40%以上の人々が植物性食品の消費を積極的に増やそうと努力していました。植物性蛋白源はベジタリアン、ビーガン、「フレキシタリアン」のライフスタイルに適しているため、最近人気が高まっています。
- メキシコは、2024年から2029年までの予測数量CAGRが6.31%で、最も急成長する市場になりそうです。メキシコ市場は、同国における植物性タンパク質の需要によって支配されており、2024年から2029年までの数量ベースのCAGRは6.51%と予測されます。メキシコの消費者の間では、食肉の食品安全性、環境持続可能性、動物福祉の側面に対する意識が高まっているため、同国のかなりの部分で動物性タンパク質製品から植物性タンパク質製品へのシフトが観察されています。
北米タンパク質市場動向
動物性タンパク質の消費拡大が、原料セグメントの主要企業にチャンスをもたらしています。
- 菜食主義者の増加にもかかわらず、米国では動物性タンパク質の需要は安定しています。米国人の食生活におけるタンパク質の大部分は牛肉と鶏肉から摂取されており、次いで乳製品が多いです。2022年には、米国の成人消費者の80%が、豚肉、牛肉、鶏肉、魚を主な蛋白源として好んでいます。ゼラチンは水と結合する性質があるため、機能性食品業界での利用が拡大していることが市場を大きく牽引しています。
- 消費者は伝統的なタンパク質の選択肢を求め続けているが、動物性タンパク質業界に対して、環境問題にもっと取り組むよう期待を示しています。幅広い用途と健康的なライフスタイルに対する消費者の嗜好により、多くの米国原料メーカーがコラーゲン市場への参入を試みており、これが一人当たり消費パターンの増加の主な理由となっています。2019年から2021年にかけて、米国における医師が診断した関節炎の未調整有病率は、女性で24.2%、男性で17.9%でした。この地域における関節炎の有病率に起因して、骨と関節の健康のためのコラーゲンベースのサプリメントに対する需要が増加しています。
- 付加価値の高い乳製品が、カナダにおける一人当たりの乳タンパク質消費を牽引しています。流動乳、チーズ、クリーム、ヨーグルトは、カナダで主に消費されている乳製品です。2022年の国内牛乳消費量は1,024万3,000MTでした。2022年から2023年の販売データによると、カナダ人は全乳(バター脂肪率3.25%)を多く消費し、スキムミルク(バター脂肪率0%)、低脂肪乳をあまり消費していないです。カナダ人は適度な量の赤身肉を食べる。一人当たりの牛肉と鶏肉の消費量は、豚肉と羊肉に比べてカナダでは多いです。
肉と牛乳の生産は、動物性タンパク質原料として大きく貢献しています。
- グラフは、牛、豚、鶏の肉(骨付き、生、チルド)、牛とヤギの生乳、牛のスキムミルク、乾燥ホエイパウダーの生産データです。2023年の牛1頭当たりの生乳生産量は240万8,7ポンドで、2020年の2万3,777ポンドから1.30%増加しました。2022年現在、米国の平均乳牛頭数は9,402頭です。牛乳は通常、様々な工程を経て成分に分離され、流動性のある飲料用ミルクやその他の乳製品の製造に加工されます。
- 米国は世界最大の鶏肉生産国であり、2023年には世界の鶏肉生産量の20%のシェアを占めています。牛肉はコラーゲンの最も一般的な供給源のひとつであり、このユニークなタンパク質を大量に供給しています。世界最大の肥育牛産業である米国は、牛肉の世界最大の生産国でもあり、主に国内および輸出用の高品質の穀物肥育牛肉です。
- カナダの牛乳生産の70%近くは、ケベック州とオンタリオ州に集中しています。カナダで生産される生乳は2つの市場に供給されます。直接消費用の流動乳、クリーム、フレーバーミルクを含む流動乳市場と、工業用生乳市場です。FAS/Canadaは、2024年の生乳総生産量が1,031万トン(MMT)に達すると予測しており、2023年予測の1,026万5,000トンから緩やかに増加します。カナダの食肉加工企業は、生肉や冷凍肉から加工肉、燻製肉、缶詰肉、調理肉まで、多種多様な食肉製品を製造しています。カナダでは、ソーセージやコールドカットなどの加工肉の約70%が豚肉で作られています。
北米タンパク質産業概要
北米のタンパク質市場は細分化されており、上位5社で34.85%を占めています。主要企業は、Archer Daniels Midland Company、Bunge Limited、CHS Inc.、International Flavors & Fragrances、Inc.、Kerry Group PLCです。
その他の特典
- エクセル形式の市場予測(ME)シート
- 3ヶ月のアナリストサポート
目次
第1章 エグゼクティブサマリーと主な調査結果
第2章 イントロダクション
- 調査の前提条件と市場定義
- 調査範囲
- 調査手法
第3章 主要産業動向
- エンドユーザー市場規模
- ベビーフードおよび乳児用調製粉乳
- ベーカリー
- 飲料
- 朝食用シリアル
- 調味料/ソース
- 菓子類
- 乳製品および乳製品代替製品
- 高齢者栄養・医療栄養
- 肉・鶏肉・魚介類および肉代替製品
- RTE/RTC食品
- スナック
- スポーツ/パフォーマンス栄養
- 動物飼料
- パーソナルケアと化粧品
- タンパク質消費動向
- 動物性
- 植物
- 生産動向
- 動物
- 植物
- 規制の枠組み
- カナダ
- 米国
- バリューチェーンと流通チャネル分析
第4章 市場セグメンテーション
- 出典
- 動物性
- タンパク質タイプ別
- カゼインとカゼイネート
- コラーゲン
- 卵タンパク質
- ゼラチン
- 昆虫タンパク質
- ミルクタンパク質
- ホエイタンパク質
- その他の動物性タンパク質
- 微生物
- タンパク質タイプ別
- 藻類タンパク質
- マイコタンパク質
- 植物性
- タンパク質タイプ別
- ヘンプ・タンパク質
- エンドウ豆タンパク質
- ジャガイモ・タンパク質
- 米タンパク質
- 大豆タンパク質
- 小麦タンパク質
- その他の植物性タンパク質
- 動物性
- エンドユーザー
- 動物飼料
- 飲食品
- サブエンドユーザー別
- ベーカリー
- 飲料
- 朝食用シリアル
- 調味料/ソース
- 菓子類
- 乳製品・乳製品代替品
- 肉・鶏肉・魚介類および肉代替製品
- RTE/RTC食品
- スナック
- パーソナルケアと化粧品
- サプリメント
- サブエンドユーザー別
- ベビーフードおよび乳児用調製粉乳
- 高齢者栄養と医療栄養
- スポーツ/パフォーマンス栄養
- 国別
- カナダ
- メキシコ
- 米国
- その他北米地域
第5章 競争情勢
- 主要な戦略動向
- 市場シェア分析
- 企業情勢
- 企業プロファイル.
- Agropur Dairy Cooperative
- Archer Daniels Midland Company
- Arla Foods amba
- Bunge Limited
- CHS Inc.
- Darling Ingredients Inc.
- Farbest-Tallman Foods Corporation
- Fonterra Co-operative Group Limited
- Gelita AG
- Glanbia PLC
- Groupe Lactalis
- International Flavors & Fragrances, Inc.
- Kerry Group PLC
- MGP
- Milk Specialties Global
- Roquette Freres
- Sudzucker Group
- Tessenderlo Group
- The Scoular Company
第6章 CEOへの主な戦略的質問
第7章 付録
- 世界概要
- 概要
- ファイブフォース分析フレームワーク
- 世界のバリューチェーン分析
- 市場力学(DROs)
- 情報源と参考文献
- 図表一覧
- 主要洞察
- データパック
- 用語集
目次
Product Code: 90056
The North America Protein Market size is estimated at 8.36 billion USD in 2025, and is expected to reach 10.41 billion USD by 2030, growing at a CAGR of 4.48% during the forecast period (2025-2030).
The food and beverage segment dominates due to a strong demand from the dairy and dairy alternatives and supplements sub-segments
- The food and beverage segment dominates the market due to the growing need for whey, wheat, and pea proteins in food and beverage products. Due to the extensive use of soy-based plant protein, the dairy and meat alternatives sub-segments continued to hold leading positions. Together, the two sub-segments made up around 60% of the total volume of the food and beverage segment in the region in 2022. Since soy can replicate muscle texture when stacked into linear fibers, soy protein leads the protein market. Due to this property, it is highly used for high-moisture extrusion, gelling, and protein fortification. To produce the requisite anisotropic product structure, these meat analogs are extruded at high moisture contents (>40%) and elevated temperatures above 100 °C.
- Animal feed is the second-largest segment due to the expansion of livestock production and the adoption of advanced animal nutrition technologies. The market potential for animal feed is further expanded by the introduction of sustainable alternative protein sources like insect protein. In 2022, North America held the highest share in the global compound feed production, i.e., approximately 261 million ton and a share of 20.6%.
- Personal care and cosmetics is the fastest-growing segment, and it is projected to register a CAGR of 6.42% by value during 2024-2029. In the United States, 6.8 million people suffer from hair problems such as alopecia areata. Collagen peptides, which are the hydrolyzed form of collagen, nourish the hair bulbs and strengthen the hair follicles by fostering the ideal conditions for healthy hair growth. OGX Biotin & Collagen Shampoo, Salcoll Collagen Hair Mist, Hair La Vie Foundation Collagen Elixir, etc., are a few examples of hair care products containing collagen.
The United States holds a majority share of the market due to the strong presence of various food manufacturing units
- The North American protein market witnessed a favorable growth rate of 10.49% in terms of sales value from 2020 to 2023. The United States led the market due to high product consolidation and an active competitive landscape. Companies are strengthening their presence in the country by acquiring small firms, ramping up protein production units, and expanding their product portfolios. Companies such as Agropur, Anchor Ingredients, and Hilmar Cheese boosted their production capabilities over the review period. Thus, constant product developments and differentiation in the market further resulted in additional sales by volume.
- Canada remained the second-largest market in 2023, driven by consumers pushing for diversification of protein sources. Animal proteins are being replaced by new functional foods and value-added products that are created by the booming plant-protein industry. In 2021, more than 40% of people in Canada actively strived to increase their consumption of plant-based foods. The popularity of plant-based protein sources recently increased due to their suitability for vegetarian, vegan, and "flexitarian" lifestyles.
- Mexico is likely to be the fastest-growing market, with a projected volume CAGR of 6.31% from 2024 to 2029. The Mexican market is dominated by the demand for plant proteins in the country, and it is anticipated to register a CAGR of 6.51% by volume from 2024 to 2029. Due to the rising awareness among Mexican consumers about food safety, environmental sustainability, and animal welfare aspects of meat, a significant portion of the country observed a shift from animal protein products to plant-based protein products.
North America Protein Market Trends
The consumption growth of animal protein is fueling opportunities for key players in the ingredients segment
- Despite the rising vegan population, the demand for animal protein has been steady in the United States. The majority of protein in the American diet comes from beef and poultry, followed by dairy. In 2022, 80% of US adult consumers preferred pork, beef, poultry, and fish as their main protein sources. Due to its water-binding properties, the market is majorly driven by the growing usage of gelatin in the functional food industry.
- Consumers continue to demand traditional protein options, but they are signaling an expectation of the animal protein industry to do more to address environmental concerns. With a wide range of applications and consumer preferences toward a healthy lifestyle, many US ingredient manufacturers are trying to enter the collagen market, which is the major reason for the increase in per capita consumption patterns. From 2019 to 2021, the unadjusted prevalence of doctor-diagnosed arthritis in the United States was 24.2% among women and 17.9% among men. Owing to the prevalence of arthritis in the region, there is an increasing demand for collagen-based supplements for bone and joint health.
- Value-added dairy products drive the per capita consumption of milk protein in Canada. Fluid milk, cheese, cream, and yogurt are the dairy products mainly consumed in the country. In 2022, domestic cow milk consumption amounted to 10,243 thousand MT. The marketing year 2022-2023 sales data indicated that Canadians spent more on whole milk (3.25 % butterfat), less skim milk (0% butterfat), and reduced-fat milk. Canadians eat a moderate amount of red meat. Per capita consumption of beef and poultry is high in Canada compared to pig meat and sheep meat.
Meat and milk production contribute majorly as raw materials for animal protein ingredients
- The graph given depicts the production data for raw materials such as meat of cattle, pigs, and chicken (with bone, fresh or chilled), raw milk from cattle and goats, skim milk from cows, and dry whey powder. In 2023, 2,408,7 pounds of milk was produced per cow, an increase of 1.30% from 23,777 pounds in 2020. As of 2022, the average number of milk cows in the United States was 9,402. Milk is usually separated through various processes into components and processed into fluid beverage milk or the manufacture of other dairy products.
- The United States is the world's largest producer of chicken meat and accounted for a 20% share of global chicken meat production in 2023. Cattle meat is one of the most common sources of collagen, providing a significant amount of this unique protein. With the largest fed-cattle industry in the world, the United States is also the world's largest producer of cattle meat, primarily high-quality, grain-fed cattle meat for domestic and export use.
- Nearly 70% of Canada's milk production is concentrated in Quebec and Ontario. Milk produced in Canada supplies two markets: the fluid milk market, which includes fluid milk for direct consumption, creams, and flavored milk, and the industrial milk market. FAS/Canada forecasts total milk production to reach 10.310 million metric tons (MMT) in 2024, a modest increase from the 2023 estimate of 10.265 MMT. Canada's meat processing companies manufacture a wide variety of meat products, ranging from fresh and frozen meat to processed, smoked, canned, and cooked meats. About 70% of processed meats in Canada, such as sausages or cold cuts, are made with pork.
North America Protein Industry Overview
The North America Protein Market is fragmented, with the top five companies occupying 34.85%. The major players in this market are Archer Daniels Midland Company, Bunge Limited, CHS Inc., International Flavors & Fragrances, Inc. and Kerry Group PLC (sorted alphabetically).
Additional Benefits:
- The market estimate (ME) sheet in Excel format
- 3 months of analyst support
TABLE OF CONTENTS
1 EXECUTIVE SUMMARY & KEY FINDINGS
2 INTRODUCTION
- 2.1 Study Assumptions & Market Definition
- 2.2 Scope of the Study
- 2.3 Research Methodology
3 KEY INDUSTRY TRENDS
- 3.1 End User Market Volume
- 3.1.1 Baby Food and Infant Formula
- 3.1.2 Bakery
- 3.1.3 Beverages
- 3.1.4 Breakfast Cereals
- 3.1.5 Condiments/Sauces
- 3.1.6 Confectionery
- 3.1.7 Dairy and Dairy Alternative Products
- 3.1.8 Elderly Nutrition and Medical Nutrition
- 3.1.9 Meat/Poultry/Seafood and Meat Alternative Products
- 3.1.10 RTE/RTC Food Products
- 3.1.11 Snacks
- 3.1.12 Sport/Performance Nutrition
- 3.1.13 Animal Feed
- 3.1.14 Personal Care and Cosmetics
- 3.2 Protein Consumption Trends
- 3.2.1 Animal
- 3.2.2 Plant
- 3.3 Production Trends
- 3.3.1 Animal
- 3.3.2 Plant
- 3.4 Regulatory Framework
- 3.4.1 Canada
- 3.4.2 United States
- 3.5 Value Chain & Distribution Channel Analysis
4 MARKET SEGMENTATION (includes market size in Value in USD and Volume, Forecasts up to 2030 and analysis of growth prospects)
- 4.1 Source
- 4.1.1 Animal
- 4.1.1.1 By Protein Type
- 4.1.1.1.1 Casein and Caseinates
- 4.1.1.1.2 Collagen
- 4.1.1.1.3 Egg Protein
- 4.1.1.1.4 Gelatin
- 4.1.1.1.5 Insect Protein
- 4.1.1.1.6 Milk Protein
- 4.1.1.1.7 Whey Protein
- 4.1.1.1.8 Other Animal Protein
- 4.1.2 Microbial
- 4.1.2.1 By Protein Type
- 4.1.2.1.1 Algae Protein
- 4.1.2.1.2 Mycoprotein
- 4.1.3 Plant
- 4.1.3.1 By Protein Type
- 4.1.3.1.1 Hemp Protein
- 4.1.3.1.2 Pea Protein
- 4.1.3.1.3 Potato Protein
- 4.1.3.1.4 Rice Protein
- 4.1.3.1.5 Soy Protein
- 4.1.3.1.6 Wheat Protein
- 4.1.3.1.7 Other Plant Protein
- 4.1.1 Animal
- 4.2 End User
- 4.2.1 Animal Feed
- 4.2.2 Food and Beverages
- 4.2.2.1 By Sub End User
- 4.2.2.1.1 Bakery
- 4.2.2.1.2 Beverages
- 4.2.2.1.3 Breakfast Cereals
- 4.2.2.1.4 Condiments/Sauces
- 4.2.2.1.5 Confectionery
- 4.2.2.1.6 Dairy and Dairy Alternative Products
- 4.2.2.1.7 Meat/Poultry/Seafood and Meat Alternative Products
- 4.2.2.1.8 RTE/RTC Food Products
- 4.2.2.1.9 Snacks
- 4.2.3 Personal Care and Cosmetics
- 4.2.4 Supplements
- 4.2.4.1 By Sub End User
- 4.2.4.1.1 Baby Food and Infant Formula
- 4.2.4.1.2 Elderly Nutrition and Medical Nutrition
- 4.2.4.1.3 Sport/Performance Nutrition
- 4.3 Country
- 4.3.1 Canada
- 4.3.2 Mexico
- 4.3.3 United States
- 4.3.4 Rest of North America
5 COMPETITIVE LANDSCAPE
- 5.1 Key Strategic Moves
- 5.2 Market Share Analysis
- 5.3 Company Landscape
- 5.4 Company Profiles (includes Global Level Overview, Market Level Overview, Core Business Segments, Financials, Headcount, Key Information, Market Rank, Market Share, Products and Services, and Analysis of Recent Developments).
- 5.4.1 Agropur Dairy Cooperative
- 5.4.2 Archer Daniels Midland Company
- 5.4.3 Arla Foods amba
- 5.4.4 Bunge Limited
- 5.4.5 CHS Inc.
- 5.4.6 Darling Ingredients Inc.
- 5.4.7 Farbest-Tallman Foods Corporation
- 5.4.8 Fonterra Co-operative Group Limited
- 5.4.9 Gelita AG
- 5.4.10 Glanbia PLC
- 5.4.11 Groupe Lactalis
- 5.4.12 International Flavors & Fragrances, Inc.
- 5.4.13 Kerry Group PLC
- 5.4.14 MGP
- 5.4.15 Milk Specialties Global
- 5.4.16 Roquette Freres
- 5.4.17 Sudzucker Group
- 5.4.18 Tessenderlo Group
- 5.4.19 The Scoular Company
6 KEY STRATEGIC QUESTIONS FOR PROTEIN INGREDIENTS INDUSTRY CEOS
7 APPENDIX
- 7.1 Global Overview
- 7.1.1 Overview
- 7.1.2 Porter's Five Forces Framework
- 7.1.3 Global Value Chain Analysis
- 7.1.4 Market Dynamics (DROs)
- 7.2 Sources & References
- 7.3 List of Tables & Figures
- 7.4 Primary Insights
- 7.5 Data Pack
- 7.6 Glossary of Terms
