|
|
市場調査レポート
商品コード
1687837
ベトナムの外食産業:市場シェア分析、産業動向・統計、成長予測(2025年~2030年)Vietnam Foodservice - Market Share Analysis, Industry Trends & Statistics, Growth Forecasts (2025 - 2030) |
||||||
|
|||||||
カスタマイズ可能
適宜更新あり
|
|||||||

| ベトナムの外食産業:市場シェア分析、産業動向・統計、成長予測(2025年~2030年) |
|
出版日: 2025年03月18日
発行: Mordor Intelligence
ページ情報: 英文 190 Pages
納期: 2~3営業日
|

全表示
- 概要
- 目次
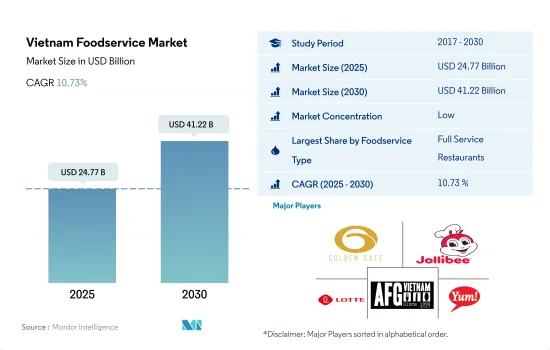
ベトナムの外食産業の市場規模は2025年に247億7,000万米ドルと推計され、2030年には412億2,000万米ドルに達すると予測され、予測期間中(2025年~2030年)のCAGRは10.73%で成長します。
ミシュランガイドとベトナム観光局がベトナム料理の普及を推進し、フルサービス・レストランが全国に拡大
- ベトナムの広大で多様な食文化により、フルサービスレストランが同国で最も高い市場シェアを占めています。2021年、ベトナムを訪れた外国人観光客の国籍別トップは中国で、5万7,700人近くが中国人観光客、次いで韓国が3万2,500人でした。アジア料理はベトナムで最も人気があり、2022年には料理シェアの40%以上を占める。この需要は、ベトナム料理が他の汎アジア料理と共通点を持つことから、アジア諸国からの観光客や在住者から生じています。2022年には、ミシュランガイドとベトナム国家観光局とのコラボレーションにより、ベトナム料理を世界に広める大きな拡大機会がもたらされました。
- クラウドキッチン市場はベトナムで急成長を遂げているが、その主な理由はその使いやすさと、パンデミック時に外食産業に提供した機会によるものです。COVID-19関連の封鎖期間中に運営上の課題に直面した多くのレストランは、複数のレストラン、特にデリバリー用の集中化された食品製造施設を活用して、バーチャル運営に移行しました。2022年6月、フィリピンとベトナムを拠点とするクラウドキッチン、クラウドイーツは、東南アジア全域への拡大のために700万米ドルの投資を確保しました。ベトナムにはGrabFood、Now、GrabKitchen、GoFoodなど様々なオンラインデリバリープラットフォームやクラウドキッチンがあり、飛躍的な成長の機会を提供しています。
- ベトナムはCOVID-19の大流行から緩やかな回復を見せ、オンラインフードデリバリーサービスと自動厨房技術の取り込みにより、2021年から2022年にかけて市場価値が13.22%増加しました。
ベトナムの外食産業市場動向
ベトナムのクイックサービス・レストラン市場は競争が激しく、国内外チェーンが優位を占める
- クラウドキッチンアウトレットが最も急成長しており、予測期間中のCAGRは3.72%と予測されます。ベトナムのクラウドキッチン市場の主な促進要因の1つは、GoFood、GrabFood、Baemin、Lalaなどのオンラインフードデリバリーサービスに対する需要の高まりです。これらのアプリは幅広い顧客層にリーチし、注文と配達のプロセスを合理化します。クラウドキッチンはまた、データ分析を活用して顧客の嗜好や行動を洞察し、メニュー提供や価格設定を最適化しています。
- フルサービス・アウトレットは、予測期間中にCAGR 0.35%を記録し、2番目に急成長すると予想されます。アジア料理が市場で大きなシェアを占めています。ベトナムでは近年、国際観光客が着実に増加しており、アジアからの観光客も多いです。例えば、2022年の台湾からの訪問者数は17,546人、日本からの訪問者数は16,592人、東南アジアからの訪問者数は11,502人、タイからの訪問者数は10,920人でした。その結果、これらの観光客に対応するため、ベトナムではアジア料理の需要が高まっています。
- クイック・サービス・レストランは市場競争が激しいです。マクドナルド、バーガーキング、KFC、ロッテリア、ジョリビー、ピザハットは、QSR市場でそれぞれ20店舗、140店舗、200店舗、60店舗、50店舗を展開する老舗の競合です。ベトナム人は、本格的なファストフードのコンセプトや、バインミー(焼き豚、パテ、野菜のピクルス、新鮮なハーブなど様々な具材を挟んだ、皮付きのバゲットで作るベトナム風サンドイッチ)のような国際的なオプションを好みます。同様に、フォーは米麺と風味豊かなスープで作られるベトナムの伝統的なスープで、牛肉や鶏肉、新鮮なハーブが添えられることが多いです。
2022年、ベトナムのクラウドキッチンの平均注文額が最も高くなりました。
- ベトナムでは、クラウドキッチンのAOVが最も高く、2022年には3.45米ドルとなりました。オンライン食事デリバリー需要の増加がクラウドキッチン市場の拡大を牽引しています。ベトナムでは、食事デリバリーサービスへの支出全体が2022年に11億米ドルに達しました。パンデミックの後、オンライン食事注文と配達サービスの人気が高まりました。ベトナムでクラウドキッチンが提供する人気料理はピザとパスタで、いずれも300g当たり平均2.4米ドルの価格です。2022年、クラウドキッチンが提供する人気料理のコストは平均注文額2.2米ドルに固定されました。
- ベトナムはアジア地域の豊かな国のひとつであり、旅行の重要な拠点でもあります。ベトナムの数多くの州で見られる美食の多様性は、その多民族・多言語という性質をさらに際立たせています。インド料理、韓国料理、その他のアジア料理は、全国的に広く消費されています。アジア料理の平均注文額は300gあたり1.75米ドルです。
- フルサービス・レストランの平均注文額は、調査期間中にCAGR 5.35%を記録すると予想されます。FSRは、利便性に慣れつつある顧客に対応するため、新しいテクノロジーとサービスを導入しています。モバイル決済、インターネット注文、宅配は、市場のフルサービス分野で普及しつつあります。包装済みの外食を含め、消費者が利用できる食事の選択肢が拡大しているため、価格設定がより重要な問題になってきています。定期購入のミールキットを提供する業者など、新たな競合が今後さらに業界を混乱させる可能性があります。
ベトナムの外食産業の概要
ベトナムの外食産業市場は断片化されており、上位5社で1.28%を占めています。この市場の主要企業は以下の通り。 Golden Gate JSC, Jollibee Foods Corporation, Lotte GRS, The Al Fresco's Group Vietnam and Yum!Brands Inc.(sorted alphabetically).
その他の特典
- エクセル形式の市場予測(ME)シート
- 3ヶ月間のアナリストサポート
目次
第1章 エグゼクティブサマリーと主な調査結果
第2章 レポートのオファー
第3章 イントロダクション
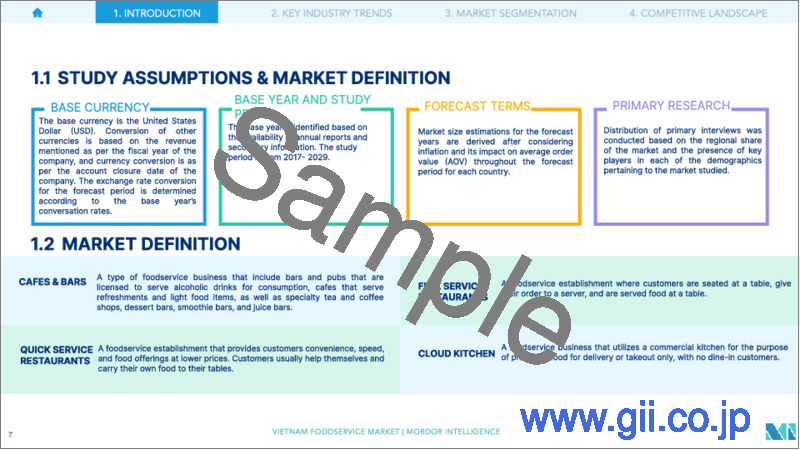
- 調査の前提条件と市場定義
- 調査範囲
- 調査手法
第4章 主要産業動向
- アウトレット数
- 平均注文額
- 規制の枠組み
- ベトナム
- メニュー分析
第5章 市場セグメンテーション
- 外食産業タイプ
- カフェ&バー
- 料理別
- バー&パブ
- カフェ
- ジュース/スムージー/デザートバー
- コーヒー&ティー専門店
- クラウドキッチン
- フルサービスレストラン
- 料理別
- アジア料理
- ヨーロピアン
- ラテンアメリカ料理
- 中東料理
- 北米料理
- その他のFSR料理
- クイックサービスレストラン
- 料理別
- ベーカリー
- ハンバーガー
- アイスクリーム
- 肉料理
- ピザ
- その他QSR料理
- カフェ&バー
- アウトレット
- チェーン店
- 独立店舗
- ロケーション
- レジャー
- 宿泊施設
- 小売
- 独立型
- 旅行
第6章 競合情勢
- 主要な戦略動向
- 市場シェア分析
- 企業情勢
- 企業プロファイル.
- CP All PCL
- Golden Gate JSC
- Imex Pan Pacific Group
- Jollibee Foods Corporation
- Lotte GRS Co. Ltd
- Mesa Group
- Restaurant Brands International Inc.
- Starbucks Corporation
- The Al Fresco's Group Vietnam
- Yum!Brands Inc.
第7章 CEOへの主な戦略的質問
第8章 付録
- 世界の概要
- 概要
- ファイブフォース分析フレームワーク
- 世界のバリューチェーン分析
- 市場力学(DROs)
- 情報源と参考文献
- 図表一覧
- 主要洞察
- データパック
- 用語集
The Vietnam Foodservice Market size is estimated at 24.77 billion USD in 2025, and is expected to reach 41.22 billion USD by 2030, growing at a CAGR of 10.73% during the forecast period (2025-2030).
Michelin Guide and Vietnam Tourism Promote Vietnamese Cuisine drives the expansion of the full service restaurants across the country
- Due to Vietnam's expansive and diverse culinary culture, full-service restaurants hold the highest market share in the country. In 2021, China was the leading nationality of foreign visitors to Vietnam, with nearly 57.7 thousand Chinese tourists, followed by South Korea, with 32.5 thousand visitors. Asian cuisine is the most popular in Vietnam, accounting for over 40% of the cuisine share in 2022. This demand stems from tourists from Asian countries and residents, as Vietnamese cuisine shares similarities with other Pan-Asian cuisines. In 2022, the collaboration between the Michelin Guide and the Vietnam National Administration of Tourism presented significant expansion opportunities for promoting Vietnamese cuisine globally.
- The cloud kitchen market is experiencing rapid growth in Vietnam, primarily due to its ease of use and the opportunities it provided to the foodservice industry during the pandemic. Many restaurants that faced operational challenges during the COVID-19-related lockdown transitioned to virtual operations, taking advantage of centralized food production facilities for multiple restaurants, especially for deliveries. In June 2022, CloudEats, a cloud kitchen based in the Philippines and Vietnam, secured a USD 7 million investment for expansion across Southeast Asia. Vietnam is home to various online delivery platforms and cloud kitchens, including GrabFood, Now, GrabKitchen, and GoFood, providing opportunities for exponential growth.
- Vietnam showed a moderate recovery from the COVID-19 pandemic, witnessing a 13.22% increase in market value from 2021 to 2022, owing to the incorporation of online food delivery services and automated kitchen technologies.
Vietnam Foodservice Market Trends
Vietnamese quick service restaurant market is highly competitive, with local and international chains dominating
- Cloud kitchen outlets are the fastest-growing, and they are projected to register a CAGR of 3.72% during the forecast period. One of the primary drivers of the cloud kitchen market in Vietnam is the growing demand for online food delivery services, such as GoFood, GrabFood, Baemin, and Lala. These apps reach a wider customer base and streamline the ordering and delivery process. Cloud kitchens are also leveraging data analytics to gain insights into customer preferences and behavior and optimize menu offerings and pricing.
- Full service outlets are expected to be the second fastest-growing, registering a CAGR of 0.35% during the forecast period. Asian cuisine holds a major share of the market. Vietnam has experienced a steady increase in international tourism in recent years, with many tourists coming from Asia. For example, there were 17,546 visitor arrivals from Taiwan, 16,592 visitor arrivals from Japan, 11,502 from Southeast Asia, and 10,920 from Thailand in 2022. As a result, there has been a growing demand for Asian cuisine in Vietnam to cater to these tourists.
- Quick service restaurants are highly competitive in the market. McDonald's, Burger King, KFC, Lotteria, Jollibee, and Pizza Hut are well-established competitors with 20, 140, 200, 60, and 50 outlets, respectively, in the QSR market. Vietnamese prefer authentic fast-food concepts and international options such as Banh mi, a Vietnamese sandwich made with a crusty baguette and filled with various ingredients such as grilled pork, pate, pickled vegetables, and fresh herbs. Similarly, Pho is a traditional Vietnamese soup made with rice noodles and a flavorful broth, often served with beef or chicken and fresh herbs.
Cloud kitchens in Vietnam saw the highest average order value in 2022, driven by online meal delivery
- In Vietnam, the AOV was the highest for cloud kitchens, at USD 3.45 in 2022. An increase in the demand for online meal delivery is driving the expansion of the cloud kitchen market. In Vietnam, the overall spending on food delivery services reached USD 1.1 billion in 2022. Online meal ordering and delivery services grew in popularity after the pandemic. Popular dishes offered by cloud kitchens in Vietnam are pizza and pasta, both priced at an average of USD 2.4 per 300 g. In 2022, the cost of the most popular dishes served by cloud kitchen was fixed at the average order value of USD 2.2.
- Vietnam is one of the affluent nations in the Asian region and a significant hub for travel. The gastronomic diversity that can be found throughout the country's numerous cantons serves to further emphasize its multi-ethnic and multilingual nature. Indian, Korean, and other Asian cuisines are more widely consumed nationwide. The average order value for Asian cuisine meals is USD 1.75 per 300 g.
- The full-service restaurants' average order value is expected to record a CAGR of 5.35% during the study period. FSR is implementing new technologies and services to cater to customers who are becoming more accustomed to convenience. Mobile payments, internet ordering, and home delivery are becoming more prevalent in full-service areas of the market. Due to the expanding number of dining options available to consumers, including pre-packaged restaurant meals, pricing is becoming a more crucial problem. Emerging competitors, such as providers of subscription meal kits, could further disrupt the industry in the future.
Vietnam Foodservice Industry Overview
The Vietnam Foodservice Market is fragmented, with the top five companies occupying 1.28%. The major players in this market are Golden Gate JSC, Jollibee Foods Corporation, Lotte GRS Co. Ltd, The Al Fresco's Group Vietnam and Yum! Brands Inc. (sorted alphabetically).
Additional Benefits:
- The market estimate (ME) sheet in Excel format
- 3 months of analyst support
TABLE OF CONTENTS
1 EXECUTIVE SUMMARY & KEY FINDINGS
2 REPORT OFFERS
3 INTRODUCTION
- 3.1 Study Assumptions & Market Definition
- 3.2 Scope of the Study
- 3.3 Research Methodology
4 KEY INDUSTRY TRENDS
- 4.1 Number Of Outlets
- 4.2 Average Order Value
- 4.3 Regulatory Framework
- 4.3.1 Vietnam
- 4.4 Menu Analysis
5 MARKET SEGMENTATION (includes market size in Value in USD, Forecasts up to 2030 and analysis of growth prospects)
- 5.1 Foodservice Type
- 5.1.1 Cafes & Bars
- 5.1.1.1 By Cuisine
- 5.1.1.1.1 Bars & Pubs
- 5.1.1.1.2 Cafes
- 5.1.1.1.3 Juice/Smoothie/Desserts Bars
- 5.1.1.1.4 Specialist Coffee & Tea Shops
- 5.1.2 Cloud Kitchen
- 5.1.3 Full Service Restaurants
- 5.1.3.1 By Cuisine
- 5.1.3.1.1 Asian
- 5.1.3.1.2 European
- 5.1.3.1.3 Latin American
- 5.1.3.1.4 Middle Eastern
- 5.1.3.1.5 North American
- 5.1.3.1.6 Other FSR Cuisines
- 5.1.4 Quick Service Restaurants
- 5.1.4.1 By Cuisine
- 5.1.4.1.1 Bakeries
- 5.1.4.1.2 Burger
- 5.1.4.1.3 Ice Cream
- 5.1.4.1.4 Meat-based Cuisines
- 5.1.4.1.5 Pizza
- 5.1.4.1.6 Other QSR Cuisines
- 5.1.1 Cafes & Bars
- 5.2 Outlet
- 5.2.1 Chained Outlets
- 5.2.2 Independent Outlets
- 5.3 Location
- 5.3.1 Leisure
- 5.3.2 Lodging
- 5.3.3 Retail
- 5.3.4 Standalone
- 5.3.5 Travel
6 COMPETITIVE LANDSCAPE
- 6.1 Key Strategic Moves
- 6.2 Market Share Analysis
- 6.3 Company Landscape
- 6.4 Company Profiles (includes Global Level Overview, Market Level Overview, Core Business Segments, Financials, Headcount, Key Information, Market Rank, Market Share, Products and Services, and Analysis of Recent Developments).
- 6.4.1 CP All PCL
- 6.4.2 Golden Gate JSC
- 6.4.3 Imex Pan Pacific Group
- 6.4.4 Jollibee Foods Corporation
- 6.4.5 Lotte GRS Co. Ltd
- 6.4.6 Mesa Group
- 6.4.7 Restaurant Brands International Inc.
- 6.4.8 Starbucks Corporation
- 6.4.9 The Al Fresco's Group Vietnam
- 6.4.10 Yum! Brands Inc.
7 KEY STRATEGIC QUESTIONS FOR FOODSERVICE CEOS
8 APPENDIX
- 8.1 Global Overview
- 8.1.1 Overview
- 8.1.2 Porter's Five Forces Framework
- 8.1.3 Global Value Chain Analysis
- 8.1.4 Market Dynamics (DROs)
- 8.2 Sources & References
- 8.3 List of Tables & Figures
- 8.4 Primary Insights
- 8.5 Data Pack
- 8.6 Glossary of Terms

