
インドネシアの作物保護化学品市場:市場シェア分析、産業動向と統計、成長予測(2025~2030年)
Indonesia Crop Protection Chemicals - Market Share Analysis, Industry Trends & Statistics, Growth Forecasts (2025 - 2030)- 発行日
- ページ情報
- 英文 204 Pages
- 納期
- 2~3営業日
- 商品コード
- 1687180
- カスタマイズ可能 お客様のご希望に応じて、既存データの加工や未掲載情報(例:国別セグメント)の追加などの対応が可能です。詳細はお問い合わせください。
- 適宜更新あり 本レポートは最新情報反映のため適宜更新し、内容構成変更を行う場合があります。ご検討の際はお問い合わせください。
- 翻訳ツール提供対象 PDF対応AI翻訳ツールの無料貸し出しサービスのご利用が可能です
概要
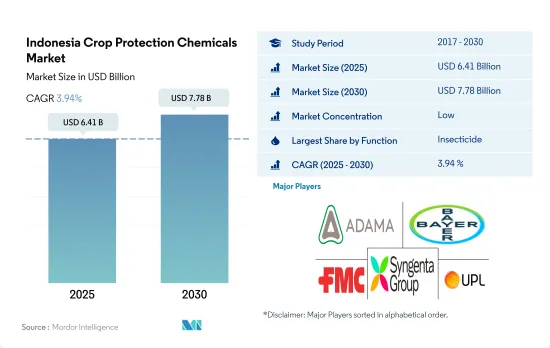
インドネシアの作物保護化学品市場規模は2025年に64億1,000万米ドルと推定され、2030年には77億8,000万米ドルに達すると予測され、予測期間中(2025~2030年)のCAGRは3.94%で成長すると予測されます。
殺虫剤がインドネシアの作物保護化学品市場を独占
- 天然資源と適切な気候条件に恵まれたインドネシアは、アジアで最も重要な農業市場のひとつです。特に、食料安全保障を達成するための主要手段として収量が重視されるようになったことで、作物保護化学製品に対する需要が刺激されています。インドネシアの作物保護化学品市場は着実に成長し、歴史的期間(2017~2022年)に金額で22億米ドル増加しました。
- 農地の拡大と農業技術の進歩により、作物保護化学品はこの国でますます一般的になっています。インドネシアは世界最大のパーム油生産国であり、コーヒー生産では第4位です。コメ生産における作物保護化学品の使用量は依然として高いです。
- 殺虫剤は2022年に金額ベースで74.4%の最大シェアを占めました。農業従事者は多様な登録農薬群を利用できるようにしなければならず、これによって圃場でのグループ間のローテーションが可能になります。2021年2月まで、インドネシアでは1,059の殺虫剤ブランドが登録されており、80種類の有効成分で構成されています。インドネシアで登録されている有効成分の90%以上が、ピレスロイド、有機リン酸塩、アベルメクチン、ミルベマイシンの組み合わせで構成されています。
- 農業は経済において重要な役割を果たしているため、政府はGDPを押し上げるためにインドネシアで精密農業産業を推進しています。この動きは、同国の作物保護化学品市場に好影響を与えています。害虫の蔓延の増加や農業従事者の意識の高まりに加え、新しい農法の採用や食品の安全性と品質を維持する需要により、同国の農作物保護化学品市場は予測期間(2023~2029年)にCAGR 4.1%を記録すると予測されます。
インドネシアの作物保護化学製品市場の動向
除草剤耐性雑草の増加によりヘクタール当たりの除草剤消費量が増加
- インドネシアは著名な農業国であり、肥沃な土地と熱帯性気候という、多種多様な作物の栽培に有利な条件が揃っていることが特徴です。しかし、同国の農業部門は、雑草の蔓延、害虫、菌類病など、数多くの課題に直面しています。これらの問題に対処し、農作物の生産を強化するため、インドネシアの農業従事者は農作物の損失を抑える手段として農薬製品に大きく依存しています。
- 1ヘクタール当たりの除草剤消費量は、過去の調査期間中に2.7%という大幅な伸びを示しました。この急増は主に、主要作物で観察される雑草の蔓延の激化に起因しています。厄介なことに、これらの侵入雑草は、特定の作物やそれに関連する環境にもよりますが、10%から驚異的な60%に及ぶ年間収量の大幅な損失を引き起こしています。こうした有害な損失と闘うため、農業従事者はますます除草剤を主要な防除方法とするようになっています。しかし、作物への除草剤の継続的な散布により、雑草はこれらの薬剤に対する耐性を獲得しています。この結果、除草剤の消費量が増え、1ヘクタール当たりの散布量が増加し、インドネシアの農業従事者が直面している課題を悪化させています。
- 殺菌剤、殺虫剤、その他の農薬製品の1ヘクタール当たりの消費量は、大きな変化もなく比較的安定しています。しかし、農業活動の拡大により、国内の1ヘクタール当たりの農薬使用量は全体的に増加しています。この増加傾向は、農薬の最大残留使用量に制限を設ける規制がないことに起因しています。その結果、1ヘクタール当たりの農薬消費量は増加傾向にあります。
農薬メーカーが有効成分価格の上昇を消費者に転嫁し、農薬価格が上昇する可能性があります。
- 有効成分の価格は農薬の生産コストに直接影響します。有効成分の価格が上昇すると、農薬メーカーはそのコスト増を消費者に転嫁し、結果として農薬価格が上昇する可能性があります。
- シペルメトリンは2022年に1トン当たり2万900米ドルと評価されました。シペルメトリンは合成ピレスロイド系殺虫剤で、大規模な業務用農業用途に使用され、低用量でも散布直後から昆虫を駆除するのに非常に効果的です。また、斑点玉虫、ピンクボールワーム、アーリースポットボーラー、毛虫などの昆虫による病害の防除にも有効です。シペルメトリンに代わる薬剤が入手可能かどうかは、価格設定に影響します。
- アトラジンは価格が大幅に上昇し、2022年には1トン当たり9,900米ドルと評価されました。アトラジンは、農作物の発生前と発生後の広葉雑草やイネ科雑草の防除に使用され、畑作トウモロコシ、スイートコーン、ソルガム、サトウキビへの使用が最も多いです。アトラジンは雑草を管理することで、作物の生産量を最大6%増加させることができると予測されています。こうした要因から、この有効成分の価格は近年、需要の増加に伴って上昇している可能性があります。除草剤の使用に関する農業従事者の決定は、有効成分の価格に影響される可能性があります。価格が上昇すれば、農業従事者は代替除草剤の使用を検討するようになる可能性があります。
- 2022年現在、マンコゼブ化学殺菌剤の価格は1トン当たり約7,700米ドルと評価されています。マンコゼブは接触殺菌剤で、果実、野菜、ナッツ、畑作物など幅広い作物を保護する能力を持っています。また、プロの芝生管理にもよく利用されています。その多用途性と有効性から、農業従事者やその他の専門家にとって、農作物を保護するための貴重なツールとなっています。
インドネシア農作物保護化学品産業概要
インドネシアの農薬市場は細分化されており、上位5社で1.67%を占めています。この市場の主要企業は、 ADAMA Agricultural Solutions Ltd、Bayer AG、FMC Corporation、Syngenta Group、UPL limitedなどです。
その他の特典
- エクセル形式の市場予測(ME)シート
- 3ヶ月のアナリストサポート
目次
第1章 エグゼクティブサマリーと主要調査結果
第2章 レポートのオファー
第3章 イントロダクション
- 調査の前提条件と市場定義
- 調査範囲
- 調査手法
第4章 主要産業動向
- 1ヘクタール当たりの農薬消費量
- 有効成分の価格分析
- 規制の枠組み
- インドネシア
- バリューチェーンと流通チャネル分析
第5章 市場セグメンテーション
- 機能
- 殺菌剤
- 除草剤
- 殺虫剤
- 軟体動物駆除剤
- 殺線虫剤
- 適用モード
- 薬剤散布
- 葉面散布
- 燻蒸
- 種子処理
- 土壌処理
- 作物タイプ
- 商業作物
- 果物・野菜
- 穀物
- 豆類・油糧種子
- 芝・観賞用
第6章 競争情勢
- 主要な戦略的動き
- 市場シェア分析
- 企業情勢
- 企業プロファイル
- ADAMA Agricultural Solutions Ltd
- BASF SE
- Bayer AG
- Corteva Agriscience
- FMC Corporation
- Nufarm Ltd
- PT BIoTis Agrindo
- Syngenta Group
- UPL limited
- Wynca Group(Wynca Chemicals)
第7章 CEOへの主要戦略的質問
第8章 付録
- 世界概要
- 概要
- ファイブフォース分析フレームワーク
- 世界のバリューチェーン分析
- 市場力学(DROs)
- 情報源と参考文献
- 図表一覧
- 主要洞察
- データパック
- 用語集
目次
Product Code: 56086
The Indonesia Crop Protection Chemicals Market size is estimated at 6.41 billion USD in 2025, and is expected to reach 7.78 billion USD by 2030, growing at a CAGR of 3.94% during the forecast period (2025-2030).
Insecticides dominate the Indonesian crop protection chemicals market
- Given its natural resources and the right climatic conditions, Indonesia is one of the most important agricultural markets in Asia. In particular, demand for crop protection chemicals has been stimulated by a greater emphasis on yield as the primary instrument of achieving food security. The Indonesian crop protection chemicals market grew steadily, increasing by USD 2.2 billion in value during the historical period (2017-2022).
- Crop protection chemicals have become increasingly common in this country due to the expansion of agricultural land and advancements in farming techniques. Indonesia is the largest producer of palm oil globally and ranks fourth in coffee production. The use of crop protection chemicals in rice production remains high.
- Insecticides held the largest share of 74.4% by value in 2022. Farmers must have access to a diverse range of registered pesticide groups, which enables them to rotate among the groups in the field. Until February 2021, there were 1,059 insecticide brands registered in Indonesia, consisting of 80 different active ingredients. More than 90% of active ingredients registered in Indonesia consist of a combination of pyrethroids, organophosphates, avermectins, and milbemycins.
- The government is promoting the precision agriculture industry in Indonesia to boost its GDP, as agriculture plays a significant role in the economy. This move has had a positive impact on the crop protection chemicals market in the country. Owing to the increase in pest infestations and rise in awareness among farmers, coupled with the adoption of new farming practices and a demand to maintain food safety and quality, the crop protection chemicals market in the country is anticipated to record a CAGR of 4.1% during the forecast period (2023-2029).
Indonesia Crop Protection Chemicals Market Trends
Increased number of herbicide-resistant weed species has increased the herbicide consumption per hectare
- Indonesia stands out as a prominent agricultural country, distinguished by its abundance of fertile land and tropical climate, both of which create advantageous conditions for cultivating a wide variety of crops. However, the agricultural sector in the country faces numerous challenges, including weed infestation, insect pests, and fungal diseases. To address these issues and bolster crop production, Indonesian farmers are heavily relying on pesticide products as a means of controlling crop losses.
- The per hectare consumption of herbicides has witnessed a significant 2.7% increase during the historical period. This surge is primarily attributed to the escalating weed infestation observed in major crops. Disturbingly, these invasive weeds are causing substantial annual yield losses, ranging from 10% to a staggering 60%, depending on the specific crop and its associated environment. In order to combat these detrimental losses, farmers have increasingly turned to herbicides as their primary method of control. However, the continuous application of herbicides on crops has led the weeds to develop resistance against these chemical agents. This consequence has resulted in increased consumption of herbicides and an elevated application rate per hectare, exacerbating the challenge faced by Indonesian farmers.
- The per hectare consumption of fungicides, insecticides, and other pesticide products remains relatively stable without any significant changes. However, the overall usage of pesticides per hectare in the country is increasing due to the expansion of agricultural activities. This upward trend can be attributed to a lack of regulations that set limits on the maximum residual use of pesticides. As a result, the consumption of pesticides per hectare is on the rise.
Pesticide manufacturers may pass on the increase in active ingredient prices to consumers, resulting in higher pesticide prices
- The price of active ingredients directly affects the cost of producing pesticides. When the price of active ingredients rises, pesticide manufacturers may pass on these increased costs to consumers, resulting in higher pesticide prices.
- Cypermethrin was valued at USD 20.9 thousand per metric ton in 2022. It is a synthetic pyrethroid used as an insecticide in large-scale commercial agricultural applications and is very effective in controlling the insects immediately after application, even at lower doses. It is also effective in controlling diseases by insects such as spotted ball worms, pink ball worms, early spot borers, and hairy caterpillars. The availability of alternatives to cypermethrin can impact its pricing.
- Atrazine witnessed a significant increase in its price, valued at USD 9.9 thousand per metric ton in 2022. It is used to stop pre- and post-emergence broadleaf and grassy weeds in crops, with the highest use on field corn, sweet corn, sorghum, and sugarcane. It is projected that atrazine can raise crop production by up to 6% by managing weeds. Due to these factors, the prices of this active ingredient may have gone up in recent years in line with the rising demand. Farmers' decisions on herbicide usage can be affected by active ingredient prices. Higher prices may lead farmers to explore alternative herbicide applications.
- As of 2022, the price of mancozeb chemical fungicide was valued at approximately USD 7.7 thousand per metric ton. It is a contact fungicide that has the ability to provide protection for a wide range of crops, including fruits, vegetables, nuts, and field crops. It is also commonly utilized in professional turf management. Its versatility and effectiveness make it a valuable tool for farmers and other professionals to protect crops.
Indonesia Crop Protection Chemicals Industry Overview
The Indonesia Crop Protection Chemicals Market is fragmented, with the top five companies occupying 1.67%. The major players in this market are ADAMA Agricultural Solutions Ltd, Bayer AG, FMC Corporation, Syngenta Group and UPL limited (sorted alphabetically).
Additional Benefits:
- The market estimate (ME) sheet in Excel format
- 3 months of analyst support
TABLE OF CONTENTS
1 EXECUTIVE SUMMARY & KEY FINDINGS
2 REPORT OFFERS
3 INTRODUCTION
- 3.1 Study Assumptions & Market Definition
- 3.2 Scope of the Study
- 3.3 Research Methodology
4 KEY INDUSTRY TRENDS
- 4.1 Consumption Of Pesticide Per Hectare
- 4.2 Pricing Analysis For Active Ingredients
- 4.3 Regulatory Framework
- 4.3.1 Indonesia
- 4.4 Value Chain & Distribution Channel Analysis
5 MARKET SEGMENTATION (includes market size in Value in USD and Volume, Forecasts up to 2030 and analysis of growth prospects)
- 5.1 Function
- 5.1.1 Fungicide
- 5.1.2 Herbicide
- 5.1.3 Insecticide
- 5.1.4 Molluscicide
- 5.1.5 Nematicide
- 5.2 Application Mode
- 5.2.1 Chemigation
- 5.2.2 Foliar
- 5.2.3 Fumigation
- 5.2.4 Seed Treatment
- 5.2.5 Soil Treatment
- 5.3 Crop Type
- 5.3.1 Commercial Crops
- 5.3.2 Fruits & Vegetables
- 5.3.3 Grains & Cereals
- 5.3.4 Pulses & Oilseeds
- 5.3.5 Turf & Ornamental
6 COMPETITIVE LANDSCAPE
- 6.1 Key Strategic Moves
- 6.2 Market Share Analysis
- 6.3 Company Landscape
- 6.4 Company Profiles (includes Global level Overview, Market level overview, Core Business Segments, Financials, Headcount, Key Information, Market Rank, Market Share, Products and Services, and analysis of Recent Developments)
- 6.4.1 ADAMA Agricultural Solutions Ltd
- 6.4.2 BASF SE
- 6.4.3 Bayer AG
- 6.4.4 Corteva Agriscience
- 6.4.5 FMC Corporation
- 6.4.6 Nufarm Ltd
- 6.4.7 PT Biotis Agrindo
- 6.4.8 Syngenta Group
- 6.4.9 UPL limited
- 6.4.10 Wynca Group (Wynca Chemicals)
7 KEY STRATEGIC QUESTIONS FOR CROP PROTECTION CHEMICALS CEOS
8 APPENDIX
- 8.1 Global Overview
- 8.1.1 Overview
- 8.1.2 Porter's Five Forces Framework
- 8.1.3 Global Value Chain Analysis
- 8.1.4 Market Dynamics (DROs)
- 8.2 Sources & References
- 8.3 List of Tables & Figures
- 8.4 Primary Insights
- 8.5 Data Pack
- 8.6 Glossary of Terms
インドネシアの作物保護化学品市場:市場シェア分析、産業動向と統計、成長予測(2025~2030年)
- 発行日
- 発行
- Mordor Intelligence
- ページ情報
- 英文 204 Pages
- 納期
- 2~3営業日


