
|
市場調査レポート
商品コード
1683154
ベトナムの作物保護化学品市場-市場シェア分析、産業動向と統計、成長予測(2025年~2030年)Vietnam Crop Protection Chemicals - Market Share Analysis, Industry Trends & Statistics, Growth Forecasts (2025 - 2030) |
||||||
カスタマイズ可能
適宜更新あり
|
|||||||
| ベトナムの作物保護化学品市場-市場シェア分析、産業動向と統計、成長予測(2025年~2030年) |
|
出版日: 2025年03月18日
発行: Mordor Intelligence
ページ情報: 英文 202 Pages
納期: 2~3営業日
|

全表示
- 概要
- 目次
概要
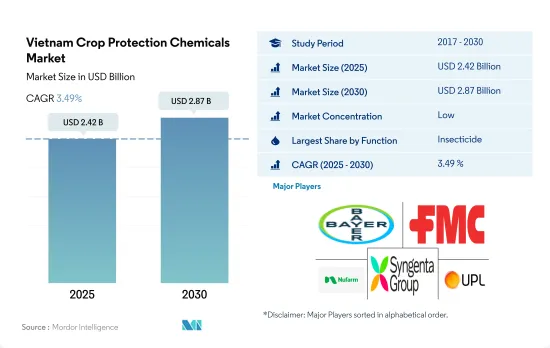
ベトナムの作物保護化学品市場規模は2025年に24億2,000万米ドルと推定・予測され、2030年には28億7,000万米ドルに達し、予測期間(2025~2030年)のCAGRは3.49%で成長すると予測されています。
殺虫剤の需要は、害虫や病害の効果的な駆除の必要性が原動力となっています。
- ベトナムの作物保護化学品市場は2022年に22億米ドルと評価されました。同国は多様な農産物の重要な生産国であり輸出国でもあります。
- 2022年には、殺菌剤がベトナムの作物保護化学品市場で16.7%のシェアを占め、2番目に大きなセグメントとなります。同国の農業従事者は、作物を菌類による病気から守り、最適な収量を確保するために殺菌剤に依存しています。市場を牽引しているのは、穀物、穀類、豆類、油糧種子、果物、野菜といった主要作物の栽培であり、これらの作物はさび病、フザリウム萎凋病、根腐病、うどんこ病、紋枯病といった真菌感染症にかかりやすいです。2022年のシェアは殺虫剤が66.4%、除草剤が15.1%でした。
- 線虫の蔓延は、コメ、コーヒー、野菜、果樹園などの作物に脅威を与えています。耕作地の80%を占める稲は、年間10~20%もの収量減に見舞われ、線虫剤散布の必要性が高まっています。このような要因が、このセグメントの成長につながる可能性があります。
- ベトナムの作物保護化学品市場の成長は、現在進行中の農業開拓と同国における商業作物栽培の拡大と密接に関連しています。ベトナムは農業セグメントで著しい発展を遂げており、特に天然ゴムのような作物では世界第3位の生産国となっています。
- 天然ゴムの収穫面積は2018年から9.1%増加し、2022年には75万2,100ヘクタールに達します。農業部門が拡大を続ける中、作物を保護し収量を向上させるための様々な作物保護剤に対する需要も相応に増加すると考えられます。そのため、予測期間中(2023~2029年)の同市場のCAGRは3.7%を記録すると予想されます。
ベトナムの作物保護化学品市場動向
気候変動により害虫の侵入が増加し、農作物保護化学品市場を牽引
- ベトナムの作物保護化学品部門は同国経済において非常に重要な位置を占めています。しかし、このセグメントでは雑草、害虫、菌類病という顕著な困難に遭遇し、毎年かなりの作物損失につながっています。こうした課題に対処するため、同国では2022年に農地1ヘクタール当たり平均1.1キログラムの作物保護化学品が使用されました。
- ベトナムでは、殺菌剤が化学作物保護化学品の主流となっており、農業部門で広く使用されています。同国の農地1ヘクタール当たりの殺菌剤の平均消費量は、2022年には0.6キログラムとなります。ベトナムにおける殺菌剤への依存度の増加には、気候条件の変化などの要因が一役買っています。真菌性病害の蔓延は様々な作物品種に大きな脅威をもたらし、大幅な収量減と収穫された作物の全体的な品質の低下を引き起こしています。その結果、ベトナムの農業従事者はこれらの病害を防除し、効果的に管理するために殺菌剤に大きく依存しています。
- ベトナムでは、除草剤が作物保護化学品消費量の第2位を占めています。2022年、1ヘクタール当たりの除草剤の平均散布量は0.2キログラムでした。しかし、遺伝子組み換え品種を含む除草剤耐性作物の採用や、雑草を防除して収穫ロスを最小限に抑える必要性から、散布量が増え、複数の除草剤を使用するようになっています。
- 気象パターンの変化や、抵抗性を発達させた昆虫の個体数の増加により、昆虫の存在感が増しています。これら両方の要因が、増大する害虫問題に対処するための殺虫剤の需要を押し上げています。2022年には、殺虫剤はベトナムで3番目に消費量の多い作物保護化学品タイプにランクされ、1ヘクタール当たりの平均散布量は0.2キログラムでした。
ベトナムは作物保護化学品の有効成分を生産する企業が限られているため、作物保護化学品の有効成分を輸入に依存しています。
- ベトナムは作物保護化学品有効成分を生産する企業が限られているため、作物保護化学品有効成分の輸入依存国です。2018年には同国で洪水が発生し、国内外を問わずサプライチェーンが寸断されました。その結果、輸送ルートが影響を受け、需要が増加し、有効成分の供給が制限されました。その結果、2018年には有効成分の価格が上昇しました。
- シペルメトリンは合成ピレスロイド系殺虫剤で、2022年には1トン当たり2万1,100米ドルと評価されました。ベトナムの穀物や豆類に影響を与える鱗翅目、鞘翅目、双翅目、半翅目の害虫を幅広く駆除します。同様に、イミダクロプリドは浸透性殺虫剤であり、2022年にはトン当たり1万7,200米ドルと評価されました。様々な作物の吸汁性昆虫や咀嚼性昆虫の防除に用いられます。
- アゾキシストロビンは広域スペクトル殺菌剤であり、真菌病原体(卵菌類、子のう菌類、子のう菌類、担子菌類など)に対して活性があります。フザリウム菌やトリコデルマ菌のような真菌の蔓延が増加したため、アゾキシストロビンの価格は2017年のトン当たり4,000米ドルから2022年にはトン当たり4,600米ドルに上昇しました。
- ペンディメタリンは選択的な出芽前除草剤であり、2022年には1トン当たり3,300米ドルと評価されました。ジャガイモ、タバコ、ソルガム、コメ、サトウキビの一年生草や広葉雑草を幅広く防除します。ベトナムは2022年にインドから約3,000トンのペンディメタリンを輸入します。
- 害虫の蔓延や病害の増加、作物保護化学品の有効成分の輸入依存は、これらの有効成分の価格に影響を与える可能性があります。
ベトナムの作物保護化学品産業概要
ベトナムの作物保護化学品市場はセグメント化されており、上位5社で20.54%を占めています。この市場の主要企業は、Bayer AG、FMC Corporation、Nufarm Ltd、Syngenta Group、UPL limitedです。
その他の特典
- エクセル形式の市場予測(ME)シート
- 3ヶ月のアナリストサポート
目次
第1章 エグゼクティブサマリーと主要調査結果
第2章 レポートのオファー
第3章 イントロダクション
- 調査の前提条件と市場定義
- 調査範囲
- 調査手法
第4章 主要産業動向
- 1ヘクタール当たりの作物保護化学品消費量
- 有効成分の価格分析
- 規制の枠組み
- ベトナム
- バリューチェーンと流通チャネル分析
第5章 市場セグメンテーション(市場規模(単位:米ドル、数量)、2030年までの予測、成長見込みの分析を含む)
- 機能
- 殺菌剤
- 除草剤
- 殺虫剤
- 殺軟体動物剤
- 殺線虫剤
- 適用モード
- 薬剤散布
- 葉面散布
- 燻蒸
- 種子処理
- 土壌処理
- 作物タイプ
- 商業作物
- 果物・野菜
- 穀物
- 豆類・油糧種子
- 芝・観賞用
第6章 競争情勢
- 主要な戦略的動き
- 市場シェア分析
- 企業情勢
- 企業プロファイル(世界レベル概要、市場レベル概要、主要な事業セグメント、財務、従業員数、主要情報、市場ランク、市場シェア、製品・サービス、最近の動向分析を含む)
- ADAMA Agricultural Solutions Ltd
- BASF SE
- Bayer AG
- Corteva Agriscience
- FMC Corporation
- Nufarm Ltd
- Syngenta Group
- UPL limited
- Wynca Group(Wynca Chemicals)
第7章 CEOへの主要戦略的質問
第8章 付録
- 世界概要
- 概要
- ファイブフォース分析フレームワーク
- 世界のバリューチェーン分析
- 市場力学(DROs)
- 情報源と参考文献
- 図表一覧
- 主要洞察
- データパック
- 用語集
目次
Product Code: 54985
The Vietnam Crop Protection Chemicals Market size is estimated at 2.42 billion USD in 2025, and is expected to reach 2.87 billion USD by 2030, growing at a CAGR of 3.49% during the forecast period (2025-2030).
The demand for pesticides is driven by the need for effective control of pests and diseases
- The market for crop protection chemicals in Vietnam was valued at USD 2.2 billion in 2022. The country is a significant producer and exporter of diverse agricultural commodities.
- In 2022, fungicides is the second largest segment with a share of 16.7% of the Vietnamese crop protection chemicals market. Farmers in the country rely on fungicides to protect crops from fungal diseases and ensure optimal yields. The market is driven by the cultivation of major crops such as grains, cereals, pulses, oilseeds, fruits, and vegetables, which are susceptible to fungal infections like rust, Fusarium wilt, root rot, powdery mildew, and common blight. Insecticides and herbicides held shares of 66.4% and 15.1% in 2022.
- Nematode infestations pose a threat to crops like rice, coffee, vegetables, and fruit orchards. Rice, which covers 80% of cultivated land, suffers annual yield losses of up to 10-20%, increasing the need for nematicide application. Such factors may lead to the growth of this segment.
- The growth of the crop protection chemicals market in Vietnam is closely linked to the ongoing agricultural development and the expansion of commercial crop cultivation in the country. Vietnam has witnessed significant progress in the agricultural sector, particularly in crops like natural rubber, for which it ranks as the third-largest global producer.
- The harvested area for natural rubber experienced a notable increase of 9.1% from 2018, reaching 752.1 thousand hectares in 2022. As the agricultural sector continues to expand, there will be a corresponding increase in the demand for various crop protection chemicals to safeguard crops and enhance yields. Thus, the market is expected to record a CAGR of 3.7% during the forecast period (2023-2029).
Vietnam Crop Protection Chemicals Market Trends
Due to climate change, pest infestations have been increasing in the country, driving the crop protection chemicals market
- Vietnam's agricultural sector holds great importance in the country's economy. However, the sector encounters notable difficulties in the form of weeds, insect pests, and fungal diseases, leading to substantial crop losses each year. To combat these challenges, the country used an average of 1.1 kilograms of crop protection chemicals per hectare of agricultural land in 2022.
- In Vietnam, fungicides have become the dominant type of chemical pesticide, being extensively used in the agricultural sector. The average consumption of fungicides per hectare of agricultural land in the country was 0.6 kilograms in 2022. Factors such as shifting climate conditions have played a role in the increased reliance on fungicides in Vietnam. The prevalence of fungal diseases poses a significant threat to various crop varieties, causing significant yield losses and compromising the overall quality of harvested crops. As a result, Vietnamese farmers heavily depend on fungicides to control and effectively manage these diseases.
- In Vietnam, herbicides hold the second position in terms of pesticide consumption. In 2022, the average amount of herbicides applied per hectare was 0.2 kilograms. However, the adoption of herbicide-tolerant crops, including genetically modified varieties, and the need to control weeds and minimize yield losses lead to higher application rates and the use of multiple herbicides.
- The presence of insects is growing due to shifting weather patterns and rising insect populations that have developed resistance. Both these factors have driven the demand for insecticides to combat the growing pest issues. In 2022, insecticides ranked as the third most consumed type of pesticide in Vietnam, with an average application rate of 0.2 kilograms per hectare.
Vietnam is an import-dependent country for crop protection chemicals' active ingredients, as there are limited companies producing active ingredients for pesticides
- Vietnam is an import-dependent country for crop protection chemicals' active ingredients, as there are limited companies producing active ingredients for pesticides. In 2018, a flood in the country disrupted supply chains, both domestically and internationally. As a result, transportation routes were affected, leading to increased demand and a limited supply of active ingredients. As a result, the prices of active ingredients increased in 2018.
- Cypermethrin is a synthetic pyrethroid insecticide, which was valued at USD 21.1 thousand per metric ton in 2022. It controls a wide range of lepidoptera, coleoptera, diptera, and hemipteran pests that affect cereals and pulses in Vietnam. Similarly, imidacloprid is a systemic insecticide, which was valued at USD 17.2 thousand per metric ton in 2022. It is used to control sucking and chewing insects in various crops.
- Azoxystrobin is a broad-spectrum fungicide that is active against fungal pathogens, including oomycetes, ascomycetes, deuteromycetes, and basidiomycetes. Owing to the increase in infestation of fungi like Fusarium and Trichoderma, the price of azoxystrobin increased from USD 4.0 thousand per metric ton in 2017 to USD 4.6 thousand per metric ton in 2022.
- Pendimethalin is a selective pre-emergence herbicide, which was valued at USD 3.3 thousand per metric ton in 2022. It provides broad-spectrum control of annual grasses and broadleaf weeds in potato, tobacco, sorghum, rice, and sugarcane. Vietnam imported around 3.0 thousand metric ton of pendimethalin from India in 2022.
- An increase in pest infestations and diseases and the dependence on imports for the active ingredients of crop protection chemicals in the country may influence the prices of these active ingredients.
Vietnam Crop Protection Chemicals Industry Overview
The Vietnam Crop Protection Chemicals Market is fragmented, with the top five companies occupying 20.54%. The major players in this market are Bayer AG, FMC Corporation, Nufarm Ltd, Syngenta Group and UPL limited (sorted alphabetically).
Additional Benefits:
- The market estimate (ME) sheet in Excel format
- 3 months of analyst support
TABLE OF CONTENTS
1 EXECUTIVE SUMMARY & KEY FINDINGS
2 REPORT OFFERS
3 INTRODUCTION
- 3.1 Study Assumptions & Market Definition
- 3.2 Scope of the Study
- 3.3 Research Methodology
4 KEY INDUSTRY TRENDS
- 4.1 Consumption Of Pesticide Per Hectare
- 4.2 Pricing Analysis For Active Ingredients
- 4.3 Regulatory Framework
- 4.3.1 Vietnam
- 4.4 Value Chain & Distribution Channel Analysis
5 MARKET SEGMENTATION (includes market size in Value in USD and Volume, Forecasts up to 2030 and analysis of growth prospects)
- 5.1 Function
- 5.1.1 Fungicide
- 5.1.2 Herbicide
- 5.1.3 Insecticide
- 5.1.4 Molluscicide
- 5.1.5 Nematicide
- 5.2 Application Mode
- 5.2.1 Chemigation
- 5.2.2 Foliar
- 5.2.3 Fumigation
- 5.2.4 Seed Treatment
- 5.2.5 Soil Treatment
- 5.3 Crop Type
- 5.3.1 Commercial Crops
- 5.3.2 Fruits & Vegetables
- 5.3.3 Grains & Cereals
- 5.3.4 Pulses & Oilseeds
- 5.3.5 Turf & Ornamental
6 COMPETITIVE LANDSCAPE
- 6.1 Key Strategic Moves
- 6.2 Market Share Analysis
- 6.3 Company Landscape
- 6.4 Company Profiles (includes Global level Overview, Market level overview, Core Business Segments, Financials, Headcount, Key Information, Market Rank, Market Share, Products and Services, and analysis of Recent Developments)
- 6.4.1 ADAMA Agricultural Solutions Ltd
- 6.4.2 BASF SE
- 6.4.3 Bayer AG
- 6.4.4 Corteva Agriscience
- 6.4.5 FMC Corporation
- 6.4.6 Nufarm Ltd
- 6.4.7 Syngenta Group
- 6.4.8 UPL limited
- 6.4.9 Wynca Group (Wynca Chemicals)
7 KEY STRATEGIC QUESTIONS FOR CROP PROTECTION CHEMICALS CEOS
8 APPENDIX
- 8.1 Global Overview
- 8.1.1 Overview
- 8.1.2 Porter's Five Forces Framework
- 8.1.3 Global Value Chain Analysis
- 8.1.4 Market Dynamics (DROs)
- 8.2 Sources & References
- 8.3 List of Tables & Figures
- 8.4 Primary Insights
- 8.5 Data Pack
- 8.6 Glossary of Terms

