
米国の作物保護化学品-市場シェア分析、産業動向と統計、成長予測(2025年~2030年)
US Crop Protection Chemicals - Market Share Analysis, Industry Trends & Statistics, Growth Forecasts (2025 - 2030)- 発行日
- ページ情報
- 英文 219 Pages
- 納期
- 2~3営業日
- 商品コード
- 1687042
- カスタマイズ可能 お客様のご希望に応じて、既存データの加工や未掲載情報(例:国別セグメント)の追加などの対応が可能です。詳細はお問い合わせください。
- 適宜更新あり 本レポートは最新情報反映のため適宜更新し、内容構成変更を行う場合があります。ご検討の際はお問い合わせください。
- 翻訳ツール提供対象 PDF対応AI翻訳ツールの無料貸し出しサービスのご利用が可能です
概要
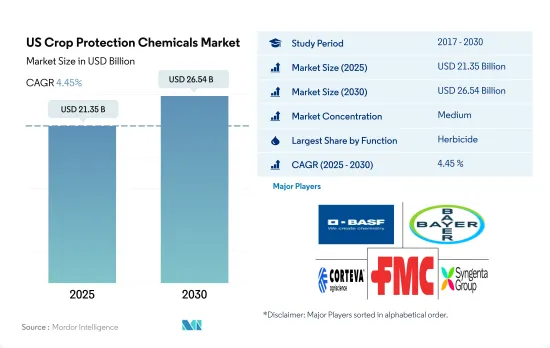
米国の作物保護化学品市場規模は2025年に213億5,000万米ドルと推定され、2030年には265億4,000万米ドルに達すると予測され、予測期間中(2025年~2030年)のCAGRは4.45%で成長する見込みです。
雑草蔓延の増加、労働力不足、賃金上昇、食糧増産の必要性が同国の除草剤市場を牽引する可能性
- 農業は米国経済において重要な役割を果たしており、同国のGDPに大きく貢献しています。しかし、病害虫は農作物生産を著しく脅かし、収量の減少、農家の経済的損失、食糧安全保障上の懸念につながっています。米国は、小麦、トウモロコシ、大豆などの穀物、豆類、油糧種子の主要生産国であり、他国への輸出国でもあります。米国は、2022年の北米の農作物保護化学品市場額の82.4%という高いシェアを占めています。
- 作物に対する雑草の攻撃は全米で最も一般的です。キャッチウィード・ベッドストロー、野バインドウィード、スギナなどは、作物を破壊するとされる一般的な雑草です。国内外でトウモロコシと小麦の需要が伸びているため、雑草の管理は国内では必須となっています。このため、同国では除草剤の需要が増加しており、2022年には金額ベースで53.3%と最も高いシェアを占めました。
- 同時に、油糧種子作物や園芸作物における昆虫の侵入は、同国の農業生産性に大きな課題をもたらしています。一般的な昆虫には、マメコガネ、ブドウコラスピス、オオヨコバイ、アブラムシなどがあります。イミダクロプリドやチアメトキサムを含むネオニコチノイド系殺虫剤を種子に直接散布するのが効果的な解決策と考えられています。殺虫剤市場は2022年の金額シェアで37.5%と2番目に高いです。
- 食糧安全保障への関心の高まりとさまざまな開発により、農家は作物への害虫の影響を最小限に抑えながら、効率的かつ持続可能な食糧生産を行うようになりました。これが市場を牽引しており、予測期間中(2023年~2029年)のCAGRは4.7%になると予測されています。
米国の作物保護化学市場動向
除草剤耐性の雑草種の増加により、より優れた防除のために高い散布量が必要とされています。
- 米国では1ヘクタール当たりの農薬消費量が大幅に増加しています。2022年には、この消費量は2017年と比較して1ヘクタール当たり618g増加しました。この1ヘクタール当たりの農薬使用量の増加には、気候変動などいくつかの要因があります。熱帯・亜熱帯の温暖多湿な気候が各地に広がったことで、多様な作物の栽培に適した環境が生まれました。しかし、同じ気候が雑草や害虫、病気の繁殖も助長しているため、作物を保護し生産性を維持するために農薬の散布量を増やす必要があります。
- すべての作物保護化学物質の中で、除草剤は消費量が大幅に増加し、2017年と比較して2022年には1ヘクタール当たり462g増加しました。この急増は主に、除草剤耐性の雑草種の増加に起因すると考えられます。国内で最も広く使用されている除草剤であるグリホサートは、他の選択肢と比較して費用対効果が高いため、ほとんどの農家にとって雑草防除の主要な方法となっています。しかし、グリホサートの多用は雑草の抵抗性開発につながり、14種の雑草がグリホサートに対して抵抗性を示しています。その結果、1ヘクタール当たりの除草剤使用量は増加しています。
- 国内の熱帯・亜熱帯地域では、単一栽培や不耕起栽培が普及しています。こうした慣行は病害虫の蔓延を招き、作物の大幅な損失につながり、1ヘクタール当たりの殺菌剤と殺虫剤の消費量が大幅に増加しています。具体的には、2017年から2022年の間に、殺菌剤の使用量は1ヘクタール当たり43g、殺虫剤の使用量は1ヘクタール当たり115g増加しています。
アブラムシ、カイガラムシ、斑点玉虫、ピンク玉虫、早期斑点虫、毛虫など様々な害虫を防除する効果があり、国内で入手可能な有効成分が限られているため、価格が上昇しています。
- 2022年、シペルメトリンの価格は1トン当たり2万1,200米ドルでした。アブラムシ、カイガラムシ、斑点玉虫、ピンク玉虫、早期斑点虫、毛虫など、さまざまな種類の害虫を防除する効果があるため、農業業界で広く採用されています。その有効性から、作物を害虫から守り、収穫を成功させたい農家にとって、人気の高い選択肢となっています。
- アトラジンは、塩素化トリアジン系に属する浸透性除草剤で、一年生草や広葉雑草の出芽前対策に使用されます。アトラジンを含む農薬製剤は、トウモロコシ、スイートコーン、ソルガム、サトウキビ、小麦、マカデミアナッツ、グアバなどさまざまな農作物への散布が承認されているほか、育苗/オーナメンタルや芝管理といった非農業用途にも使用されています。アトラジンの2022年の価格は1トン当たり1万3,800米ドルでした。
- マラチオンは、アブラムシ、ノミ、その他の吸汁性害虫など、いくつかの貴重な作物の害虫駆除に幅広く使用されています。米国で広く栽培され、マラチオンを頻繁に使用する作物は、ミニトマト、ブロッコリー、マルベリー、クランベリー、イチジクの5種類です。マラチオンの2022年の価格は1トン当たり1万2,600米ドルでした。
- マンコゼブは広範囲の接触殺菌剤で、米国では多くの果実、野菜、ナッツ、畑作物に使用することができます。ジャガイモの疫病、葉斑病、かさぶた、さび病など、広範な菌類病害を予防します。ジャガイモ、トウモロコシ、ソルガム、トマト、穀物などの作物の種子治療剤としても機能します。2022年の市場価値は1トン当たり7,800米ドルに達しました。
米国の作物保護化学品産業の概要
米国の作物保護化学品市場は適度に統合されており、上位5社で45.79%を占めています。この市場の主要企業は以下の通りです。 BASF SE, Bayer AG, Corteva Agriscience, FMC Corporation and Syngenta Group(sorted alphabetically).
その他の特典
- エクセル形式の市場予測(ME)シート
- 3ヶ月のアナリストサポート
目次
第1章 エグゼクティブサマリーと主な調査結果
第2章 レポートのオファー
第3章 イントロダクション
- 調査の前提条件と市場定義
- 調査範囲
- 調査手法
第4章 主要産業動向
- 1ヘクタール当たりの農薬消費量
- 有効成分の価格分析
- 規制の枠組み
- 米国
- バリューチェーンと流通チャネル分析
第5章 市場セグメンテーション
- 機能
- 殺菌剤
- 除草剤
- 殺虫剤
- 軟体動物駆除剤
- 殺線虫剤
- 適用モード
- 薬剤散布
- 葉面散布
- 燻蒸
- 種子治療
- 土壌治療
- 作物タイプ
- 商業作物
- 果物・野菜
- 穀物
- 豆類・油糧種子
- 芝・観賞用
第6章 競争情勢
- 主要な戦略的動き
- 市場シェア分析
- 企業情勢
- 企業プロファイル
- ADAMA Agricultural Solutions Ltd
- American Vanguard Corporation
- BASF SE
- Bayer AG
- Corteva Agriscience
- FMC Corporation
- Nufarm Ltd
- Sumitomo Chemical Co. Ltd
- Syngenta Group
- UPL Limited
第7章 CEOへの主な戦略的質問
第8章 付録
- 世界概要
- 概要
- ファイブフォース分析フレームワーク
- 世界のバリューチェーン分析
- 市場力学(DROs)
- 情報源と参考文献
- 図表一覧
- 主要洞察
- データパック
- 用語集
目次
Product Code: 54017
The US Crop Protection Chemicals Market size is estimated at 21.35 billion USD in 2025, and is expected to reach 26.54 billion USD by 2030, growing at a CAGR of 4.45% during the forecast period (2025-2030).
Rise in weed infestations, shortage of labor, increased wages, and need for higher food production may drive the herbicide market in the country
- Agriculture plays a vital role in the US economy, contributing significantly to the country's GDP. However, pests and diseases significantly threaten crop production, leading to reduced yields, financial losses to farmers, and food security concerns. The country is the major producer and exporter of cereals, pulses, and oilseeds to other countries, such as wheat, maize, and soybeans. The United States occupied the highest share of 82.4% of the North American crop protection chemicals market value in 2022.
- Weed attacks on crops are the most common across the country. Catchweed bedstraw, field bindweed, and horsetail are some common weeds that are considered crop-devastating. With the growing demand for maize and wheat domestically and internationally, the management of weeds has become imperative in the country. This has increased the demand for herbicides in the country, which occupied the highest share of 53.3% by value in 2022.
- At the same time, insect infestations in oilseed and horticultural crops pose a significant challenge to the country's agricultural productivity. Common insects include bean-leaf beetles, grape colaspis, leafhoppers, and aphids. Direct application of neonicotinoid insecticides, including imidacloprid or thiamethoxam on seeds, is considered an effective solution. The insecticide market occupied the second-highest share of 37.5% by value in 2022.
- Increased concerns for food security and various developments have facilitated the efficient and sustainable production of food by farmers while minimizing the impact of pests on their crops. This has driven the market, which is anticipated to witness a CAGR of 4.7% during the forecast period (2023-2029).
US Crop Protection Chemicals Market Trends
The rise in herbicide-resistant weed species is necessitating higher application rates for better control
- There has been significant growth in the consumption of pesticides per hectare in the United States. In 2022, this consumption increased by 618 g per hectare compared to 2017. Several factors contributed to this escalated use of pesticides per hectare, including climate change. The prevalence of tropical and subtropical warm and humid conditions in various regions has created favorable environment for cultivating diverse crops. However, this same climate has also fostered the growth of weeds, pests, and diseases, necessitating a higher application of pesticides to protect crops and maintain productivity.
- Among all crop protection chemicals, herbicides experienced a significant increase in consumption, rising by 462 g per hectare in 2022 compared to 2017. This surge may be mainly attributed to the rise in herbicide-resistant weed species. Glyphosate, the most widely used herbicide in the country, serves as the primary method of weed control for most farmers due to its cost-effectiveness compared to other alternatives. However, the extensive use of glyphosate has led to the development of resistance in weed species, with 14 different weed species showing resistance against glyphosate. As a result, the consumption of herbicides per hectare has increased.
- In the country's tropical and subtropical regions, monoculture practices and the adoption of no-tillage practices are prevalent. These practices have resulted in the proliferation of pests and diseases, leading to significant crop losses and a substantial rise in the consumption of fungicides and insecticides per hectare. Specifically, between 2017 and 2022, there was an increase of 43 g per hectare in fungicide usage and 115 g per hectare in insecticide usage.
Effectiveness in controlling various insects such as aphids, beetles, spotted ball worms, pink ball worms, early spot borers, and hairy caterpillars, and limited availability of active ingredients in the country is raising the price
- In 2022, cypermethrin was priced at USD 21.2 thousand per metric ton. It has been widely adopted in the agricultural industry for its effectiveness in controlling various types of insects, including aphids, beetles, spotted ball worms, pink ball worms, early spot borers, and hairy caterpillars. Its effectiveness has made it a popular choice for farmers seeking to protect their crops from pests and ensure a successful harvest.
- Atrazine, a systemic herbicide belonging to the chlorinated triazine group, is utilized for targeted control of annual grasses and broadleaf weeds prior to their emergence. Pesticide formulations containing atrazine are approved for application on various agricultural crops such as corn, sweet corn, sorghum, sugarcane, wheat, macadamia nuts, and guava, in addition to non-agricultural applications like nursery/ornamental and turf management. Atrazine was priced at USD 13.8 thousand per metric ton in 2022.
- Malathion is used to control a wide range of pests, including aphids, fleas, and other sucking pests on several valuable crops. Five crops that are extensively grown in the United States that use malathion frequently are cherry tomatoes, broccoli, mulberries, cranberries, and figs. Malathion was priced at USD 12.6 thousand per metric ton in 2022.
- Mancozeb is a broad-spectrum contact fungicide that is labeled for use on many fruits, vegetables, nuts, and field crops in the United States. It provides protection against a wide spectrum of fungal diseases, including potato blight, leaf spot, scab, and rust. It serves as a seed treatment for crops such as potatoes, corn, sorghum, tomatoes, and cereal grains. In 2022, its market value reached USD 7.8 thousand per metric ton.
US Crop Protection Chemicals Industry Overview
The US Crop Protection Chemicals Market is moderately consolidated, with the top five companies occupying 45.79%. The major players in this market are BASF SE, Bayer AG, Corteva Agriscience, FMC Corporation and Syngenta Group (sorted alphabetically).
Additional Benefits:
- The market estimate (ME) sheet in Excel format
- 3 months of analyst support
TABLE OF CONTENTS
1 EXECUTIVE SUMMARY & KEY FINDINGS
2 REPORT OFFERS
3 INTRODUCTION
- 3.1 Study Assumptions & Market Definition
- 3.2 Scope of the Study
- 3.3 Research Methodology
4 KEY INDUSTRY TRENDS
- 4.1 Consumption Of Pesticide Per Hectare
- 4.2 Pricing Analysis For Active Ingredients
- 4.3 Regulatory Framework
- 4.3.1 United States
- 4.4 Value Chain & Distribution Channel Analysis
5 MARKET SEGMENTATION (includes market size in Value in USD and Volume, Forecasts up to 2030 and analysis of growth prospects)
- 5.1 Function
- 5.1.1 Fungicide
- 5.1.2 Herbicide
- 5.1.3 Insecticide
- 5.1.4 Molluscicide
- 5.1.5 Nematicide
- 5.2 Application Mode
- 5.2.1 Chemigation
- 5.2.2 Foliar
- 5.2.3 Fumigation
- 5.2.4 Seed Treatment
- 5.2.5 Soil Treatment
- 5.3 Crop Type
- 5.3.1 Commercial Crops
- 5.3.2 Fruits & Vegetables
- 5.3.3 Grains & Cereals
- 5.3.4 Pulses & Oilseeds
- 5.3.5 Turf & Ornamental
6 COMPETITIVE LANDSCAPE
- 6.1 Key Strategic Moves
- 6.2 Market Share Analysis
- 6.3 Company Landscape
- 6.4 Company Profiles (includes Global level Overview, Market level overview, Core Business Segments, Financials, Headcount, Key Information, Market Rank, Market Share, Products and Services, and analysis of Recent Developments)
- 6.4.1 ADAMA Agricultural Solutions Ltd
- 6.4.2 American Vanguard Corporation
- 6.4.3 BASF SE
- 6.4.4 Bayer AG
- 6.4.5 Corteva Agriscience
- 6.4.6 FMC Corporation
- 6.4.7 Nufarm Ltd
- 6.4.8 Sumitomo Chemical Co. Ltd
- 6.4.9 Syngenta Group
- 6.4.10 UPL Limited
7 KEY STRATEGIC QUESTIONS FOR CROP PROTECTION CHEMICALS CEOS
8 APPENDIX
- 8.1 Global Overview
- 8.1.1 Overview
- 8.1.2 Porter's Five Forces Framework
- 8.1.3 Global Value Chain Analysis
- 8.1.4 Market Dynamics (DROs)
- 8.2 Sources & References
- 8.3 List of Tables & Figures
- 8.4 Primary Insights
- 8.5 Data Pack
- 8.6 Glossary of Terms
米国の作物保護化学品-市場シェア分析、産業動向と統計、成長予測(2025年~2030年)
- 発行日
- 発行
- Mordor Intelligence
- ページ情報
- 英文 219 Pages
- 納期
- 2~3営業日