
|
市場調査レポート
商品コード
1906948
バイオスティミュラント:市場シェア分析、業界動向と統計、成長予測(2026年~2031年)Biostimulants - Market Share Analysis, Industry Trends & Statistics, Growth Forecasts (2026 - 2031) |
||||||
カスタマイズ可能
適宜更新あり
|
|||||||
| バイオスティミュラント:市場シェア分析、業界動向と統計、成長予測(2026年~2031年) |
|
出版日: 2026年01月12日
発行: Mordor Intelligence
ページ情報: 英文 120 Pages
納期: 2~3営業日
|

概要
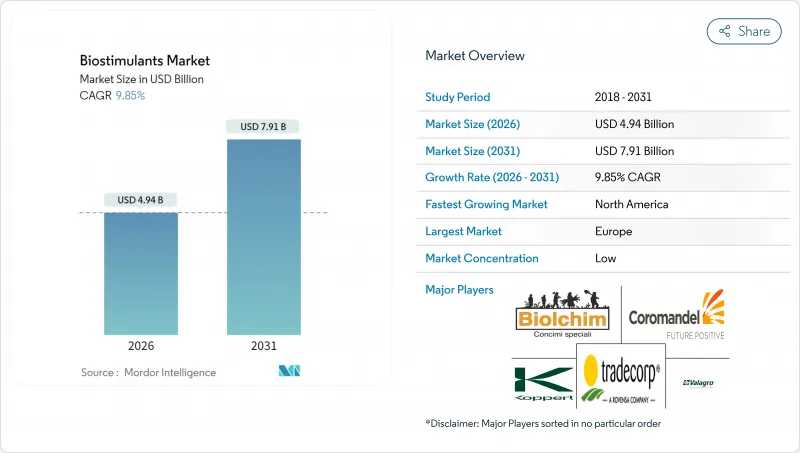
バイオスティミュラント市場は2025年に45億米ドルと評価され、2026年の49億4,000万米ドルから2031年までに79億1,000万米ドルに達すると予測されています。
予測期間(2026-2031年)におけるCAGRは9.85%と見込まれます。
持続可能な作物投入物への需要急増、規制定義の整合性強化、生物学的資材と収量安定性の関連性を示す証拠の蓄積が、この成長勢いを支えています。農家はストレス耐性範囲の拡大と新たな炭素クレジット制度への適格性確保のため、従来の肥沃度管理プログラムにバイオスティミュラントを統合しています。一方、メーカーは微生物群集とアミノ酸・フミン酸を組み合わせた製品の投入を加速し、幅広い互換性を追求しています。欧州は規制の早期明確化によりイノベーション拠点としての役割を継続していますが、北米では米国農務省の「気候スマート商品パートナーシップ」制度(圃場レベルでの施用コストの最大75%を補助)により、現在最も急激な導入曲線を示しています。さらに米国植物栄養管理官協会(AAPFCO)の取り組みにより、全米管轄区域での登録経路が標準化され、承認期間が約3分の1短縮されたことで、世界の拡大が後押しされています。
世界のバイオスティミュラント市場の動向と洞察
有機食品製品への需要拡大
米国における有機農地は継続的に拡大しており、生物学的投入物で栽培された農産物に対して消費者がプレミアム価格を支払う意思があることを裏付けています。欧州の「農場から食卓まで」枠組みは、2030年までに農地の25%を有機化することを目標としており、移行期間中の収量確保を目指す生産者によるバイオスティミュラントの導入を加速させています。米国国家有機プログラムのガイダンスでは、承認されたバイオスティミュラントのカテゴリーが明記され、認証に関する従来の曖昧さが解消されました。専門小売チャネルでの需要急増も相まって価格実現が強化され、高純度アミノ酸抽出物や海藻抽出物に対する農場レベルの投資収益率を押し上げています。
政府補助金と支援規制
気候スマート商品パートナーシップは、持続可能な実践に対する償還金として多額の資金を確保しており、対象となる生産者はバイオスティミュラント費用の最大75%を回収できます。カリフォルニア州の健全な土壌プログラムでは、追加の費用分担助成金が重ねて適用されます。業界側では、米国植物栄養管理官協会が州ごとの定義を統一し、製造業者向けの重複するデータ提出手順を削減するとともに、製品展開を迅速化しました。欧州の共通農業政策エコスキームにおける同様の整合性により、農家はバイオスティミュラントを栄養管理計画に組み込んだ後、支払いを請求することが可能となります。
不均一な規制上の定義
欧州連合(EU)域外では、多くの管轄区域が依然としてバイオスティミュラントを農薬法規に分類しており、毒性データ要件が追加されることでコンプライアンスコストが増大しています。東南アジアやアフリカ諸国では、専用の審査委員会が設置されていない場合が多く、市場参入が最大2シーズン遅れることがあります。国際標準化機構(ISO)の作業部会が世界のガイドラインの策定を目指していますが、実施スケジュールは2027年以降にずれ込む見込みです。
セグメント分析
アミノ酸は2025年の収益の30.62%を占め、高付加価値園芸における非生物的ストレス対策として、施肥灌漑や葉面散布プログラムで広く受け入れられていることが確認されました。1エーカーあたり40米ドル~80米ドルの比較収益が15米ドル~25米ドルの投入コストを相殺するため、トマト、ピーマン、キュウリ栽培システムでの継続的な使用が促進されています。点滴灌漑薬剤との互換性と実証済みの保存安定性が、保護栽培生産者の継続的な支持を支えています。園芸統合業者も、国家有機プログラム(NOP)規則の遵守を目指す際にアミノ酸を好んで採用します。これは、ほとんどの酵素加水分解経路が有機加工基準に適合するためです。水溶性フミン酸は引き続き急成長サブカテゴリーであり、2031年までに12.45%のCAGRで推移すると予測されています。微量栄養素をキレート化し陽イオン交換容量を改善する土壌改良メカニズムは、根圏の健全性に注力するトウモロコシや大豆生産者に支持されています。
メーカー各社は、従来型の尿素アンモニウム硝酸塩溶液との相互互換性を強調し、主流の列作作物における使用拡大を図っています。改良されたプリルコーティング技術により粒子径が均一化され、従来使用を妨げていた設備詰まりが回避されています。タンパク質加水分解物は、動物由来のアミノ酸ブレンドが窒素と炭素を一度の施用で供給する認証有機チェーンにおいて、シェアを拡大し続けています。海藻抽出物は依然として不可欠ですが、供給量の変動に直面しており、精密発酵技術を用いた合成類似体の開発が促進されています。フルボ酸は、可変率散布機を導入する精密農業従事者の間で支持を集めており、その低分子量が組織への迅速な浸透を可能にし、マルチスペクトルドローン画像による一貫した反応モニタリングを実現します。
バイオスティミュラント市場レポートは、形態別(アミノ酸、フルボ酸、フミン酸など)、作物タイプ別(換金作物、園芸作物、畑作物)、地域別(北米、南米、欧州など)に分類されています。市場予測は金額(米ドル)および数量(メトリックトン)で提供されます。
地域別分析
欧州は、成熟した規制インフラと共通農業政策エコスキーム内の包括的な補助金制度を背景に、2025年に38.62%の価値シェアを維持しました。オランダの生産者は、施肥灌漑対応フミン酸を使用し、収量上限を保護しながら硝酸塩流出罰金を削減しています。デンマークの耕作農家は、有機農地25%目標を活用し、栄養計画にバイオスティミュラントを組み入れることを条件に優遇金利での銀行融資を確保。これにより財政的インセンティブと生物学的採用を連動させています。ポーランドやルーマニアの東欧生産者は、農村開発プログラムの柱を通じた知識移転と資金援助の恩恵を受け、同地域が継続的な主導的立場を維持する基盤を築いています。
北米地域は2031年までにCAGR12.35%という最高成長曲線を示しています。米国農務省のパートナーシップ助成金はアーチャー・ダニエルズ・ミッドランド社などの企業アグリゲーターを惹きつけ、複数州にまたがるパイロットプロジェクトのスポンサーとなり、作付面積の調整を促進しています。アイオワ州立大学やカンザス州立大学などの大学は、オープンアクセス型の圃場試験データセットを提供し、農場レベルの実験リスクを軽減することで、コーンベルト地域における普及を加速させています。カナダの持続可能な農業戦略も同様のインセンティブを反映しており、小麦やキャノーラ生産者が合成成長調整剤から生物学的増強剤へ切り替える際、温室効果ガス排出削減プロトコルの適用対象となることを可能にしております。
アジア太平洋地域では多層的な可能性が示されています。中国の国内生物農業指令ではバイオスティミュラントを戦略的投入資材として位置付けていますが、地方ごとの監督体制が分断されているため、均質な導入が遅れています。インドの有機認証移転制度は高付加価値のバスマティ米やマンゴー輸出の需要を押し上げていますが、高純度原料の供給は依然として不安定です。南米では主にブラジルで進展が見られ、大豆生産者が酸性土壌におけるアルミニウム毒性管理にフミン酸を採用しています。アルゼンチンの不耕起栽培システムでは、より広範な再生農業パッケージの一環として微生物種子コーティングが統合されています。中東・アフリカ地域は依然として発展途上ですが、イスラエルやモロッコでは灌漑制約のある園芸分野において、塩分緩和を目的としたフルボ酸根部灌注プロトコルの検討が始まっています。
その他の特典:
- エクセル形式の市場予測(ME)シート
- アナリストによる3ヶ月間のサポート
よくあるご質問
目次
第1章 イントロダクション
- 調査の前提条件と市場の定義
- 調査範囲
- 調査手法
第2章 レポート提供
第3章 エグゼクティブサマリーおよび主要な調査結果
第4章 主要な業界動向
- 有機栽培面積
- 有機製品への一人当たり支出額
- 規制の枠組み
- アルゼンチン
- オーストラリア
- ブラジル
- カナダ
- 中国
- エジプト
- フランス
- ドイツ
- インド
- インドネシア
- イタリア
- 日本
- メキシコ
- オランダ
- ナイジェリア
- フィリピン
- ロシア
- 南アフリカ
- スペイン
- タイ
- トルコ
- 英国
- 米国
- ベトナム
- バリューチェーン及び流通チャネル分析
- 市場促進要因
- 有機食品製品への需要拡大
- 政府補助金と支援的規制
- 持続可能性を重視した生産者による採用
- 収量および非生物的ストレス改善の証拠
- 種子コーティングと微量栄養素ブレンドの統合
- カーボンクレジットの収益化可能性
- 市場抑制要因
- 規制定義の不統一
- 農家の認知度不足と効果への懐疑
- 微生物接種剤およびバイオ肥料との競合
- 海藻原料の供給リスク
第5章 市場規模と成長予測(金額および数量)
- 形態別
- アミノ酸
- フルボ酸
- フミン酸
- タンパク質加水分解物
- 海藻エキス
- その他バイオスティミュラント市場
- 作物タイプ別
- 換金作物
- 園芸作物
- 畑作作物
- 地域別
- アフリカ
- 国別
- エジプト
- ナイジェリア
- 南アフリカ
- その他アフリカ
- 国別
- アジア太平洋地域
- 国別
- オーストラリア
- 中国
- インド
- インドネシア
- 日本
- フィリピン
- タイ
- ベトナム
- その他アジア太平洋地域
- 国別
- 欧州
- 国別
- フランス
- ドイツ
- イタリア
- オランダ
- ロシア
- スペイン
- トルコ
- 英国
- その他欧州地域
- 国別
- 中東
- 国別
- イラン
- サウジアラビア
- その他中東
- 国別
- 北米
- 国別
- カナダ
- メキシコ
- 米国
- その他北米地域
- 国別
- 南米
- 国別
- アルゼンチン
- ブラジル
- その他南米
- 国別
- アフリカ
第6章 競合情勢
- 主要な戦略的動き
- 市場シェア分析
- 企業概況
- 企業プロファイル
- Valagro(Syngenta Group)
- Trade Corporation International(Rovensa Group)
- Atlantica Agricola S.A.
- Agriculture Solutions Inc.
- Biolchim SpA(J. M. Huber Corporation)
- Coramandel International Limited
- UPL Ltd.
- BASF SE
- Bayer AG
- FMC Corporation
- Koppert Group
- Gowan Company
- Haifa Group(Trance Resource Minerals Pte.)
- BioAtlantis Ltd.
