
|
市場調査レポート
商品コード
1693770
インドのバイオスティミュラント:市場シェア分析、産業動向と統計、成長予測(2025年~2030年)India Biostimulants - Market Share Analysis, Industry Trends & Statistics, Growth Forecasts (2025 - 2030) |
||||||
カスタマイズ可能
適宜更新あり
|
|||||||
| インドのバイオスティミュラント:市場シェア分析、産業動向と統計、成長予測(2025年~2030年) |
|
出版日: 2025年03月18日
発行: Mordor Intelligence
ページ情報: 英文 137 Pages
納期: 2~3営業日
|

全表示
- 概要
- 目次
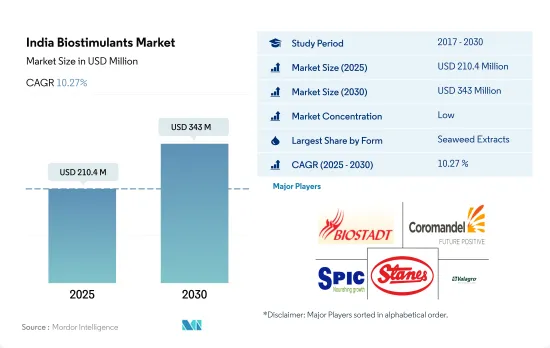
インドのバイオスティミュラント市場規模は2025年に2億1,040万米ドルと推定され、2030年には3億4,300万米ドルに達すると予測され、予測期間(2025~2030年)のCAGRは10.27%で成長すると予測されます。
- インドのバイオスティミュラント市場には、有効成分としてフミン酸、フルボ酸、アミノ酸、タンパク質加水分解物、海藻抽出物、キトサン、バイオポリマー、その他植物や動物由来のバイオスティミュラントなど、多くのバイオスティミュラントが使用されています。インドの生物刺激剤市場は2022年に1億5,320万米ドルと評価され、2017~2022年の間に15.7%成長しました。
- 海藻エキスの生物刺激剤はインドの生物刺激剤市場で最大の市場シェアを占め、2022年には37.4%を占め、2022年の市場規模は5,730万米ドルです。これは、ストレス耐性、根の成長、栄養と水の摂取、植物の成長、作物の収量を向上させる能力だけでなく、植物の全体的な健康を改善する能力によるものです。
- 2022年のバイオスティミュラント市場金額の86.2%は連作作物でした。これは、2022年における国内の有機作物総面積の約82.3%を連作作物が占めているためです。換金作物と園芸作物は、2022年のバイオ刺激剤市場のそれぞれ11.2%と2.6%を占めます。
- 有機食品の需要が増加しているため、インド政府は、国家園芸ミッション、北東・ヒマラヤ州園芸ミッション、ラシュトリヤ・クリシ・ヴィカス・ヨジャナ、土壌の健康と肥沃度の管理に関する国家プロジェクト、有機農業に関する国家プロジェクト、インド農業研究評議会の有機農業に関するネットワークプロジェクト、パランパラガット・クリシ・ヴィカス・ヨジャナなど、さまざまな計画を通じて有機作物、果物、野菜の生産を促進しています。こうした取り組みがインドのバイオスティミュラント市場を押し上げると考えられます。
- インドのバイオスティミュラント市場規模は、2023~2029年の間に81.2%成長し、CAGRは10.4%と予測されています。
インドのバイオスティミュラント市場動向
有機栽培生産者の増加により、主に連作作物の有機栽培面積が増加
- インドは、認定有機生産者の総数では世界最大の国であり、2019年には130万人の有機生産者がいます。多くの有機生産者がいるにもかかわらず、同国の有機栽培面積は同国の農業総面積の2.0%程度です。2021年には、同国の有機栽培面積は711,094.0ヘクタールと記録され、2017年と比較して約3.4%増加しました。国内の有機農業は一部の州に集中しています。国内の有機農業上位10州が有機作物総面積の約80.0%を占めています。マディヤ・プラデシュ州、ラジャスタン州、マハラシュトラ州のように、有機農業の普及率向上でリードしている州は少数です。マディヤ・プラデシュ州だけで2019年のインドの有機栽培面積の約27.0%を占めています。
- 同国では連作作物の有機栽培が優勢で、2021年には有機作物総栽培面積の約59.7%を占めました。穀物生産は米、小麦、雑穀、トウモロコシが主です。ほとんどの穀類作物はカリフ期(6月~9月)に栽培されます。この時期に栽培される作物は、主に雨に左右されるか、稲、トウモロコシ、綿花、大豆など、より多くの水を必要とするものです。
- 有機換金作物全体の栽培面積は、2017年の27万ヘクタールから2021年には28万ヘクタールに増加します。同国で生産される主要換金作物は、綿花、サトウキビ、紅茶、スパイスです。同国では現在、有機園芸作物の成長は限られています。有機製品に対する需要の高まりとインド政府の有機栽培への取り組みにより、2023~2029年にかけて有機作物の栽培面積が増加すると予想されます。
需要の高まりとeコマースチャネルによる入手の容易さにより、有機食品への1人当たり支出が増加
- インドのオーガニック製品に対する1人当たり支出は0.23米ドルと、アジア太平洋のオーガニック製品に対する1人当たり支出の平均と比べると比較的低いです。しかし近年は、オーガニック製品は免疫力が高く、品質が高く、eコマースチャネルを通じて入手しやすいと認識する顧客が増えたため、消費者の需要がオーガニック製品へとシフトしています。インドは有機食品と飲食品の有望な市場です。インド国内の有機飲食品産業は、2019~2024年にかけてCAGR13%で上昇し、2024年までに1億3,800万米ドルの規模になると予想されています。
- 2022年に国内で消費された有機飲食品の合計は1億800万米ドル相当でした。同国における有機製品の消費額は、2016年の4,500万米ドルから2021年には9,600万米ドルに増加しました。オーガニック食品の販売動向は、主に消費者意識の高まりにより増加傾向にあり、高所得の消費者がオーガニック飲食品の消費を促進しています。最も需要を獲得したカテゴリーには、有機卵、乳製品、果物・野菜などの必須食品が含まれます。
- 有機飲料消費が市場を独占し、2022年の有機食品と有機飲料の合計市場金額の約85.2%を占めました。有機飲料セグメントには、承認された認証機関によって認証された有機包装飲食品が含まれます。有機飲料の消費額は2020~2022年にかけてCAGR 14%で増加しました。有機製品に関連する価格プレミアムは、低所得層の消費者のアクセスを妨げ、有機食品消費の主要制限要因となっています。しかし、有機製品の積極的な販売促進と利点が、予測期間中の有機食品市場を牽引します。
インドのバイオスティミュラント産業概要
インドのバイオスティミュラント市場はセグメント化されており、上位5社で10.77%を占めています。この市場の主要企業は、Biostadt India Limited、Coromandel International Ltd、Southern Petrochemical Industries Corporation、T.Stanes、Company Limited、Valagroなどです。
その他の特典
- エクセル形式の市場予測(ME)シート
- 3ヶ月のアナリストサポート
目次
第1章 エグゼクティブサマリーと主要調査結果
第2章 レポートのオファー
第3章 イントロダクション
- 調査の前提条件と市場定義
- 調査範囲
- 調査手法
第4章 主要産業動向
- 有機栽培面積
- 一人当たりのオーガニック製品への支出
- 規制の枠組み
- インド
- バリューチェーンと流通チャネル分析
第5章 市場セグメンテーション
- 形態
- アミノ酸
- フルボ酸
- フミン酸
- タンパク質加水分解物
- 海藻エキス
- その他のバイオスティミュラント
- 作物タイプ
- 換金作物
- 園芸作物
- 畑作物
第6章 競争情勢
- 主要な戦略的動き
- 市場シェア分析
- 企業情勢
- 企業プロファイル
- Biostadt India Limited
- Coromandel International Ltd
- Corteva Agriscience
- GrowTech Agri Science Private Limited
- Gujarat State Fertilizers & Chemicals Ltd
- Indian Farmers Fertiliser Cooperative Limited
- Rallis India Ltd
- Southern Petrochemical Industries Corporation
- T.Stanes and Company Limited
- Valagro
第7章 CEOへの主要戦略的質問
第8章 付録
- 世界概要
- 概要
- ファイブフォース分析フレームワーク
- 世界のバリューチェーン分析
- 市場力学(DROs)
- 情報源と参考文献
- 図表一覧
- 主要な洞察
- データパック
- 用語集
The India Biostimulants Market size is estimated at 210.4 million USD in 2025, and is expected to reach 343 million USD by 2030, growing at a CAGR of 10.27% during the forecast period (2025-2030).
- Many biostimulants as active ingredients are used in the Indian biostimulants market, including humic acid, fulvic acid, amino acids, protein hydrolysates, seaweed extracts, chitosan, biopolymers, and other biostimulants such as plant and animal derivatives. The Indian biostimulants market was valued at USD 153.2 million in 2022 and grew by 15.7% between 2017 and 2022.
- Seaweed extract biostimulants have the largest market share in the Indian biostimulants market, accounting for 37.4% in 2022, with a market value of USD 57.3 million in 2022. This is due to their ability to improve the overall health of the plant, as well as their ability to improve stress tolerance, root growth, nutrition and water intake, plant growth, and crop yield.
- Row crops accounted for 86.2% of the biostimulants market value in 2022. This is because row crops accounted for approximately 82.3% of the total organic crop area in the country in 2022. Cash crops and horticultural crops account for 11.2% and 2.6% of the biostimulants market, respectively, in 2022.
- As the demand for organic food items is on the rise, the Indian government is promoting the production of organic crops, fruits, and vegetables through various schemes, like National Horticulture Mission, Horticulture Mission for North East and Himalayan States, Rashtriya Krishi Vikas Yojana, National Project on Management of Soil Health and Fertility, National Project on Organic Farming, Network Project on Organic Farming under Indian Council of Agricultural Research, and Paramparagat Krishi Vikas Yojana. These initiatives will boost the Indian biostimulants market.
- The Indian biostimulants market value is anticipated to grow between 2023 and 2029 by 81.2%, with a CAGR of 10.4%.
India Biostimulants Market Trends
Growing number of organic producers helping the increase in area under organic cultivation, primarily in row crops
- India is the largest country, in terms of the total number of certified organic producers in the world, with 1.3 million organic producers in 2019. Despite having a large number of organic producers, organic cultivation areas in the country account for around 2.0% of the total agriculture area in the country. In 2021, the organic area in the country was recorded as 711,094.0 hectares, which increased by about 3.4% compared to 2017. Organic farming in the country is concentrated in only a few states. The top ten organic farming states in the country account for about 80.0% of the total organic crop area. A few states have taken the lead in improving organic farming coverage, like Madhya Pradesh, Rajasthan, and Maharashtra, which are the top three organic farming states in the country. Madhya Pradesh alone accounted for about 27.0% of India's total organic cultivation area in 2019.
- Organic cultivation of row crops is dominant in the country, which accounted for about 59.7% of the total organic crop area in 2021. Cereal crop production is dominant rice, wheat, millet, and maize are the major cereals produced. Most cereal crops are grown in the kharif season (June - September). The crops grown in this season are mainly rain dependent or require more water, like rice, maize, cotton, and soybean.
- The overall organic cash crop cultivation area increased from 0.27 million hectares in 2017 to 0.28 million hectares in 2021. The major cash crops produced in the country are cotton, sugarcane, tea, and spices. There is a limited growth of organic horticultural crops currently in the country. The increasing demand for organic products and Indian government initiatives to go organic are anticipated to increase organic crop area between 2023 and 2029.
Growing demand and their easy accessibility through e-commerce channels, rising the per capita spending on organic food
- India's per capita spending on organic products is relatively low at USD 0.23 compared to the average per capita spending on organic products in Asia-Pacific. However, in recent years, shifting consumer demand has increased toward organic products as more customers perceive these items offer better immunity, higher quality, and more accessibility through e-commerce channels. India is a promising and developing market for organic foods and beverages. India's domestic organic food and beverage industry is expected to be worth USD 138.0 million by 2024, rising at a compound annual growth rate of 13% between 2019 to 2024.
- In 2022, the total combined organic food and beverages worth USD 108.0 million consumed in the country. The consumption value of organic products in the country increased from USD 45 million in 2016 to USD 96.0 million in 2021. Organic food sales have seen an increasing trend mainly due to increasing consumer awareness, and high-income consumers are propelling organic food and beverage consumption. Categories that gained the most demand included essential foods, such as organic eggs, dairy, and fruits and vegetables.
- Organic beverage consumption dominated the market and accounted for about 85.2% of the total combined organic food and beverages market value in 2022. The organic beverages segment includes organic packaged food and beverages that are certified by the approved certification body. Organic beverage consumption value increased at a CAGR of 14% between 2020 to 2022. The price premium associated with organic products hampers lower-income consumer access and is the major limiting factor for organic food consumption. However, organic products' active promotion and advantages drive the organic food market during the forecast period.
India Biostimulants Industry Overview
The India Biostimulants Market is fragmented, with the top five companies occupying 10.77%. The major players in this market are Biostadt India Limited, Coromandel International Ltd, Southern Petrochemical Industries Corporation, T.Stanes and Company Limited and Valagro (sorted alphabetically).
Additional Benefits:
- The market estimate (ME) sheet in Excel format
- 3 months of analyst support
TABLE OF CONTENTS
1 EXECUTIVE SUMMARY & KEY FINDINGS
2 REPORT OFFERS
3 INTRODUCTION
- 3.1 Study Assumptions & Market Definition
- 3.2 Scope of the Study
- 3.3 Research Methodology
4 KEY INDUSTRY TRENDS
- 4.1 Area Under Organic Cultivation
- 4.2 Per Capita Spending On Organic Products
- 4.3 Regulatory Framework
- 4.3.1 India
- 4.4 Value Chain & Distribution Channel Analysis
5 MARKET SEGMENTATION (includes market size in Value in USD and Volume, Forecasts up to 2030 and analysis of growth prospects)
- 5.1 Form
- 5.1.1 Amino Acids
- 5.1.2 Fulvic Acid
- 5.1.3 Humic Acid
- 5.1.4 Protein Hydrolysates
- 5.1.5 Seaweed Extracts
- 5.1.6 Other Biostimulants
- 5.2 Crop Type
- 5.2.1 Cash Crops
- 5.2.2 Horticultural Crops
- 5.2.3 Row Crops
6 COMPETITIVE LANDSCAPE
- 6.1 Key Strategic Moves
- 6.2 Market Share Analysis
- 6.3 Company Landscape
- 6.4 Company Profiles (includes Global Level Overview, Market Level Overview, Core Business Segments, Financials, Headcount, Key Information, Market Rank, Market Share, Products and Services, and Analysis of Recent Developments).
- 6.4.1 Biostadt India Limited
- 6.4.2 Coromandel International Ltd
- 6.4.3 Corteva Agriscience
- 6.4.4 GrowTech Agri Science Private Limited
- 6.4.5 Gujarat State Fertilizers & Chemicals Ltd
- 6.4.6 Indian Farmers Fertiliser Cooperative Limited
- 6.4.7 Rallis India Ltd
- 6.4.8 Southern Petrochemical Industries Corporation
- 6.4.9 T.Stanes and Company Limited
- 6.4.10 Valagro
7 KEY STRATEGIC QUESTIONS FOR AGRICULTURAL BIOLOGICALS CEOS
8 APPENDIX
- 8.1 Global Overview
- 8.1.1 Overview
- 8.1.2 Porter's Five Forces Framework
- 8.1.3 Global Value Chain Analysis
- 8.1.4 Market Dynamics (DROs)
- 8.2 Sources & References
- 8.3 List of Tables & Figures
- 8.4 Primary Insights
- 8.5 Data Pack
- 8.6 Glossary of Terms

