
|
市場調査レポート
商品コード
1939586
欧州のバイオスティミュラント:市場シェア分析、業界動向と統計、成長予測(2026年~2031年)Europe Biostimulants - Market Share Analysis, Industry Trends & Statistics, Growth Forecasts (2026 - 2031) |
||||||
カスタマイズ可能
適宜更新あり
|
|||||||
| 欧州のバイオスティミュラント:市場シェア分析、業界動向と統計、成長予測(2026年~2031年) |
|
出版日: 2026年02月09日
発行: Mordor Intelligence
ページ情報: 英文 100 Pages
納期: 2~3営業日
|

概要
欧州のバイオスティミュラント市場規模は、2026年には18億1,000万米ドルと推定され、2025年の17億1,000万米ドルから成長が見込まれます。
2031年までの予測では23億9,000万米ドルに達し、2026年から2031年にかけてCAGR5.78%で拡大する見通しです。
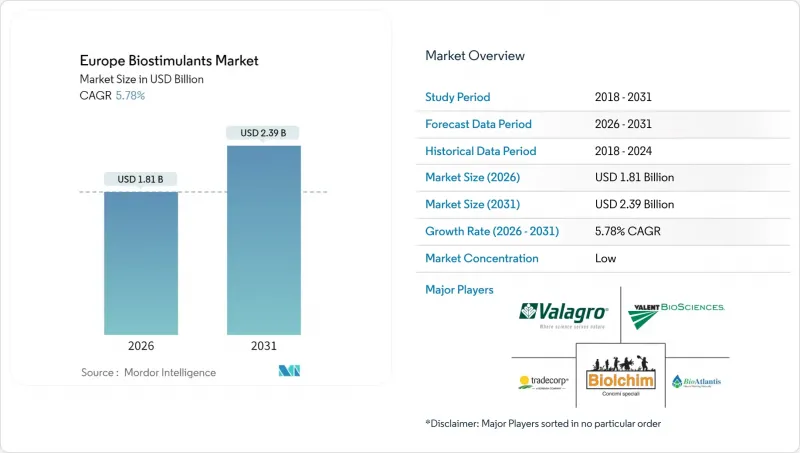
この見通しは、合成肥料の使用抑制に向けた政策圧力の加速、有機農地の拡大、および国境を越えた販売を円滑化する欧州適合性(CE)マーク製品の普及拡大を反映しています。技術改良により海藻抽出および微生物発酵コストが最大20%削減され、生物学的投入材は従来型肥料との価格差が縮小し、市場全体の成長軌道を強化しています。精密農業の導入は、特に作物の必要量に応じて生物刺激剤の投与量を調整する可変率施用システムにおいて、圃場レベルでの収益性を引き続き実証しています。競合の激しさは依然として低く、主要企業のシェアは5.5%です。
欧州のバイオスティミュラント市場の動向と洞察
EUグリーンディールと農場から食卓までの肥料削減義務
欧州連合(EU)は、合成肥料を20%削減するという目標を法的拘束力のあるものとしました。そのため、加盟各国は、国家戦略計画において測定可能な進捗状況を示す必要があります。ブルターニュ地方およびバイエルン州での実地試験では、生物刺激剤と可変率散布機を併用した場合、すでに12~15%の代替効果が確認されています。協同組合のアドバイザーは、現在、コンプライアンス監査と生物学的投入物の推奨事項を組み合わせ、規制をプッシュ型ではなくプル型に変えています。機器ベンダーと投入資材サプライヤーは、低栄養素率でも収量の安定性を実証する農場での実証試験を共同で後援しており、導入への抵抗をさらに緩和しています。2026年以降、罰則が強化されることから、生産者は、義務付けられた栄養素の基準値を達成するのに役立つ、CEマークの付いた製剤について、複数年にわたる供給契約を締結するケースが増えています。
認証有機農地の拡大
認証有機農地は2020年から2023年にかけて年率3.6%拡大し、1,770万ヘクタール(農地総面積の10.1%)に達しました。有機農法では大半の合成肥料が禁止されるため、認証バイオスティミュラントが栄養管理のギャップを埋めつつ植物の耐性を支えています。プレミアム農産物価格は、従来型作物に比べて20~40%高いことが多く、高い投入コストを相殺し、生物学的製品の投資回収期間を短縮します。小売業者は現在、投入資材の調達先に関する第三者認証を要求しており、透明性の高いサプライチェーンとデジタルトレーサビリティを備えたメーカーが有利です。この動向はオーストリアなどの早期導入国から、イタリアやスペインの中規模生産者へと広がり、欧州適合性(CE)認証ラベルの対象基盤を拡大しています。
EU域内統一の性能基準とプロトコルの欠如
欧州適合性(CE)マークは市場参入を簡素化しますが、圃場レベルでの有効性に関する欧州全体の基準はまだ存在せず、農家は各国でばらつきのある試験データに依存せざるを得ません。農業協同組合は確固たる製品ランキングの発表に苦慮しており、リスク回避的な生産者は地域の事例研究が蓄積されるまで導入を遅らせています。科学的根拠に基づくブランドと、効果が低いとされるラベルが法的に共存できるため、市場シグナルが不明瞭になり、信頼が損なわれています。業界団体は統一プロトコルの導入を推進していますが、欧州全域で気候帯や作物の組み合わせが大きく異なるため、合意形成は遅れています。調和が実現するまでは、購入者は同業者の紹介やブランド評判に依存することになり、販売サイクルが長期化する傾向にあります。
セグメント分析
アミノ酸は2025年時点で欧州のバイオスティミュラント市場の55.35%を占め、穀物・油糧種子・温室作物における汎用性を反映しています。炭素豊富な土壌改良効果で評価されるフミン酸製剤は、2026年から2031年にかけてCAGR6.84%と最も高い伸び率が見込まれ、再生農業の実践拡大に伴い他カテゴリーを凌駕する見通しです。性能格差の拡大は、単なる植物向け資材から、土壌構造や微生物活性の再構築も行うソリューションへの移行を示しており、長期的な持続可能性を評価する補助金制度とも合致しています。
海藻抽出物は引き続き有機認証プログラムの基盤を担い、フルボ酸は高付加価値の果物や野菜向け微量栄養素供給において存在感を増しています。タンパク質加水分解物は、ストレス下での迅速なアミノ窒素吸収を求める専門栽培者に支持されています。一方、微生物ブレンドやペプチド複合体を含む多様な「その他の生物刺激剤」群は、保護栽培におけるニッチなニーズに対応しています。これらの製品群は総合的に機能性の幅を広げ、流通業者が作物特化型パッケージを構築することを可能にします。これにより、栄養効率の向上、ストレス耐性の強化、地域固有の規制要件への対応が実現します。
欧州のバイオスティミュラント市場レポートは、形態別(アミノ酸、フルボ酸、フミン酸、タンパク質加水分解物、海藻抽出物、その他のバイオスティミュラント)、作物タイプ別(換金作物、園芸作物、畑作物)、地域別(フランス、ドイツ、イタリア、オランダ、ロシア、スペイン、トルコ、英国、その他欧州諸国)に分類されています。市場予測は、金額(米ドル)および数量(メトリックトン)で提供されます。
その他の特典:
- エクセル形式の市場予測(ME)シート
- アナリストによる3ヶ月間のサポート
よくあるご質問
目次
第1章 イントロダクション
- 調査の前提条件と市場の定義
- 調査範囲
- 調査手法
第2章 レポート提供
第3章 エグゼクティブサマリーおよび主要な調査結果
第4章 主要産業動向
- 有機栽培面積
- 有機製品に対する一人当たり支出額
- 規制の枠組み
- フランス
- ドイツ
- イタリア
- オランダ
- ロシア
- スペイン
- トルコ
- 英国
- バリューチェーン及び流通チャネル分析
- 市場促進要因
- EUグリーンディールおよび農場から食卓までの肥料削減義務
- 認証有機農地の拡大
- CEマーク統一枠組みによる市場アクセス効率化
- 海藻抽出および微生物発酵の急速なコスト低下
- 精密農業における可変率技術が圃場レベルでの投資対効果を実証
- EUにおけるタンパク質作物の研究開発資金の急増が収量向上需要を牽引
- 市場抑制要因
- EU域内の性能基準およびプロトコルの欠如
- 従来型肥料に対する価格プレミアムの高さ
- 大西洋・バルト海養殖における海藻バイオマス供給の変動性
- 2024年以降のデジタル表示・トレーサビリティ対応コスト
第5章 市場規模と成長予測(金額および数量)
- 形態
- アミノ酸
- フルボ酸
- フミン酸
- タンパク質加水分解物
- 海藻エキス
- その他の生物刺激剤
- 作物タイプ
- 換金作物
- 園芸作物
- 畑作作物
- 国
- フランス
- ドイツ
- イタリア
- オランダ
- ロシア
- スペイン
- トルコ
- 英国
- その他欧州地域
第6章 競合情勢
- 主要な戦略的動きs
- 市場シェア分析
- 企業一覧
- 企業プロファイル.
- Valagro S.p.A.
- Biolchim S.p.A.
- BioAtlantis Limited
- Tradecorp International Pty Limited
- Valent Biosciences LLC
- Italpollina S.p.A.
- BASF SE
- UPL Limited
- Syngenta AG
- Novozymes A/S
- Haifa Chemicals Ltd.
- Koppert B.V.
- Yara International ASA
- Isagro S.p.A.
- SICIT Group S.p.A.
- OMEX Agriculture Limited
- Humintech GmbH
- Atlantica Agricola S.A.
- Brandt Europe S.L.
- Andermatt Biocontrol AG
