
|
市場調査レポート
商品コード
1683498
アジア太平洋地域の大豆タンパク:市場シェア分析、産業動向・統計、成長予測(2025~2030年)Asia-Pacific Soy Protein - Market Share Analysis, Industry Trends & Statistics, Growth Forecasts (2025 - 2030) |
||||||
カスタマイズ可能
適宜更新あり
|
|||||||
| アジア太平洋地域の大豆タンパク:市場シェア分析、産業動向・統計、成長予測(2025~2030年) |
|
出版日: 2025年03月18日
発行: Mordor Intelligence
ページ情報: 英文 240 Pages
納期: 2~3営業日
|

全表示
- 概要
- 目次
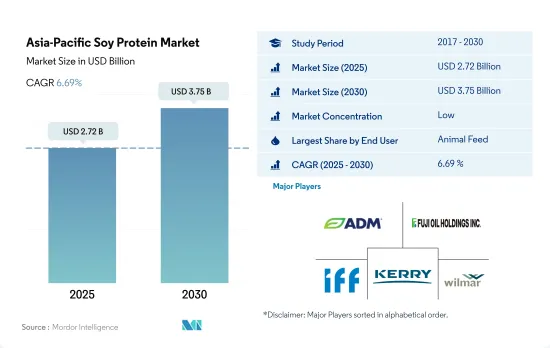
アジア太平洋地域の大豆タンパクの市場規模は、2025年に27億2,000万米ドルと推定され、2030年には37億5,000万米ドルに達すると予測され、予測期間中(2025-2030年)のCAGRは6.69%で成長します。
栄養価の高さからF&Bと動物飼料が大豆タンパクの主な用途を占める
- アジア太平洋地域の消費者は大豆タンパクを伝統的な主食として受け入れており、大豆タンパク市場は確立されています。大豆タンパクは、たん白源としても風味調味料としても汎用性が高いことで知られ、様々なエンドユーザー分野で幅広く使用されています。特筆すべきは、動物飼料分野が大豆タンパクの利用でリードしており、飲食品業界が僅差で続いていることです。
- 動物飼料分野では、大豆タンパクは乳製品や魚粉の代用品として輝きを放ち、高い消化率、費用対効果、低抗栄養因子、保存期間の長さで珍重されています。その結果、動物用飼料分野はCAGR 6.23%と予測され、最も急速な成長を遂げる見通しです。大豆タンパクは消化が良いため、特に鶏肉や牛肉のような従来のタンパク質にアレルギーのある犬にとって、ペットフードの原料として好まれています。タンパク質、食物繊維、ビタミン、ミネラルを豊富に含む大豆は、栄養価の高い肉の代用品としての役割を果たし、調理済みのテクスチャード大豆タンパクはカップ半分で11グラムのタンパク質を含みます。
- 飲食品(F&B)業界では、大豆タンパクは肉や乳製品の代用品として利用されています。F&B業界では、肉と乳製品の代替品が合計で46.24%、乳製品とその代替品が36.72%と、大きなシェアを占めています。大豆は、肉のような食感と消化の良さを持つタンパク質の宝庫であり、大豆が採用される主な要因となっています。さらに、牛乳に匹敵するタンパク質、カルシウム、ビタミンA、D、Bを含む栄養プロファイルを提供する強化豆乳は、需要の急増を目の当たりにしています。
高い生産能力により大豆タンパク消費で大きなシェアを占める中国
- 生産能力の高い中国は、この地域における大豆タンパクの主要消費国です。この生産能力は、大豆タンパクの価格を押し下げるだけでなく、消費を拡大させています。特筆すべきは、中国の山東省が、多くの植物性食品の主要成分である分離大豆タンパクの世界供給のなんと70%を加工していることです。この集中は製品イノベーションの温床となり、多様な製品でより多くの消費者を誘い込みます。大豆タンパクは、動物性食品に代わる有効な代替品であるだけでなく、高い消化率や最小限の抗栄養因子といった特性を誇っています。
- ビーガン食品に対する消費者の食欲が急増し、製品イノベーションが進んでいる中国では、CAGR成長率8.11%の数量成長が予測され、業界をリードする勢いです。一方、インドの大豆タンパク市場は活気に満ちており、200以上の植物由来原料が新興企業に参入しています。2022年には、飲食品業界と動物飼料業界がそれぞれ56.68%と43.09%という大きなシェアを占める。FSSAIのような大豆タンパク消費を支持する団体に後押しされ、インドの大豆タンパクに対する意欲は高まると思われます。
- 大豆市場の主要企業であるインドネシアは、CAGR予測値2.22%と、着実な成長軌道を歩んでいます。同国は自給自足を目指し、大豆生産を強化する取り組みを強化しています。ゲマ・パラグン(Gema Palagung)、バンキット・ケデライ(Bangkit Kedelai)、総合的作物管理のための農民学校(Farmer's School for Integrated Crop Management)といった取り組みは、タンパク質が豊富な製品に対する需要の高まりに応えるというインドネシアの決意を裏付けるものです。こうした動きは、日々の食生活における健康や栄養への関心の高まりに後押しされ、大豆タンパクに対する消費者の関心が高まっていることとよく一致しています。
アジア太平洋地域の大豆タンパク市場動向
植物性タンパク質の消費拡大が植物性タンパク質原料セグメントの主要企業に機会を与える
- アジア太平洋地域では、植物性タンパク質の有用性に対する認識と証明が高まっており、植物性タンパク質はアジア太平洋地域市場で関心を集めています。すべての植物性タンパク質の中で、大豆タンパクは、様々な食品における原料の受容性の向上とその生産量の増加により、市場シェアを占めています。2020-21年の中国の大豆粕消費量は72.68百万MTで、2018年より約9%増加しました。研究への高額の投資、急速な技術進歩、高度なイノベーション技術が、大豆タンパクを含む開発されたタンパク質原料の使用をもたらしている主な要因の一部です。
- 大豆、エンドウ豆、麻、ジャガイモなどのアレルゲンフリー植物性タンパク質の主な促進要因は、ベジタリアンライフスタイルの採用の増加、ラクトースフリーおよびグルテンフリー製品に対する需要の増加、および健康に関連する問題に対する懸念の高まりです。2021年には、インドの消費者の約81%が肉食を控えています。動物性タンパク質に対する植物性タンパク質原料の主な利点には、高い栄養価、数種類のビタミンとミネラルの優れた供給源であること、様々な食品産業における技術の進歩、消費者の嗜好を変えると予想される天然および有機代替物への需要の増加が含まれます。
- 同地域における植物性蛋白質の消費の増加と消費者の受容は、メーカーがこれらの成分を強化した製品を革新する原動力となっています。日本で消費される主な穀物は大豆、米、小麦で、トウモロコシやエンドウ豆など他の種類もあります。植物性タンパク質の増加は、今後数年間も食品メーカーに機会を提供し続けると予想されます。
インドは世界の大豆生産量トップ5のひとつ
- 中国ではトウモロコシ生産量の増加が大豆生産量の減少につながっています。大豆の価格が高いため、農家がトウモロコシに移行しているため、国内の大豆生産は1,750万トン減となる見込みです。中国の2021~2022年の大豆輸入量は、飼料需要のわずかな増加により、200万トン増の1億200万トンとなります。加えて、中国では豚熱の発生から回復したことで、この期間に食用大豆粕の使用が増加しました。大豆粉砕の増加は、予測期間中の植物油輸入を抑制すると予想されます。
- インドは世界の大豆生産量トップ5のひとつです。2020年には、インドの大豆生産量は10年間で8.09%減少したが、これは主に、近年記録された過度の降雨により、主要な大豆生産州とされるマディヤ・プラデシュ州などの州から得られる収量が減少したためです。収穫期の定期的な降雨と病害の襲来は、作物に深刻な影響を与え、低収量につながりました。
- 大豆は、作付面積(141,800ヘクタール)で日本で最も作付けされているマメ科植物です。大豆のほとんどは乾燥種子用に栽培されています。米の過剰生産を防ぐため、日本政府は米の代わりに大豆の栽培を推奨しています。そのため、日本の水田では大豆をよく見かける。大豆の生産量は2018年と比べ、2020年には7,600トン以上に増加します。数十年前、日本の農家は小規模に大豆を植えており、播種と収穫は手作業で行われていました。しかし、技術の向上に伴い、大豆栽培の機械化が生産現場に普及し、大豆の栽培規模の拡大を促しました。
アジア太平洋地域の大豆タンパク産業の概要
アジア太平洋地域の大豆タンパク市場は断片化されており、上位5社で20.54%を占めています。この市場の主要企業は以下の通り。 Archer Daniels Midland Company, Fuji Oil Group, International Flavors & Fragrances, Inc., Kerry Group PLC and Wilmar International Ltd(sorted alphabetically).
その他の特典
- エクセル形式の市場予測(ME)シート
- 3ヶ月のアナリストサポート
目次
第1章 エグゼクティブサマリーと主な調査結果
第2章 イントロダクション
- 調査の前提条件と市場定義
- 調査範囲
- 調査手法
第3章 主要産業動向
- エンドユーザー市場規模
- ベビーフードおよび乳児用調製乳
- ベーカリー
- 飲料
- 朝食用シリアル
- 調味料/ソース
- 菓子類
- 乳製品および乳製品代替製品
- 高齢者栄養・医療栄養
- 肉・鶏肉・魚介類および肉代替製品
- RTE/RTC食品
- スナック
- スポーツ/パフォーマンス栄養
- 動物飼料
- パーソナルケアと化粧品
- タンパク質消費動向
- 生産動向
- 規制の枠組み
- オーストラリア
- 中国
- インド
- 日本
- バリューチェーンと流通チャネル分析
第4章 市場セグメンテーション
- 形態
- 濃縮物
- 単離液
- テクスチャード/加水分解物
- エンドユーザー
- 飼料
- 飲食品
- サブエンドユーザー別
- ベーカリー
- 飲料
- 朝食用シリアル
- 調味料/ソース
- 乳製品・乳製品代替品
- 肉・鶏肉・魚介類および肉代替製品
- RTE/RTC食品
- スナック
- パーソナルケアと化粧品
- サプリメント
- サブエンドユーザー別
- ベビーフードおよび乳児用調製乳
- 高齢者栄養と医療栄養
- スポーツ/パフォーマンス栄養
- 国別
- オーストラリア
- 中国
- インド
- インドネシア
- 日本
- マレーシア
- ニュージーランド
- 韓国
- タイ
- ベトナム
- その他アジア太平洋地域
第5章 競合情勢
- 主要な戦略動向
- 市場シェア分析
- 企業情勢
- 企業プロファイル(世界レベルの概要、市場レベルの概要、主要事業セグメント、財務、従業員数、主要情報、市場ランク、市場シェア、製品・サービス、最近の動向分析を含む)
- Archer Daniels Midland Company
- Bunge Limited
- CHS Inc.
- Foodchem International Corporation
- Fuji Oil Group
- International Flavors & Fragrances, Inc.
- Kerry Group PLC
- Shandong Yuwang Industrial Co. Ltd
- Wilmar International Ltd
第6章 CEOへの主な戦略的質問
第7章 付録
- 世界概要
- 概要
- ファイブフォース分析フレームワーク
- 世界・バリューチェーン分析
- 市場力学(DROs)
- 情報源と参考文献
- 図表一覧
- 主要洞察
- データパック
- 用語集
The Asia-Pacific Soy Protein Market size is estimated at 2.72 billion USD in 2025, and is expected to reach 3.75 billion USD by 2030, growing at a CAGR of 6.69% during the forecast period (2025-2030).
F&B and animal feed hold major applications of soy protein due to their high nutritional properties
- Asia-Pacific boasts a well-established soy protein market, with consumers in the region embracing it as a traditional staple. Soy protein, known for its versatility as both a protein source and flavor enhancer, finds extensive use across various end-user segments. Notably, the animal feed segment leads in soy protein utilization, closely followed by the food and beverage industry.
- Within animal feed, soy protein shines as a dairy and fishmeal substitute, prized for its high digestibility, cost-effectiveness, low anti-nutritional factors, and extended shelf life. Consequently, the animal feed segment is poised to exhibit the swiftest growth, with a projected CAGR of 6.23%. Soy protein's digestibility makes it a favored ingredient in pet foods, especially for dogs with allergies to traditional proteins like chicken or beef. Soy, rich in protein, fiber, vitamins, and minerals, serves as a nutritious meat alternative, with half a cup of cooked textured soy protein packing 11 grams of protein.
- In the food and beverage (F&B) industry, soy protein finds its niche in meat and dairy substitutes. Meat and dairy alternatives collectively hold a significant share in the F&B industry, with meat and its substitutes claiming 46.24% and dairy and its alternatives close behind at 36.72%. Soybeans, being a protein powerhouse with a meat-like texture and easy digestibility, are the primary drivers for their adoption. Additionally, soy-fortified milk, offering a nutrient profile akin to cow's milk with comparable protein, calcium, and vitamins A, D, and B, is witnessing a surge in demand.
China holds significant share in soy protein consumption due to high production capacity
- China, with its robust production capacity, stands as the leading consumer of soy protein in the region. This capacity not only drives down soy protein prices but also amplifies consumption. Notably, Shandong Province, China, processes a staggering 70% of the global supply of soy protein isolate, a key component in many plant-based foods. This concentration fosters a hotbed for product innovations, luring in more consumers with diverse offerings. Soy protein, besides being a viable alternative to animal-derived meals, boasts attributes like high digestibility and minimal anti-nutritional factors.
- With a surge in consumer appetite for vegan foods and a landscape ripe with product innovations, China is poised to lead the pack with a projected CAGR volume growth of 8.11%. Meanwhile, India's soy protein landscape is vibrant, with over 200 plant-based ingredients finding their way into startups. In 2022, the food and beverage industry, along with animal feed, commanded significant shares of 56.68% and 43.09%, respectively. Bolstered by entities like FSSAI championing soy protein consumption, India's appetite for soy protein is set to rise.
- Indonesia, a key player in the soy market, is gearing up for a steady growth trajectory, with a projected CAGR value of 2.22%. The nation is intensifying its efforts to bolster soybean production, aiming for self-sufficiency. Initiatives like Gema Palagung, Bangkit Kedelai, and Farmer's School for Integrated Crop Management underscore Indonesia's commitment to meeting the surging demand for protein-rich products. This push aligns well with the rising consumer interest in soy protein, fueled by a heightened focus on wellness and nutrition in daily diets.
Asia-Pacific Soy Protein Market Trends
The consumption growth of plant protein fuels opportunities for key players in the plant protein ingredients segment
- Plant proteins are gaining interest in the Asia-Pacific market as awareness and proof of their benefits are rising in the region. Among all plant proteins, soy proteins occupy the market share with the increased acceptability of the ingredients in different foods and their increased production. The volume of soybean meal consumption in China in 2020-21 was 72.68 MMT, which was around 9% more than in 2018. High investments in research, rapid technological advancements, and advanced innovation techniques are some of the major factors resulting in the use of developed protein ingredients, including soy proteins.
- Major drivers of allergen-free plant proteins such as soy, pea, hemp, and potato are the rising adoption of a vegetarian lifestyle, increasing demand for lactose-free and gluten-free products, and growing concerns about health-related problems. Around 81% of Indian consumers restrained meat from their diet in 2021. Major benefits of plant protein ingredients over animal proteins include high nutritional value, being a good source of several vitamins and minerals, technological advancements in various food industries, and increasing demand for natural and organic substitutes, which are expected to change consumer preferences.
- The increasing consumption of plant proteins and consumer acceptance in the region are driving manufacturers to innovate products fortified with these ingredients. Major grains consumed in Japan are soybeans, rice, and wheat, along with some other types like corn and peas. The rise in plant-based protein is expected to continue to provide opportunities for food manufacturers in the coming years.
India is one of the top five soybean producers in the world
- The graph given shows the production of soybeans in Asia-Pacific. A rise in maize production in China is leading to a decline in soybean production. Domestic soybean production is expected to decline by 1 MMT to 17.5 MMT due to farmers moving toward corn owing to soybean's high price. China's imports of soybeans increased by 2 million tons to 102 million tonnes for 2021-2022 due to a slight increase in feed demand. In addition, China's recovery from the swine fever outbreak resulted in increased use of soybean meal for food during the period. Increasing soybean crushing is expected to constrain vegetable oil imports over the forecast period.
- India is one of the top five soybean producers in the world. In 2020, soybean production in India decreased by 8.09% over a decade, primarily due to the lower yield obtained from states like Madhya Pradesh, which is considered the primary soybean-growing state with excessive rainfall registered in recent years. The regular rainfall during harvesting and disease attacks severely affected the crop and led to low yields.
- Soybean is the most planted legume in Japan in terms of acreage (141,800 ha). Most soybeans are cultivated for dry seeds. To prevent the overproduction of rice, the Japanese government recommends the cultivation of soybeans instead of rice. Hence, soybeans are commonly seen in Japanese paddy fields. The production volume of soybeans increased to over 7,600 tons in 2020 compared to 2018. A few decades ago, Japanese farmers used to plant soybeans on a small scale, and seeding and harvesting were performed manually. However, with technological improvements, the mechanization of soybean cultivation became more widespread at production sites, encouraging the cultivation scale of soybeans to increase.
Asia-Pacific Soy Protein Industry Overview
The Asia-Pacific Soy Protein Market is fragmented, with the top five companies occupying 20.54%. The major players in this market are Archer Daniels Midland Company, Fuji Oil Group, International Flavors & Fragrances, Inc., Kerry Group PLC and Wilmar International Ltd (sorted alphabetically).
Additional Benefits:
- The market estimate (ME) sheet in Excel format
- 3 months of analyst support
TABLE OF CONTENTS
1 EXECUTIVE SUMMARY & KEY FINDINGS
2 INTRODUCTION
- 2.1 Study Assumptions & Market Definition
- 2.2 Scope of the Study
- 2.3 Research Methodology
3 KEY INDUSTRY TRENDS
- 3.1 End User Market Volume
- 3.1.1 Baby Food and Infant Formula
- 3.1.2 Bakery
- 3.1.3 Beverages
- 3.1.4 Breakfast Cereals
- 3.1.5 Condiments/Sauces
- 3.1.6 Confectionery
- 3.1.7 Dairy and Dairy Alternative Products
- 3.1.8 Elderly Nutrition and Medical Nutrition
- 3.1.9 Meat/Poultry/Seafood and Meat Alternative Products
- 3.1.10 RTE/RTC Food Products
- 3.1.11 Snacks
- 3.1.12 Sport/Performance Nutrition
- 3.1.13 Animal Feed
- 3.1.14 Personal Care and Cosmetics
- 3.2 Protein Consumption Trends
- 3.2.1 Plant
- 3.3 Production Trends
- 3.3.1 Plant
- 3.4 Regulatory Framework
- 3.4.1 Australia
- 3.4.2 China
- 3.4.3 India
- 3.4.4 Japan
- 3.5 Value Chain & Distribution Channel Analysis
4 MARKET SEGMENTATION (includes market size in Value in USD and Volume, Forecasts up to 2030 and analysis of growth prospects)
- 4.1 Form
- 4.1.1 Concentrates
- 4.1.2 Isolates
- 4.1.3 Textured/Hydrolyzed
- 4.2 End User
- 4.2.1 Animal Feed
- 4.2.2 Food and Beverages
- 4.2.2.1 By Sub End User
- 4.2.2.1.1 Bakery
- 4.2.2.1.2 Beverages
- 4.2.2.1.3 Breakfast Cereals
- 4.2.2.1.4 Condiments/Sauces
- 4.2.2.1.5 Dairy and Dairy Alternative Products
- 4.2.2.1.6 Meat/Poultry/Seafood and Meat Alternative Products
- 4.2.2.1.7 RTE/RTC Food Products
- 4.2.2.1.8 Snacks
- 4.2.3 Personal Care and Cosmetics
- 4.2.4 Supplements
- 4.2.4.1 By Sub End User
- 4.2.4.1.1 Baby Food and Infant Formula
- 4.2.4.1.2 Elderly Nutrition and Medical Nutrition
- 4.2.4.1.3 Sport/Performance Nutrition
- 4.3 Country
- 4.3.1 Australia
- 4.3.2 China
- 4.3.3 India
- 4.3.4 Indonesia
- 4.3.5 Japan
- 4.3.6 Malaysia
- 4.3.7 New Zealand
- 4.3.8 South Korea
- 4.3.9 Thailand
- 4.3.10 Vietnam
- 4.3.11 Rest of Asia-Pacific
5 COMPETITIVE LANDSCAPE
- 5.1 Key Strategic Moves
- 5.2 Market Share Analysis
- 5.3 Company Landscape
- 5.4 Company Profiles (includes Global Level Overview, Market Level Overview, Core Business Segments, Financials, Headcount, Key Information, Market Rank, Market Share, Products and Services, and Analysis of Recent Developments).
- 5.4.1 Archer Daniels Midland Company
- 5.4.2 Bunge Limited
- 5.4.3 CHS Inc.
- 5.4.4 Foodchem International Corporation
- 5.4.5 Fuji Oil Group
- 5.4.6 International Flavors & Fragrances, Inc.
- 5.4.7 Kerry Group PLC
- 5.4.8 Shandong Yuwang Industrial Co. Ltd
- 5.4.9 Wilmar International Ltd
6 KEY STRATEGIC QUESTIONS FOR PROTEIN INGREDIENTS INDUSTRY CEOS
7 APPENDIX
- 7.1 Global Overview
- 7.1.1 Overview
- 7.1.2 Porter's Five Forces Framework
- 7.1.3 Global Value Chain Analysis
- 7.1.4 Market Dynamics (DROs)
- 7.2 Sources & References
- 7.3 List of Tables & Figures
- 7.4 Primary Insights
- 7.5 Data Pack
- 7.6 Glossary of Terms
