
|
市場調査レポート
商品コード
1693855
乳製品デザートの市場シェア分析、産業動向と統計、成長予測(2025~2030年)Dairy Desserts - Market Share Analysis, Industry Trends & Statistics, Growth Forecasts (2025 - 2030) |
||||||
カスタマイズ可能
適宜更新あり
|
|||||||
| 乳製品デザートの市場シェア分析、産業動向と統計、成長予測(2025~2030年) |
|
出版日: 2025年03月18日
発行: Mordor Intelligence
ページ情報: 英文 367 Pages
納期: 2~3営業日
|

全表示
- 概要
- 目次
概要
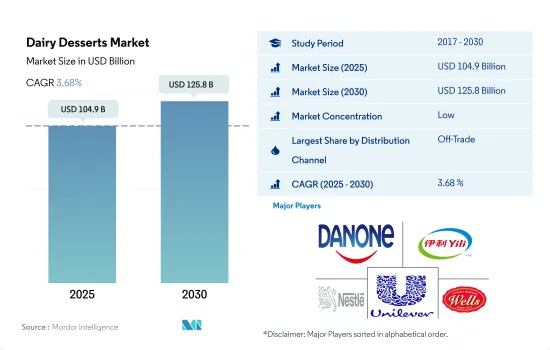
乳製品デザートの市場規模は2025年に1,049億米ドルと推定され、2030年には1,258億米ドルに達すると予測され、予測期間(2025~2030年)のCAGRは3.68%で成長する見込みです。
より幅広い製品ラインアップの存在により、非商業流通チャネルを通じた販売が市場を形成しています。
- 世界の乳製品デザート市場の流通チャネルの中で、オフトレードセグメントが支配的です。このチャネルでは、特に専門店やブティックショップと比較して、乳製品デザートの競合価格が提供されることが多いためです。なぜなら、これらの店舗は乳製品デザートを大量に仕入れ、その節約分を消費者に還元できるからです。ハイパーマーケットやスーパーマーケットでは通常、乳製品デザートの幅広いブランドや製品を扱っているため、消費者は様々な選択肢から選ぶことができます。そのため、消費者はさまざまなブランドや製品を比較し、十分な情報を得た上で購入を決めることができます。
- コンビニエンスストアは、スーパーマーケット、ハイパーマーケットに次いで、乳製品デザートの売上高で2番目に高いシェアを占めています。2022年、コンビニエンスストアを通じた乳製品デザートの販売額は前年比3.5%増加しました。
- 乳製品デザートはレストランや外食チャネルを通じて提供されるのが一般的です。外食チャネルは、ユニークでカスタマイズ型オプションを含む様々な乳製品デザートを提供し、他とは違うものや個性的なものを求める顧客を惹きつけています。レストランやその他の外食チャネルにおける乳製品デザートの販売は、メニューの提供、バラエティとカスタマイズ、利便性とスピード、品質と鮮度、プレゼンテーションと雰囲気など、さまざまな要因によって左右されます。オンチャネルを通じた乳製品デザートの売上は、2022年と比較して2025年には11.4%の成長が見込まれます。2022年には、世界中の消費者の約47%がレストランで食事をとり、31%が外食チャネルに注文しています。
北米、アジア太平洋に続く欧州の需要が世界市場を牽引
- 2022年の世界の乳製品デザート市場の前年比成長率は4.1%でした。全地域の中で、欧州が40.4%と、世界の乳製品デザート市場で最も大きなシェアを占めています。乳製品デザートは、その様々な健康上の利点、入手のしやすさ、高級アイスクリームの入手可能性により、この地域全体で絶大な支持を得ています。
- 欧州では、アイスクリームが乳製品デザートの売上の大半を占めています。2021年、欧州連合のアイスクリーム生産量は31億リットルを超え、前年比4%増となりました。ドイツ、英国、イタリアは欧州における乳製品デザートの主要市場であり、合計で同地域のアイスクリーム消費量全体の41.01%を占めています。
- 北米は乳製品デザートの第2位の市場です。北米における乳製品デザートの販売額は、2019~2022年にかけて6%の成長率を記録しました。北米諸国の乳製品デザート市場は、アイスクリームの旺盛な需要により拡大しています。平均的なアメリカ人は年間約23ポンドのアイスクリームやその他のフローズンデザートを消費します。約73%の人が週に1回以上アイスクリームを消費し、3人に2人が夜にアイスクリームを消費しています。
- アジア太平洋は、乳製品デザートの販売において世界的に最も急成長している地域です。アジア太平洋の乳製品デザートの販売額は、2022年と比較して2025年には12.1%成長すると予測されています。アイスクリームの消費量ではニュージーランドが世界をリードしており、一人当たりの消費量は年間28.4リットルです。甘いお菓子に対する需要の増加と所得の増加が、この地域の乳製品デザート市場を牽引する主要因です。
世界の乳製品デザート市場動向
乳製品デザートの消費は、飲食品への消費支出の増加、新しいフレーバーの導入、衝動買いの増加などの要因によって後押しされています。
- 乳製品デザートは、牛乳に次いで世界で2番目に消費される乳製品です。2022年の乳製品消費量全体に占めるシェアは14.74%でした。世界の消費需要の高まりに支えられた革新的なフレーバーやフォーマットへの需要の高まりが需要を牽引しています。
- 米国のフローズン・デザートは2022年に前年比2%の成長を記録しました。米国、英国、ドイツ、オーストラリアなどの市場では、国民の間で健康への関心が高まっています。その結果、この地域の消費者は、遺伝子組み換え作物不使用、保存料不使用、乳製品不使用、低カロリー、オーガニック、無脂肪のアイスクリーム製品を好むようになっています。
- アジアのアイスクリーム市場は成長しており、各ブランドはこの動向を利用して嗜好性と健康志向に対応しています。例えば、インドにおけるアイスクリームの一人当たり消費量は、2023~2024年の間に5.90%増加しました。飲食品への消費支出の増加、新しいフレーバーの導入、衝動買いの増加、消費者の健康的なアイスクリーム製品に対する強い需要が、アイスクリームの消費を促進する主要因のいくつかです。この地域の消費者の約75%は、アイスクリーム製品を購入する際、新しい品種や異なる品種を試すことが多いか、時には試すことさえあります。
- ジェラートに対する消費者の嗜好の高まりは、欧州諸国におけるジェラート消費を促進する主要因のひとつです。新しく革新的なフレーバーに対する消費者の需要により、近年ジェラートへの嗜好が高まっています。ジェラートは様々な理由から健康的なデザートと考えられており、イタリア、ドイツ、スペインなどの国々で高い人気を誇っています。
乳製品デザート産業概要
乳製品デザート市場は細分化されており、上位5社で25.48%を占めています。この市場の主要企業は、Danone SA、Inner Mongolia Yili Industrial Group、Nestle SA、Unilever Plc、Wells Enterprises Inc.などです。
その他の特典
- エクセル形式の市場予測(ME)シート
- 3ヶ月のアナリストサポート
目次
第1章 エグゼクティブサマリーと主要調査結果
第2章 レポートのオファー
第3章 イントロダクション
- 調査の前提条件と市場定義
- 調査範囲
- 調査手法
第4章 主要産業動向
- 一人当たり消費量
- 原料/商品生産量
- 牛乳
- 規制の枠組み
- ベルギー
- カナダ
- 中国
- メキシコ
- 米国
- バリューチェーンと流通チャネル分析
第5章 市場セグメンテーション
- 製品タイプ
- チーズケーキ
- フローズンデザート
- アイスクリーム
- ムース
- その他
- 流通チャネル
- オフトレード
- コンビニエンスストア
- オンライン小売
- 専門小売店
- スーパーマーケットとハイパーマーケット
- その他(倉庫クラブ、ガソリンスタンドなど)
- オントレード
- オフトレード
- 地域
- アフリカ
- 製品タイプ別
- 流通チャネル別
- エジプト
- ナイジェリア
- 南アフリカ
- その他のアフリカ
- アジア太平洋
- 製品タイプ別
- 流通チャネル別
- オーストラリア
- 中国
- インド
- インドネシア
- 日本
- マレーシア
- ニュージーランド
- パキスタン
- 韓国
- その他のアジア太平洋
- 欧州
- 製品タイプ別
- 流通チャネル別
- ベルギー
- フランス
- ドイツ
- イタリア
- オランダ
- ロシア
- スペイン
- トルコ
- 英国
- その他の欧州
- 中東
- 製品タイプ別
- 流通チャネル別
- バーレーン
- イラン
- クウェート
- オマーン
- カタール
- サウジアラビア
- アラブ首長国連邦
- その他の中東
- 北米
- 製品タイプ別
- 流通チャネル別
- カナダ
- メキシコ
- 米国
- その他の北米
- 南米
- 製品タイプ別
- 流通チャネル別
- アルゼンチン
- ブラジル
- その他の南米
- アフリカ
第6章 競合情勢
- 主要な戦略的動き
- 市場シェア分析
- 企業情勢
- 企業プロファイル
- Cedar Crest Specialties Inc.
- Danone SA
- Groupe Lactalis
- Gujarat Co-operative Milk Marketing Federation Ltd
- HP Hood LLC
- Inner Mongolia Yili Industrial Group Co. Ltd
- Mother Dairy Fruit & Vegetable Pvt. Ltd
- Nestle SA
- Unilever Plc
- Wells Enterprises Inc.
第7章 CEOへの主要戦略的質問
第8章 付録
- 世界概要
- 概要
- ファイブフォース分析フレームワーク
- 世界のバリューチェーン分析
- 市場力学(DROs)
- 情報源と参考文献
- 図表一覧
- 主要な洞察
- データパック
- 用語集
目次
Product Code: 5000330
The Dairy Desserts Market size is estimated at 104.9 billion USD in 2025, and is expected to reach 125.8 billion USD by 2030, growing at a CAGR of 3.68% during the forecast period (2025-2030).
The sales through off-trade distribution channels with the presence of wider product range is making the market
- The off-trade segment dominates among distribution channels of the global dairy desserts market. In the off-trade segment, consumers prefer buying dairy desserts majorly from supermarkets and hypermarkets, as this channel often offers competitive prices on dairy desserts, especially when compared to specialty stores or boutique shops. This is because these outlets can purchase dairy desserts in bulk and pass on the savings to consumers. Hypermarkets and supermarkets usually offer a wide range of brands and products of dairy desserts, giving consumers a variety of options to choose from. This allows consumers to compare different brands and products and make informed purchasing decisions.
- Convenience stores account for the second highest share in the sales of dairy desserts, after supermarkets and hypermarkets. In 2022, the sales value of dairy desserts through convenience stores increased by 3.5% over the previous year.
- Dairy desserts are commonly offered through restaurants and food service channels. Foodservice channels offer various dairy desserts, including unique and customized options, which attract customers looking for something different or personalized. The sale of dairy desserts in restaurants and other food service channels is driven by various factors, including menu offerings, variety and customization, convenience and speed, quality and freshness, and presentation and atmosphere. Dairy dessert sales through the on-trade channel are anticipated to grow by 11.4% in 2025 compared to 2022. About 47% of consumers across the globe consumed meals at restaurants, and 31% of consumers ordered from foodservice channels in 2022.
The demand from Europe followed by North America and Asia-Pacific drives the global market
- The Y-o-Y growth rate of the global dairy desserts market was 4.1% in 2022 compared to the previous year. Of all the regions, Europe accounted for most of the share of the global dairy desserts market, i.e., 40.4%. Dairy desserts have gained immense traction across the region due to their various health benefits, easy accessibility, and the availability of premium ice creams.
- Ice cream accounts for most of the sales of dairy desserts in Europe. In 2021, the European Union produced over 3.1 billion liters of ice cream, a 4% increase compared to the previous year. Germany, the United Kingdom, and Italy are the key markets for dairy desserts in Europe, collectively accounting for 41.01% of the overall ice cream consumption in the region.
- North America is the second-largest market for dairy desserts. The sales value of dairy desserts in North America registered a growth rate of 6% from 2019 to 2022. The dairy desserts market in North American countries is expanding due to strong demand for ice cream. The average American consumes approximately 23 pounds of ice cream and other frozen desserts per year. About 73% of people consume ice cream at least once per week, and 2 out of 3 consume ice cream in the evening.
- Asia-Pacific is the fastest-growing region in terms of the sales of dairy desserts globally. The sales value of dairy desserts in Asia-Pacific is anticipated to grow by 12.1% in 2025 compared to 2022. New Zealand leads the world in ice cream consumption, with a per capita consumption of 28.4 liters per year. Increasing demand for sweet treats and increased income are the major factors driving the dairy desserts market in the region.
Global Dairy Desserts Market Trends
The consumption of dairy desserts is boosted by factors such as growing consumer expenditure on food and beverage, the introduction of new flavors, and increasing impulse purchasing
- Dairy dessert is the second most consumed dairy product globally after milk. The industry accounted for a 14.74% share of the overall dairy product consumption in 2022. The rising demand for innovative flavors and formats, supported by the increasing demand to consume such products worldwide, is driving the demand.
- Frozen desserts in the United States observed a Y-o-Y growth of 2% in 2022. Developed markets like the United States, the United Kingdom, Germany, and Australia, have witnessed rising health concerns among the population. As a result, consumers across the region increasingly prefer ice cream products that are GMO-free, preservative-free, dairy-free, low in calories, and organic and fat-free in nature.
- The ice cream market in Asia is growing, with brands tapping into this trend to cater to indulgence and health preferences. For example, the per capita consumption of ice cream in India grew by 5.90% during 2023-2024. Growing consumer expenditure on food and beverage, the introduction of new flavors, increasing impulse purchasing, and strong demand for healthy ice cream products among consumers are some of the primary factors driving the consumption of ice cream. About 75% of consumers in the region often or even sometimes try new or different varieties while purchasing ice cream products.
- The increased consumer preference for gelato is one of the major factors driving its consumption in European countries. Due to the consumer demand for new and innovative flavors, there has been a rise in the preference for gelato in recent years. Gelato is considered a healthy dessert for a variety of reasons and is highly popular in countries like Italy, Germany, and Spain.
Dairy Desserts Industry Overview
The Dairy Desserts Market is fragmented, with the top five companies occupying 25.48%. The major players in this market are Danone SA, Inner Mongolia Yili Industrial Group Co. Ltd, Nestle SA, Unilever Plc and Wells Enterprises Inc. (sorted alphabetically).
Additional Benefits:
- The market estimate (ME) sheet in Excel format
- 3 months of analyst support
TABLE OF CONTENTS
1 EXECUTIVE SUMMARY & KEY FINDINGS
2 REPORT OFFERS
3 INTRODUCTION
- 3.1 Study Assumptions & Market Definition
- 3.2 Scope of the Study
- 3.3 Research Methodology
4 KEY INDUSTRY TRENDS
- 4.1 Per Capita Consumption
- 4.2 Raw Material/commodity Production
- 4.2.1 Milk
- 4.3 Regulatory Framework
- 4.3.1 Belgium
- 4.3.2 Canada
- 4.3.3 China
- 4.3.4 Mexico
- 4.3.5 United States
- 4.4 Value Chain & Distribution Channel Analysis
5 MARKET SEGMENTATION (includes market size in Value in USD and Volume, Forecasts up to 2030 and analysis of growth prospects)
- 5.1 Product Type
- 5.1.1 Cheesecakes
- 5.1.2 Frozen Desserts
- 5.1.3 Ice Cream
- 5.1.4 Mousses
- 5.1.5 Others
- 5.2 Distribution Channel
- 5.2.1 Off-Trade
- 5.2.1.1 Convenience Stores
- 5.2.1.2 Online Retail
- 5.2.1.3 Specialist Retailers
- 5.2.1.4 Supermarkets and Hypermarkets
- 5.2.1.5 Others (Warehouse clubs, gas stations, etc.)
- 5.2.2 On-Trade
- 5.2.1 Off-Trade
- 5.3 Region
- 5.3.1 Africa
- 5.3.1.1 By Product Type
- 5.3.1.2 By Distribution Channel
- 5.3.1.3 Egypt
- 5.3.1.4 Nigeria
- 5.3.1.5 South Africa
- 5.3.1.6 Rest of Africa
- 5.3.2 Asia-Pacific
- 5.3.2.1 By Product Type
- 5.3.2.2 By Distribution Channel
- 5.3.2.3 Australia
- 5.3.2.4 China
- 5.3.2.5 India
- 5.3.2.6 Indonesia
- 5.3.2.7 Japan
- 5.3.2.8 Malaysia
- 5.3.2.9 New Zealand
- 5.3.2.10 Pakistan
- 5.3.2.11 South Korea
- 5.3.2.12 Rest of Asia Pacific
- 5.3.3 Europe
- 5.3.3.1 By Product Type
- 5.3.3.2 By Distribution Channel
- 5.3.3.3 Belgium
- 5.3.3.4 France
- 5.3.3.5 Germany
- 5.3.3.6 Italy
- 5.3.3.7 Netherlands
- 5.3.3.8 Russia
- 5.3.3.9 Spain
- 5.3.3.10 Turkey
- 5.3.3.11 United Kingdom
- 5.3.3.12 Rest of Europe
- 5.3.4 Middle East
- 5.3.4.1 By Product Type
- 5.3.4.2 By Distribution Channel
- 5.3.4.3 Bahrain
- 5.3.4.4 Iran
- 5.3.4.5 Kuwait
- 5.3.4.6 Oman
- 5.3.4.7 Qatar
- 5.3.4.8 Saudi Arabia
- 5.3.4.9 United Arab Emirates
- 5.3.4.10 Rest of Middle East
- 5.3.5 North America
- 5.3.5.1 By Product Type
- 5.3.5.2 By Distribution Channel
- 5.3.5.3 Canada
- 5.3.5.4 Mexico
- 5.3.5.5 United States
- 5.3.5.6 Rest of North America
- 5.3.6 South America
- 5.3.6.1 By Product Type
- 5.3.6.2 By Distribution Channel
- 5.3.6.3 Argentina
- 5.3.6.4 Brazil
- 5.3.6.5 Rest of South America
- 5.3.1 Africa
6 COMPETITIVE LANDSCAPE
- 6.1 Key Strategic Moves
- 6.2 Market Share Analysis
- 6.3 Company Landscape
- 6.4 Company Profiles (includes Global Level Overview, Market Level Overview, Core Business Segments, Financials, Headcount, Key Information, Market Rank, Market Share, Products and Services, and Analysis of Recent Developments).
- 6.4.1 Cedar Crest Specialties Inc.
- 6.4.2 Danone SA
- 6.4.3 Groupe Lactalis
- 6.4.4 Gujarat Co-operative Milk Marketing Federation Ltd
- 6.4.5 HP Hood LLC
- 6.4.6 Inner Mongolia Yili Industrial Group Co. Ltd
- 6.4.7 Mother Dairy Fruit & Vegetable Pvt. Ltd
- 6.4.8 Nestle SA
- 6.4.9 Unilever Plc
- 6.4.10 Wells Enterprises Inc.
7 KEY STRATEGIC QUESTIONS FOR DAIRY AND DAIRY ALTERNATIVE CEOS
8 APPENDIX
- 8.1 Global Overview
- 8.1.1 Overview
- 8.1.2 Porter's Five Forces Framework
- 8.1.3 Global Value Chain Analysis
- 8.1.4 Market Dynamics (DROs)
- 8.2 Sources & References
- 8.3 List of Tables & Figures
- 8.4 Primary Insights
- 8.5 Data Pack
- 8.6 Glossary of Terms

