
北米の乳製品デザート:市場シェア分析、産業動向、成長予測(2025~2030年)
North America Dairy Desserts - Market Share Analysis, Industry Trends & Statistics, Growth Forecasts (2025 - 2030)- 発行日
- ページ情報
- 英文 194 Pages
- 納期
- 2~3営業日
- 商品コード
- 1693867
- カスタマイズ可能 お客様のご希望に応じて、既存データの加工や未掲載情報(例:国別セグメント)の追加などの対応が可能です。詳細はお問い合わせください。
- 適宜更新あり 本レポートは最新情報反映のため適宜更新し、内容構成変更を行う場合があります。ご検討の際はお問い合わせください。
- 翻訳ツール提供対象 PDF対応AI翻訳ツールの無料貸し出しサービスのご利用が可能です
概要
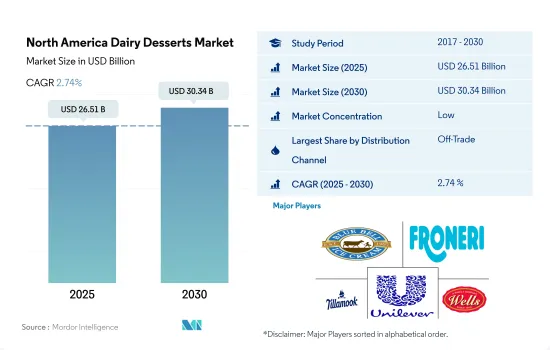
北米の乳製品デザート市場規模は2025年に265億1,000万米ドルと推定・予測され、2030年には303億4,000万米ドルに達し、予測期間(2025~2030年)のCAGRは2.74%で成長すると予測されます。
流通チャネル全体で乳製品デザートの売上が最も多いのは米国
- 北米の乳製品デザート市場の流通チャネルは、オントレードとオフトレードの小売チャネルに二分され、オフトレードセグメントが大きな優位性を記録しています。オフトレードセグメントでは、オンラインチャネルのサブセグメントが最も急成長しており、2024年までに2021年比で4.9%の成長を記録すると予測されています。忙しいスケジュールやライフスタイルの増加により、オンラインショッピングは消費者が乳製品デザートを購入する一般的な方法となりつつあります。eコマースという競争の激しい空間では、顧客は小売業者を簡単に乗り換えることができるため、顧客のロイヤリティを維持する方法を見つけることが不可欠です。
- オンチャネルは北米の乳製品デザート市場で最も急成長しているセグメントであり、2021~2024年には19.4%の成長を記録すると予測されています。オントレードセグメントは主にレストランやフードサービス事業者で構成されています。北米料理には乳製品デザートを含む多くの料理や調理法があります。2022年には米国全土で60万以上のレストランが営業していました。
- 北米諸国の中で、米国は小売チャネルを通じた乳製品デザートの売上高が最も高く、スーパーマーケットとハイパーマーケットが最大のシェアを占めています。2022年には、スーパーマーケットとハイパーマーケットが小売チャネル経由の販売額シェアの89.4%を占めました。Walmart、Target、Kroger、Albertsonsなどの大手スーパーマーケットやハイパーマーケットでは、北米地域で様々なフレーバーの乳製品デザートを割引、クーポン、その他のギフトオプションとともに提供しています。
さまざまな形態の乳製品デザートが市場を拡大
- 北米の乳製品デザート市場は、2022年の消費額が前年の2021年比で1.36%の伸びを示しました。この成長は、様々なフレーバー、テクスチャー、脂肪率(低脂肪と高脂肪)の新発売の乳製品デザートに対する消費者の関心と関連しています。乳製品デザートの中ではアイスクリームが消費者の間で非常に好まれており、2022年の1人当たり消費量は7.86kgに達します。需要の伸びに対応するため、この産業は2025年までに1.97%増加すると予想されます。
- 北米の乳製品デザート市場は、米国が58.85%のシェアを占めています。レビュー期間中(2017~2022年)、乳製品デザートセグメントは2.62%のCAGRを記録しました。米国市場で最も広く消費されている乳製品の1つです。米国では、人々は食事の一部として定期的に食べています。チーズケーキの1人当たり消費量は0.16kgで、アイスクリームの1人当たり消費量は9.87kgと推定されます。この伸びは、乳製品のデザートの保存性の高さに関係しています。チーズケーキの賞味期限は3~5日で、アイスクリームの賞味期限は長く、温度にもよりますが1~2年です。
- 乳製品デザートは、オントレードとオフトレードの両方の小売形態で市場に提供されています。スーパーマーケットとハイパーマーケットが57%のシェアで北米の小売スペースをリードしています。北米には、7-Eleven Inc.やCasey's General Stores Inc.など、さまざまな価格で乳製品デザートを提供する業者もあります。アイスクリームは、2.84米ドルの基本価格から45.2米ドルの高価なものまです。
北米の乳製品デザート市場動向
様々な価格の乳製品デザートが入手可能で、甘いお菓子への需要が高まっていることが北米の消費を牽引しています。
- 北米地域では、消費者の間で甘いお菓子の需要が高まっています。チーズケーキ、マウス、ケーキなどがその一例です。米国では、1人当たりのチーズケーキ消費量は0.16キログラムと推定されています。アイスクリームの乳固形分には、脂肪とその他の固形分が含まれます。これらの乳固形分は、牛乳に含まれるタンパク質と乳糖で構成され、アイスクリームでは9%から12%です。
- 北米地域の乳製品デザートの需要を満たすため、2022年の同地域の牛乳生産量は2021年比で2.15%増加しました。メキシコでは、国内のインフレと飼料価格の高騰にもかかわらず、生産者が繁栄を続けているため、2023年の生乳生産量の予測は1,342万トンで、2022年比2%の伸びです。この成長は、メキシコの酪農生産者が技術、遺伝学、管理など酪農産業の進歩のために継続的に投資していることと、飼料と水の十分な供給が相まって収量と生産量の増加を可能にしたことにも起因しています。
- 北米では、乳製品を使ったデザートは様々な価格(高・中・低)で販売されており、消費者にとって手頃な価格です。北米では、アイスクリームは4.97米ドルから87.2米ドルという高値で販売されています。同様に、チーズケーキも2.97米ドルから120.2米ドルで販売されています。この地域で最も好まれる乳製品デザートは、バニラやチョコレートなどのフレーバーを含みます。これに加えて、北米地域の小売部門は、消費者ベースを増やすために様々なブランドの製品を提供しています。これらのブランドには、Nestle、Dreyer's、Ben & Berry'sなどがあります。
北米の乳製品デザート産業概要
北米の乳製品デザート市場は細分化されており、上位5社で29.42%を占めています。この市場の主要企業は、Blue Bell Creameries LP、Froneri International Limited、Tilamook CCA、Unilever PLC、Wells Enterprises Inc.などです。
その他の特典
- エクセル形式の市場予測(ME)シート
- 3ヶ月のアナリストサポート
目次
第1章 エグゼクティブサマリーと主要調査結果
第2章 レポートのオファー
第3章 イントロダクション
- 調査の前提条件と市場定義
- 調査範囲
- 調査手法
第4章 主要産業動向
- 一人当たり消費量
- 原料/商品生産量
- 牛乳
- 規制の枠組み
- カナダ
- メキシコ
- 米国
- バリューチェーンと流通チャネル分析
第5章 市場セグメンテーション
- 製品タイプ
- チーズケーキ
- フローズンデザート
- アイスクリーム
- ムース
- その他
- 流通チャネル
- オフトレード
- サブ流通チャネル別
- コンビニエンスストア
- オンラインショップ
- 専門店
- スーパーマーケットとハイパーマーケット
- その他(倉庫クラブ、ガソリンスタンドなど)
- オントレード
- オフトレード
- 国名
- カナダ
- メキシコ
- 米国
- その他の北米地域
第6章 競争情勢
- 主要な戦略動向
- 市場シェア分析
- 企業情勢
- 企業プロファイル
- Agropur Dairy Cooperative
- Blue Bell Creameries LP
- Dairy Farmers of America Inc.
- Froneri International Limited
- HP Hood LLC
- Prairie Farms Dairy Inc.
- Tilamook CCA
- Turkey Hill Dairy
- Unilever PLC
- Van Leeuwen Ice Cream
- Wells Enterprises Inc.
- Yasso Inc.
第7章 CEOへの主要戦略的質問
第8章 付録
- 世界概要
- 概要
- ファイブフォース分析フレームワーク
- 世界のバリューチェーン分析
- 市場力学(DROs)
- 情報源と参考文献
- 図表一覧
- 主要な洞察
- データパック
- 用語集
目次
Product Code: 50000726
The North America Dairy Desserts Market size is estimated at 26.51 billion USD in 2025, and is expected to reach 30.34 billion USD by 2030, growing at a CAGR of 2.74% during the forecast period (2025-2030).
The United States accounted for the highest sales of dairy desserts in overall distribution channels
- The distribution channels of the North American dairy desserts market have been bifurcated into on-trade and off-trade retailing channels, with the off-trade segment recording a significant dominance. In the off-trade segment, the online channel sub-segment is the fastest-growing one, which is anticipated to record a 4.9% growth by 2024 compared to 2021. Online shopping is becoming a popular way for consumers to buy dairy desserts because of the increase in busy schedules and lifestyles. In the highly competitive space of e-commerce, where it is easy for customers to switch between retailers, finding ways to keep customers loyal is essential.
- The on-trade channel is the fastest-growing segment in the North American dairy desserts market, anticipated to record a growth of 19.4% in 2024 from 2021. The on-trade segment is primarily composed of restaurants and foodservice operators. There are many dishes and preparations in North American cuisine that include dairy desserts. In 2022, more than 600,000 restaurants were operating across the United States.
- Among North American countries, the United States accounted for the highest sales of dairy desserts through retail channels, with supermarkets and hypermarkets holding the largest share. In 2022, supermarkets and hypermarkets accounted for 89.4% of the value share of sales through retail channels. Major supermarkets and hypermarkets, including Walmart, Target, Kroger, and Albertsons, offer various flavors of dairy desserts, along with discounts, coupons, and other gift options, in the North American region.
Availability of dairy desserts in different formats is growing the market
- The North American dairy desserts market observed growth of 1.36% in its consumption value in 2022 compared to the preceding year, 2021. The growth was associated with consumers' interest in newly-launched dairy desserts in varied flavors, textures, and fat percentages (low and high fat). Among dairy dessert products, ice cream is highly preferred among consumers, with its per capita consumption amounting to 7.86 kg in 2022. To cater to the growth in demand, this industry is expected to rise by 1.97% by 2025.
- The North American dairy desserts market is dominated by the United States, which holds a share of 58.85%. During the review period (2017-2022), the dairy desserts segment recorded a CAGR of 2.62%. It is one of the most extensively consumed dairy products in the US market. In the United States, people eat them regularly as part of their meals. The per capita consumption of cheesecakes was 0.16 kg, while the per capita consumption of ice cream was estimated at 9.87 kg. This growth is related to the higher shelf-life of dairy desserts. Cheesecakes have a shelf-life of 3-5 days, and ice creams have a longer shelf life, which ranges between one and two years, depending on the temperature.
- Dairy desserts are offered in the market through both on-trade and off-trade retailing modes. Supermarkets and hypermarkets are leading the North American retail space with a share of 57%. Some off-trade retailers in North America are 7-Eleven Inc. and Casey's General Stores Inc., which also offer dairy desserts at varied prices. The ice creams range from a base price of USD 2.84 to as costly as USD 45.2.
North America Dairy Desserts Market Trends
The availability of dairy desserts at varied prices and growing demand for sweet treats drive consumption in North America
- In the North American region, there is a rise in demand for sweet treats among consumers. Some of these treats are cheesecakes, mouses, and cakes. In the United States, the per capita consumption of cheesecake was estimated at 0.16 kilograms. Total milk solid components of ice cream include fat and other solids. These milk solids consist of protein and lactose in milk and range from 9% to 12% in ice cream.
- To meet the demand for dairy desserts in the North American region, the region's milk production grew by 2.15% in 2022 compared to 2021. In Mexico, the milk production forecast for 2023 is 13.42 million metric tons, a growth of 2% from 2022, as producers continue to thrive despite both high domestic inflation and feed prices. The growth is also attributed to Mexican dairy producers' continued investment into the advancement of the dairy industry, including in technology, genetics, and management, combined with a sufficient supply of feed and water, which enabled increased yields and production.
- In North America, dairy desserts are available at varied prices (high, medium, and low), promoting the affordability factor for consumers. In North America, ice creams are available at USD 4.97 prices to as high as USD 87.2. Similarly, cheesecakes are offered in the market at USD 2.97, which can go up to USD 120.2. Most preferred dairy desserts in the region include flavors such as vanilla and chocolate. In addition to this, the retailing segment of the North American region is offering products from various brands to increase its consumer base. Some of these brands are Nestle, Dreyer's, and Ben & Berry's.
North America Dairy Desserts Industry Overview
The North America Dairy Desserts Market is fragmented, with the top five companies occupying 29.42%. The major players in this market are Blue Bell Creameries LP, Froneri International Limited, Tilamook CCA, Unilever PLC and Wells Enterprises Inc. (sorted alphabetically).
Additional Benefits:
- The market estimate (ME) sheet in Excel format
- 3 months of analyst support
TABLE OF CONTENTS
1 EXECUTIVE SUMMARY & KEY FINDINGS
2 REPORT OFFERS
3 INTRODUCTION
- 3.1 Study Assumptions & Market Definition
- 3.2 Scope of the Study
- 3.3 Research Methodology
4 KEY INDUSTRY TRENDS
- 4.1 Per Capita Consumption
- 4.2 Raw Material/commodity Production
- 4.2.1 Milk
- 4.3 Regulatory Framework
- 4.3.1 Canada
- 4.3.2 Mexico
- 4.3.3 United States
- 4.4 Value Chain & Distribution Channel Analysis
5 MARKET SEGMENTATION (includes market size in Value in USD and Volume, Forecasts up to 2030 and analysis of growth prospects)
- 5.1 Product Type
- 5.1.1 Cheesecakes
- 5.1.2 Frozen Desserts
- 5.1.3 Ice Cream
- 5.1.4 Mousses
- 5.1.5 Others
- 5.2 Distribution Channel
- 5.2.1 Off-Trade
- 5.2.1.1 By Sub Distribution Channels
- 5.2.1.1.1 Convenience Stores
- 5.2.1.1.2 Online Retail
- 5.2.1.1.3 Specialist Retailers
- 5.2.1.1.4 Supermarkets and Hypermarkets
- 5.2.1.1.5 Others (Warehouse clubs, gas stations, etc.)
- 5.2.2 On-Trade
- 5.2.1 Off-Trade
- 5.3 Country
- 5.3.1 Canada
- 5.3.2 Mexico
- 5.3.3 United States
- 5.3.4 Rest of North America
6 COMPETITIVE LANDSCAPE
- 6.1 Key Strategic Moves
- 6.2 Market Share Analysis
- 6.3 Company Landscape
- 6.4 Company Profiles (includes Global Level Overview, Market Level Overview, Core Business Segments, Financials, Headcount, Key Information, Market Rank, Market Share, Products and Services, and Analysis of Recent Developments).
- 6.4.1 Agropur Dairy Cooperative
- 6.4.2 Blue Bell Creameries LP
- 6.4.3 Dairy Farmers of America Inc.
- 6.4.4 Froneri International Limited
- 6.4.5 HP Hood LLC
- 6.4.6 Prairie Farms Dairy Inc.
- 6.4.7 Tilamook CCA
- 6.4.8 Turkey Hill Dairy
- 6.4.9 Unilever PLC
- 6.4.10 Van Leeuwen Ice Cream
- 6.4.11 Wells Enterprises Inc.
- 6.4.12 Yasso Inc.
7 KEY STRATEGIC QUESTIONS FOR DAIRY AND DAIRY ALTERNATIVE CEOS
8 APPENDIX
- 8.1 Global Overview
- 8.1.1 Overview
- 8.1.2 Porter's Five Forces Framework
- 8.1.3 Global Value Chain Analysis
- 8.1.4 Market Dynamics (DROs)
- 8.2 Sources & References
- 8.3 List of Tables & Figures
- 8.4 Primary Insights
- 8.5 Data Pack
- 8.6 Glossary of Terms
北米の乳製品デザート:市場シェア分析、産業動向、成長予測(2025~2030年)
- 発行日
- 発行
- Mordor Intelligence
- ページ情報
- 英文 194 Pages
- 納期
- 2~3営業日


