
米国の乳製品デザート:市場シェア分析、産業動向、統計、成長予測(2025~2030年)
United States Dairy Desserts - Market Share Analysis, Industry Trends & Statistics, Growth Forecasts (2025 - 2030)- 発行日
- ページ情報
- 英文 162 Pages
- 納期
- 2~3営業日
- 商品コード
- 1693866
- カスタマイズ可能 お客様のご希望に応じて、既存データの加工や未掲載情報(例:国別セグメント)の追加などの対応が可能です。詳細はお問い合わせください。
- 適宜更新あり 本レポートは最新情報反映のため適宜更新し、内容構成変更を行う場合があります。ご検討の際はお問い合わせください。
- 翻訳ツール提供対象 PDF対応AI翻訳ツールの無料貸し出しサービスのご利用が可能です
概要
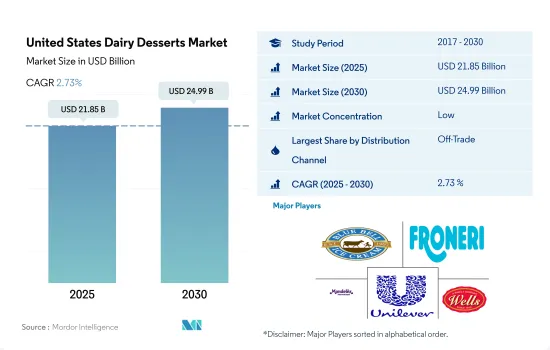
米国の乳製品デザート市場規模は2025年に218億5,000万米ドルと推定・予測され、2030年には249億9,000万米ドルに達し、予測期間(2025~2030年)のCAGRは2.73%で成長すると予測されます。
組織小売チャネルの強力な浸透が市場成長を促進
- 乳製品デザートの幅広い入手可能性により、非売品セグメントが流通チャネルを支配しています。オフトレードセグメントでは、オンライン小売チャネルのサブセグメントが最も急成長しており、予測期間中のCAGRは3.01%を記録すると予測されます。eコマースの成長により、企業はより大きな対象市場にアクセスし、顧客のニーズに効果的に応えることができるようになりました。多忙なスケジュールや2020年の全国的な封鎖により、多くの人々が食品、特に乳製品デザートをオンラインで注文するようになりました。乳製品デザートの主要eコマースチャネルは、消費者直接販売、クリック・アンド・コレクト、食料品小売店への配送、コンシェルジュサービスの4つです。
- アウトブレイクにより外食産業が操業停止となり、物流と供給に混乱が生じたため、2020年の世界のオンチャネルによる乳製品デザートの販売額は2019年から0.15%減少しました。2021年、米国には約3万2,027のフルサービスレストランのフランチャイズ店舗がありました。流通チャネル別では、2021年の冷凍乳製品全体の消費量は1人当たり約21.9ポンドでした。しかし、2000年以降、冷凍乳製品の消費量は1人当たり5.6ポンド減少しています。
- オフトレードは最も急成長する流通チャネルであり、予測期間中にCAGR 2.63%を記録すると予測されます。この増加は、主にスーパーマーケットやオンライン小売店で広く入手可能な乳製品デザートに対する需要の高まりによるものと予想されます。世界の主要小売業者が採用しているオムニチャネル・アプローチも米国の乳製品デザート市場を牽引しています。Costco、Trader Joe's、Walmartなどの小売業者はオムニチャネル・ショッピングに力を入れており、特にオンライン機能を実店舗に拡大・統合しています。
米国の乳製品デザート市場動向
1日のエネルギー摂取量のバランスを取るためにアイスクリーム製品への関心が高まっていることが市場を牽引
- アイスクリーム、チーズケーキ、フローズンデザートを含む乳製品デザートの一人当たり消費量は、その様々な健康効果、入手のしやすさ、高級アイスクリームにより、米国で年々増加しています。2022年の乳製品デザートの一人当たり消費量は、2021年と比較して1.2%増加しました。乳製品デザートの中でも、消費者は主にアイスクリームを消費しています。アイスクリームは乳製品を原料とする冷凍食品で、通常はスナックやデザートとして消費されます。アイスクリームはカルシウムとリンの良質な供給源とされ、1食あたり1日分の10%を含みます。アイスクリームはバランスの取れた食事の一部ではあるが、その高い嗜好性により、過剰摂取の可能性が高くなり、1日のエネルギー摂取量が増加します。
- 健康志向の消費者の間では、通常のアイスクリームよりも低カロリー(1食あたり150キロカロリー)または砂糖不使用のアイスクリームが人気を博しています。このため、通常のアイスクリームの消費量は2021年に9%減少し、低脂肪アイスクリームの消費量は20%増加しました。アイスクリームの需要が高いことから、米国で生産される全生乳の9%が冷菓の製造に使用されています。
- 米国には、乳製品のデザート消費に関する厳しい基準があります。連邦規則(Standards of Identity)では、アイスクリームは乳脂肪分10%以上、全乳固形分20%以上、シャーベットは乳脂肪分1~2%、重量1ガロン6ポンド以上と定められています。米国では、ほぼ74%の人が週に一度はアイスクリームを食べています。約84%のアメリカ人が食料品店でアイスクリームを購入し、自宅で食べています。
米国の乳製品デザート産業概要
米国の乳製品デザート市場は細分化されており、上位5社で33.95%を占めています。この市場の主要企業は、Blue Bell Creameries LP、Froneri International Limited、Mondelez International Inc.、Unilever PLC、Wells Enterprises Inc.などです。
その他の特典
- エクセル形式の市場予測(ME)シート
- 3ヶ月のアナリストサポート
目次
第1章 エグゼクティブサマリーと主要調査結果
第2章 レポートのオファー
第3章 イントロダクション
- 調査の前提条件と市場定義
- 調査範囲
- 調査手法
第4章 主要産業動向
- 一人当たり消費量
- 原料/商品生産量
- 牛乳
- 規制の枠組み
- 米国
- バリューチェーンと流通チャネル分析
第5章 市場セグメンテーション
- 製品タイプ
- チーズケーキ
- フローズンデザート
- アイスクリーム
- ムース
- その他
- 流通チャネル
- オフトレード
- コンビニエンスストア
- オンライン小売
- 専門小売店
- スーパーマーケットとハイパーマーケット
- その他(倉庫クラブ、ガソリンスタンドなど)
- オントレード
- オフトレード
第6章 競合情勢
- 主要な戦略動向
- 市場シェア分析
- 企業情勢
- 企業プロファイル
- Blue Bell Creameries LP
- Conagra Brands Inc.
- Dairy Farmers of America Inc.
- Froneri International Limited
- Giffords Dairy Inc.
- HP Hood LLC
- Mondelez International Inc.
- Unilever PLC
- Wells Enterprises Inc.
第7章 CEOへの主要戦略的質問
第8章 付録
- 世界概要
- 概要
- ファイブフォース分析フレームワーク
- 世界のバリューチェーン分析
- 市場力学(DROs)
- 情報源と参考文献
- 図表一覧
- 主要な洞察
- データパック
- 用語集
目次
The United States Dairy Desserts Market size is estimated at 21.85 billion USD in 2025, and is expected to reach 24.99 billion USD by 2030, growing at a CAGR of 2.73% during the forecast period (2025-2030).
Strong penetration of organized retail channels fueling the market growth
- The off-trade segment dominates the distribution channels due to the wide accessibility of dairy desserts in these off-trade formats. In the off-trade segment, the online retail channel sub-segment is the fastest-growing one, and it is projected to record a CAGR of 3.01% over the forecast period. The growth of e-commerce has enabled companies to access a larger target market and effectively serve customer needs. Many people started ordering food online, particularly dairy desserts, due to their hectic schedules and the nationwide lockdown in 2020. The four main e-commerce channels for dairy desserts were direct-to-consumer, click-and-collect, retail grocery delivery, and concierge services.
- The sales value of dairy desserts through on-trade channels worldwide declined by 0.15% in 2020 from 2019 as foodservice industries were shut down due to the outbreak, which led to logistic and supply disruption. In 2021, the United States had around 32,027 full-service restaurant franchise establishments. Based on the distribution channel, the overall frozen dairy consumption was around 21.9 pounds per person in 2021. However, people have consumed 5.6 fewer pounds of frozen dairy products per person since 2000.
- Off-trade is projected to be the fastest-growing distribution channel, registering a CAGR of 2.63% during the forecast period. This increase is expected mostly due to the rising demand for dairy desserts, which are widely accessible at supermarkets and online retailers. The omnichannel approach adopted by major retailers worldwide also drives the US dairy desserts market. Retailers such as Costco, Trader Joe's, and Walmart focus on omnichannel shopping, particularly expanding and integrating online capabilities into brick-and-mortar stores.
United States Dairy Desserts Market Trends
The increasing interest on ice cream products to balance their daily energy intake is driving the market
- The per capita consumption of dairy desserts, including ice cream, cheesecakes, and frozen desserts, is increasing yearly in the United States due to their various health benefits, easy availability, and premium ice creams. In 2022, the per capita consumption of dairy desserts increased by 1.2% compared to 2021. Among dairy desserts, consumers majorly consume ice creams in the country. Ice creams are dairy-sourced frozen foods usually consumed as snacks or desserts. Ice cream is considered a good source of calcium and phosphorous, containing 10% daily value per serving. While ice cream is part of a balanced diet, its high palatability increases the likelihood of overconsumption and increased daily energy intake.
- Ice creams with low-calorie (150 calories per serving) or no-sugar options compared to regular ice creams have gained popularity among health-conscious consumers. Due to this, regular ice cream consumption experienced a dip of 9% in 2021, and low-fat ice cream consumption increased by 20%. Given the high demand for ice cream, 9% of all milk produced in the United States is used to make frozen desserts.
- The United States has some strict standards for dairy dessert consumption. Federal regulations or Standards of Identity stipulate that ice creams must contain a minimum of 10% milk fat and 20% total milk solids by weight, and sherbets should have a milk fat content of 1-2% and weigh a minimum of 6 pounds to the gallon. Almost 74% of Americans in the United States eat ice cream at least once a week. Around 84% of Americans purchase ice creams at grocery stores and eat them at home.
United States Dairy Desserts Industry Overview
The United States Dairy Desserts Market is fragmented, with the top five companies occupying 33.95%. The major players in this market are Blue Bell Creameries LP, Froneri International Limited, Mondelez International Inc., Unilever PLC and Wells Enterprises Inc. (sorted alphabetically).
Additional Benefits:
- The market estimate (ME) sheet in Excel format
- 3 months of analyst support
TABLE OF CONTENTS
1 EXECUTIVE SUMMARY & KEY FINDINGS
2 REPORT OFFERS
3 INTRODUCTION
- 3.1 Study Assumptions & Market Definition
- 3.2 Scope of the Study
- 3.3 Research Methodology
4 KEY INDUSTRY TRENDS
- 4.1 Per Capita Consumption
- 4.2 Raw Material/commodity Production
- 4.2.1 Milk
- 4.3 Regulatory Framework
- 4.3.1 United States
- 4.4 Value Chain & Distribution Channel Analysis
5 MARKET SEGMENTATION (includes market size in Value in USD and Volume, Forecasts up to 2030 and analysis of growth prospects)
- 5.1 Product Type
- 5.1.1 Cheesecakes
- 5.1.2 Frozen Desserts
- 5.1.3 Ice Cream
- 5.1.4 Mousses
- 5.1.5 Others
- 5.2 Distribution Channel
- 5.2.1 Off-Trade
- 5.2.1.1 Convenience Stores
- 5.2.1.2 Online Retail
- 5.2.1.3 Specialist Retailers
- 5.2.1.4 Supermarkets and Hypermarkets
- 5.2.1.5 Others (Warehouse clubs, gas stations, etc.)
- 5.2.2 On-Trade
- 5.2.1 Off-Trade
6 COMPETITIVE LANDSCAPE
- 6.1 Key Strategic Moves
- 6.2 Market Share Analysis
- 6.3 Company Landscape
- 6.4 Company Profiles (includes Global Level Overview, Market Level Overview, Core Business Segments, Financials, Headcount, Key Information, Market Rank, Market Share, Products and Services, and Analysis of Recent Developments).
- 6.4.1 Blue Bell Creameries LP
- 6.4.2 Conagra Brands Inc.
- 6.4.3 Dairy Farmers of America Inc.
- 6.4.4 Froneri International Limited
- 6.4.5 Giffords Dairy Inc.
- 6.4.6 HP Hood LLC
- 6.4.7 Mondelez International Inc.
- 6.4.8 Unilever PLC
- 6.4.9 Wells Enterprises Inc.
7 KEY STRATEGIC QUESTIONS FOR DAIRY AND DAIRY ALTERNATIVE CEOS
8 APPENDIX
- 8.1 Global Overview
- 8.1.1 Overview
- 8.1.2 Porter's Five Forces Framework
- 8.1.3 Global Value Chain Analysis
- 8.1.4 Market Dynamics (DROs)
- 8.2 Sources & References
- 8.3 List of Tables & Figures
- 8.4 Primary Insights
- 8.5 Data Pack
- 8.6 Glossary of Terms
- 発行日
- 発行
- Mordor Intelligence
- ページ情報
- 英文 162 Pages
- 納期
- 2~3営業日


