|
|
市場調査レポート
商品コード
1374357
空間コンピューティングの世界市場規模、シェア、産業動向分析レポート:エンドユーザー別、ソリューション別、技術別、地域別展望と予測、2023年~2030年Global Spatial Computing Market Size, Share & Industry Trends Analysis Report By End User, By Solution (Hardware, Software, and Services), By Technology, By Regional Outlook and Forecast, 2023 - 2030 |
||||||
|
|
|||||||
|
|||||||


| 空間コンピューティングの世界市場規模、シェア、産業動向分析レポート:エンドユーザー別、ソリューション別、技術別、地域別展望と予測、2023年~2030年 |
|
出版日: 2023年09月30日
発行: KBV Research
ページ情報: 英文 340 Pages
納期: 即納可能
|

- 全表示
- 概要
- 図表
- 目次
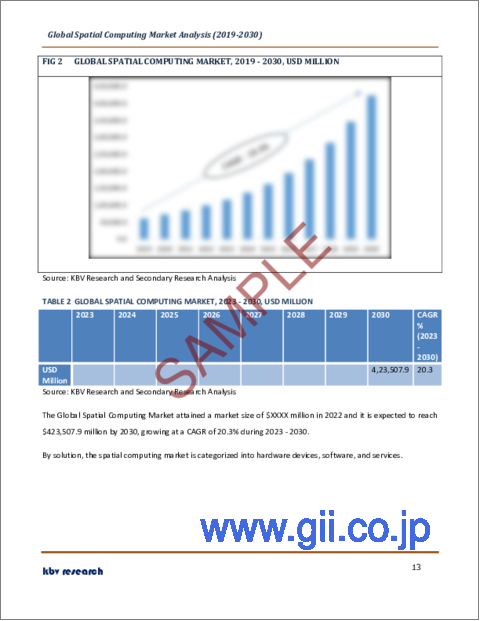
空間コンピューティング市場規模は、2030年までに4,235億米ドルに達すると予測され、予測期間中のCAGRは20.3%の市場成長率で上昇します。
しかし、空間コンピューティング技術には、ユーザーの環境に関するデータを取得・処理するセンサーやカメラが含まれます。このデータのプライバシーとセキュリティを確保することは、ユーザー間の信頼を築き、プライバシーに関連する潜在的課題に対処する上で極めて重要です。空間コンピューティングデバイスは、ユーザーの周囲、動き、相互作用に関するデータを収集することが多いです。このデータには、画像、ビデオ、センサーの読み取り値などが含まれます。このデータのプライバシーを確保することは、不正な監視やデータ侵害からユーザーを守るために極めて重要です。そのため、規制や倫理の問題は、市場の成長や普及を妨げる重大な課題となっています。
エンドユーザーの展望
エンドユーザー別に見ると、ヘルスケア、教育、アーキテクチャ・エンジニアリング・建設(AEC)、航空宇宙・防衛、自動車、ゲーム、家電、政府・公共機関、情報技術、エネルギー・公益事業、その他に分類されます。2022年には、ヘルスケア分野が最大の収益シェアで市場を独占しました。ヘルスケア分野では、空間コンピューティング技術の採用が大幅に増加しています。仮想現実(VR)および磁気共鳴(MR)シミュレーションは、外科手術トレーニング、患者診察、医療介入のための実地体験を提供し、ヘルスケア専門家が患者の安全を危険にさらすことなく能力や専門知識を向上させることを可能にします。
ソリューションの展望
ソリューションは、ハードウェア、ソフトウェア、サービスに分類されます。2022年の市場では、ソフトウェア分野がかなりの収益シェアを占めています。ハードウェア・デバイスに加えて、ソフトウェア・ソリューションは、没入型でインタラクティブな仮想現実、拡張現実、複合現実体験の作成と展開を可能にするため、市場の拡大に重要な役割を果たしています。コンテンツ作成ツールは、開発者、デザイナー、アーティストがこれらの体験を作成できるようにするソフトウェア・プログラムです。これらのツールには、3Dモデリングやアニメーション・ソフトウェア、ゲーム・エンジン、VR・AR・MRコンテンツのオーサリング・ツールなどが含まれます。
技術展望
技術に基づき、市場は人工知能、拡張現実、バーチャルリアリティ、複合現実、モノのインターネット(IoT)、デジタルツイン、その他に分類されます。2022年の市場では、拡張現実(AR)分野が最大の収益シェアを占めています。ARは、3Dオブジェクト、画像、動画、テキストデータなどのデジタル情報を、通常モバイル機器やARメガネを介してユーザーの視界に重ね合わせることで、現実の環境を拡張します。高性能のカメラやセンサーを搭載したスマートフォンやタブレット端末が普及したことで、拡張現実(AR)は多くの人にとって身近なものになっています。技術と小型化により、軽量で審美的なARメガネが誕生しました。マイクロソフト(HoloLens)、グーグル(Google Glass)、アップル(VisionPro)は拡張現実(AR)メガネに投資しています。
地域別展望
地域別に見ると、市場は北米、欧州、アジア太平洋、LAMEAで分析されます。2022年には、アジア太平洋地域が市場で大きな収益シェアを獲得しました。アジア太平洋地域は、人口が多く、技術の進歩が著しく、デジタル技術の利用が増加している多様で新興国市場です。ウェアラブル、タブレット、スマートフォンなどのスマート技術は、この地域全体で急速に受け入れられています。これらのデバイスは、空間コンピューティング体験を得るための主要なプラットフォームです。中国、インド、日本、韓国などの国々では、スマートデバイスの普及が進み、コンピューティングデバイスの実質的なユーザーベースが形成されています。
空間コンピューティング市場で展開されている戦略
目次
第1章 市場範囲と調査手法
- 市場の定義
- 目的
- 市場範囲
- セグメンテーション
- 調査手法
第2章 市場の概要
- 主なハイライト
第3章 市場概要
- イントロダクション
- 概要
- 市場構成とシナリオ
- 概要
- 市場に影響を与える主な要因
- 市場促進要因
- 市場抑制要因
第4章 競合分析- 世界
- 市場シェア分析2022
- 空間コンピューティング市場で展開される戦略
- ポーターファイブフォース分析
第5章 世界の空間コンピューティング市場:エンドユーザー別
- 世界のヘルスケア市場:地域別
- 世界の航空宇宙および防衛市場:地域別
- 世界の自動車市場:地域別
- 世界のエネルギーおよび公益事業市場:地域別
- 世界のゲーム市場:地域別
- 世界の家電市場:地域別
- 世界のアーキテクチャ、エンジニアリング、建設(AEC)市場:地域別
- 世界の政府および公共部門市場:地域別
- 世界の情報技術市場:地域別
- 世界の教育市場:地域別
- 世界のその他の市場:地域別
第6章 世界の空間コンピューティング市場:ソリューション別
- 世界のハードウェア市場:地域別
- 世界のソフトウェア市場:地域別
- 世界サービス市場:地域別
第7章 世界の空間コンピューティング市場:技術別
- 世界の拡張現実市場:地域別
- 世界の仮想現実市場:地域別
- 世界の複合現実市場:地域別
- 世界の人工知能市場:地域別
- 世界のモノのインターネット(IoT)市場:地域別
- 世界のデジタルツイン市場:地域別
- 世界のその他の市場:地域別
第8章 世界の空間コンピューティング市場:地域別
- 北米
- 北米の市場:国別
- 米国
- カナダ
- メキシコ
- その他北米地域
- 北米の市場:国別
- 欧州
- 欧州の市場:国別
- ドイツ
- 英国
- フランス
- ロシア
- スペイン
- イタリア
- その他欧州地域
- 欧州の市場:国別
- アジア太平洋
- アジア太平洋の市場:国別
- 中国
- 日本
- インド
- 韓国
- シンガポール
- マレーシア
- その他アジア太平洋地域
- アジア太平洋の市場:国別
- ラテンアメリカ・中東・アフリカ
- ラテンアメリカ・中東・アフリカの市場:国別
- ブラジル
- アルゼンチン
- アラブ首長国連邦
- サウジアラビア
- 南アフリカ
- ナイジェリア
- その他ラテンアメリカ・中東・アフリカ地域
- ラテンアメリカ・中東・アフリカの市場:国別
第9章 企業プロファイル
- Apple, Inc
- Avegant Corporation
- Blippar Group Limited
- Seiko Epson Corporation
- Google LLC(Alphabet Inc)
- HTC Corporation
- Lenovo Group Limited
- Magic Leap, Inc
- Microsoft Corporation
- NVIDIA Corporation
第10章 空間コンピューティング市場での勝利の必須事項
LIST OF TABLES
- TABLE 1 Global Spatial Computing Market, 2019 - 2022, USD Million
- TABLE 2 Global Spatial Computing Market, 2023 - 2030, USD Million
- TABLE 3 Global Spatial Computing Market by End User, 2019 - 2022, USD Million
- TABLE 4 Global Spatial Computing Market by End User, 2023 - 2030, USD Million
- TABLE 5 Global Healthcare Market by Region, 2019 - 2022, USD Million
- TABLE 6 Global Healthcare Market by Region, 2023 - 2030, USD Million
- TABLE 7 Global Aerospace & Defense Market by Region, 2019 - 2022, USD Million
- TABLE 8 Global Aerospace & Defense Market by Region, 2023 - 2030, USD Million
- TABLE 9 Global Automotive Market by Region, 2019 - 2022, USD Million
- TABLE 10 Global Automotive Market by Region, 2023 - 2030, USD Million
- TABLE 11 Global Energy & Utilities Market by Region, 2019 - 2022, USD Million
- TABLE 12 Global Energy & Utilities Market by Region, 2023 - 2030, USD Million
- TABLE 13 Global Gaming Market by Region, 2019 - 2022, USD Million
- TABLE 14 Global Gaming Market by Region, 2023 - 2030, USD Million
- TABLE 15 Global Consumer Electronics Market by Region, 2019 - 2022, USD Million
- TABLE 16 Global Consumer Electronics Market by Region, 2023 - 2030, USD Million
- TABLE 17 Global Architecture, Engineering, and Construction (AEC) Market by Region, 2019 - 2022, USD Million
- TABLE 18 Global Architecture, Engineering, and Construction (AEC) Market by Region, 2023 - 2030, USD Million
- TABLE 19 Global Government and Public Sector Market by Region, 2019 - 2022, USD Million
- TABLE 20 Global Government and Public Sector Market by Region, 2023 - 2030, USD Million
- TABLE 21 Global Information Technology Market by Region, 2019 - 2022, USD Million
- TABLE 22 Global Information Technology Market by Region, 2023 - 2030, USD Million
- TABLE 23 Global Education Market by Region, 2019 - 2022, USD Million
- TABLE 24 Global Education Market by Region, 2023 - 2030, USD Million
- TABLE 25 Global Others Market by Region, 2019 - 2022, USD Million
- TABLE 26 Global Others Market by Region, 2023 - 2030, USD Million
- TABLE 27 Global Spatial Computing Market by Solution, 2019 - 2022, USD Million
- TABLE 28 Global Spatial Computing Market by Solution, 2023 - 2030, USD Million
- TABLE 29 Global Hardware Market by Region, 2019 - 2022, USD Million
- TABLE 30 Global Hardware Market by Region, 2023 - 2030, USD Million
- TABLE 31 Global Software Market by Region, 2019 - 2022, USD Million
- TABLE 32 Global Software Market by Region, 2023 - 2030, USD Million
- TABLE 33 Global Services Market by Region, 2019 - 2022, USD Million
- TABLE 34 Global Services Market by Region, 2023 - 2030, USD Million
- TABLE 35 Global Spatial Computing Market by Technology, 2019 - 2022, USD Million
- TABLE 36 Global Spatial Computing Market by Technology, 2023 - 2030, USD Million
- TABLE 37 Global Augmented Reality Market by Region, 2019 - 2022, USD Million
- TABLE 38 Global Augmented Reality Market by Region, 2023 - 2030, USD Million
- TABLE 39 Global Virtual Reality Market by Region, 2019 - 2022, USD Million
- TABLE 40 Global Virtual Reality Market by Region, 2023 - 2030, USD Million
- TABLE 41 Global Mixed Reality Market by Region, 2019 - 2022, USD Million
- TABLE 42 Global Mixed Reality Market by Region, 2023 - 2030, USD Million
- TABLE 43 Global Artificial Intelligence Market by Region, 2019 - 2022, USD Million
- TABLE 44 Global Artificial Intelligence Market by Region, 2023 - 2030, USD Million
- TABLE 45 Global Internet of Things (IoT) Market by Region, 2019 - 2022, USD Million
- TABLE 46 Global Internet of Things (IoT) Market by Region, 2023 - 2030, USD Million
- TABLE 47 Global Digital Twins Market by Region, 2019 - 2022, USD Million
- TABLE 48 Global Digital Twins Market by Region, 2023 - 2030, USD Million
- TABLE 49 Global Others Market by Region, 2019 - 2022, USD Million
- TABLE 50 Global Others Market by Region, 2023 - 2030, USD Million
- TABLE 51 Global Spatial Computing Market by Region, 2019 - 2022, USD Million
- TABLE 52 Global Spatial Computing Market by Region, 2023 - 2030, USD Million
- TABLE 53 North America Spatial Computing Market, 2019 - 2022, USD Million
- TABLE 54 North America Spatial Computing Market, 2023 - 2030, USD Million
- TABLE 55 North America Spatial Computing Market by End User, 2019 - 2022, USD Million
- TABLE 56 North America Spatial Computing Market by End User, 2023 - 2030, USD Million
- TABLE 57 North America Healthcare Market by Country, 2019 - 2022, USD Million
- TABLE 58 North America Healthcare Market by Country, 2023 - 2030, USD Million
- TABLE 59 North America Aerospace & Defense Market by Country, 2019 - 2022, USD Million
- TABLE 60 North America Aerospace & Defense Market by Country, 2023 - 2030, USD Million
- TABLE 61 North America Automotive Market by Country, 2019 - 2022, USD Million
- TABLE 62 North America Automotive Market by Country, 2023 - 2030, USD Million
- TABLE 63 North America Energy & Utilities Market by Country, 2019 - 2022, USD Million
- TABLE 64 North America Energy & Utilities Market by Country, 2023 - 2030, USD Million
- TABLE 65 North America Gaming Market by Country, 2019 - 2022, USD Million
- TABLE 66 North America Gaming Market by Country, 2023 - 2030, USD Million
- TABLE 67 North America Consumer Electronics Market by Country, 2019 - 2022, USD Million
- TABLE 68 North America Consumer Electronics Market by Country, 2023 - 2030, USD Million
- TABLE 69 North America Architecture, Engineering, and Construction (AEC) Market by Country, 2019 - 2022, USD Million
- TABLE 70 North America Architecture, Engineering, and Construction (AEC) Market by Country, 2023 - 2030, USD Million
- TABLE 71 North America Government and Public Sector Market by Country, 2019 - 2022, USD Million
- TABLE 72 North America Government and Public Sector Market by Country, 2023 - 2030, USD Million
- TABLE 73 North America Information Technology Market by Country, 2019 - 2022, USD Million
- TABLE 74 North America Information Technology Market by Country, 2023 - 2030, USD Million
- TABLE 75 North America Education Market by Country, 2019 - 2022, USD Million
- TABLE 76 North America Education Market by Country, 2023 - 2030, USD Million
- TABLE 77 North America Others Market by Country, 2019 - 2022, USD Million
- TABLE 78 North America Others Market by Country, 2023 - 2030, USD Million
- TABLE 79 North America Spatial Computing Market by Solution, 2019 - 2022, USD Million
- TABLE 80 North America Spatial Computing Market by Solution, 2023 - 2030, USD Million
- TABLE 81 North America Hardware Market by Country, 2019 - 2022, USD Million
- TABLE 82 North America Hardware Market by Country, 2023 - 2030, USD Million
- TABLE 83 North America Software Market by Country, 2019 - 2022, USD Million
- TABLE 84 North America Software Market by Country, 2023 - 2030, USD Million
- TABLE 85 North America Services Market by Country, 2019 - 2022, USD Million
- TABLE 86 North America Services Market by Country, 2023 - 2030, USD Million
- TABLE 87 North America Spatial Computing Market by Technology, 2019 - 2022, USD Million
- TABLE 88 North America Spatial Computing Market by Technology, 2023 - 2030, USD Million
- TABLE 89 North America Augmented Reality Market by Country, 2019 - 2022, USD Million
- TABLE 90 North America Augmented Reality Market by Country, 2023 - 2030, USD Million
- TABLE 91 North America Virtual Reality Market by Country, 2019 - 2022, USD Million
- TABLE 92 North America Virtual Reality Market by Country, 2023 - 2030, USD Million
- TABLE 93 North America Mixed Reality Market by Country, 2019 - 2022, USD Million
- TABLE 94 North America Mixed Reality Market by Country, 2023 - 2030, USD Million
- TABLE 95 North America Artificial Intelligence Market by Country, 2019 - 2022, USD Million
- TABLE 96 North America Artificial Intelligence Market by Country, 2023 - 2030, USD Million
- TABLE 97 North America Internet of Things (IoT) Market by Country, 2019 - 2022, USD Million
- TABLE 98 North America Internet of Things (IoT) Market by Country, 2023 - 2030, USD Million
- TABLE 99 North America Digital Twins Market by Country, 2019 - 2022, USD Million
- TABLE 100 North America Digital Twins Market by Country, 2023 - 2030, USD Million
- TABLE 101 North America Others Market by Country, 2019 - 2022, USD Million
- TABLE 102 North America Others Market by Country, 2023 - 2030, USD Million
- TABLE 103 North America Spatial Computing Market by Country, 2019 - 2022, USD Million
- TABLE 104 North America Spatial Computing Market by Country, 2023 - 2030, USD Million
- TABLE 105 US Spatial Computing Market, 2019 - 2022, USD Million
- TABLE 106 US Spatial Computing Market, 2023 - 2030, USD Million
- TABLE 107 US Spatial Computing Market by End User, 2019 - 2022, USD Million
- TABLE 108 US Spatial Computing Market by End User, 2023 - 2030, USD Million
- TABLE 109 US Spatial Computing Market by Solution, 2019 - 2022, USD Million
- TABLE 110 US Spatial Computing Market by Solution, 2023 - 2030, USD Million
- TABLE 111 US Spatial Computing Market by Technology, 2019 - 2022, USD Million
- TABLE 112 US Spatial Computing Market by Technology, 2023 - 2030, USD Million
- TABLE 113 Canada Spatial Computing Market, 2019 - 2022, USD Million
- TABLE 114 Canada Spatial Computing Market, 2023 - 2030, USD Million
- TABLE 115 Canada Spatial Computing Market by End User, 2019 - 2022, USD Million
- TABLE 116 Canada Spatial Computing Market by End User, 2023 - 2030, USD Million
- TABLE 117 Canada Spatial Computing Market by Solution, 2019 - 2022, USD Million
- TABLE 118 Canada Spatial Computing Market by Solution, 2023 - 2030, USD Million
- TABLE 119 Canada Spatial Computing Market by Technology, 2019 - 2022, USD Million
- TABLE 120 Canada Spatial Computing Market by Technology, 2023 - 2030, USD Million
- TABLE 121 Mexico Spatial Computing Market, 2019 - 2022, USD Million
- TABLE 122 Mexico Spatial Computing Market, 2023 - 2030, USD Million
- TABLE 123 Mexico Spatial Computing Market by End User, 2019 - 2022, USD Million
- TABLE 124 Mexico Spatial Computing Market by End User, 2023 - 2030, USD Million
- TABLE 125 Mexico Spatial Computing Market by Solution, 2019 - 2022, USD Million
- TABLE 126 Mexico Spatial Computing Market by Solution, 2023 - 2030, USD Million
- TABLE 127 Mexico Spatial Computing Market by Technology, 2019 - 2022, USD Million
- TABLE 128 Mexico Spatial Computing Market by Technology, 2023 - 2030, USD Million
- TABLE 129 Rest of North America Spatial Computing Market, 2019 - 2022, USD Million
- TABLE 130 Rest of North America Spatial Computing Market, 2023 - 2030, USD Million
- TABLE 131 Rest of North America Spatial Computing Market by End User, 2019 - 2022, USD Million
- TABLE 132 Rest of North America Spatial Computing Market by End User, 2023 - 2030, USD Million
- TABLE 133 Rest of North America Spatial Computing Market by Solution, 2019 - 2022, USD Million
- TABLE 134 Rest of North America Spatial Computing Market by Solution, 2023 - 2030, USD Million
- TABLE 135 Rest of North America Spatial Computing Market by Technology, 2019 - 2022, USD Million
- TABLE 136 Rest of North America Spatial Computing Market by Technology, 2023 - 2030, USD Million
- TABLE 137 Europe Spatial Computing Market, 2019 - 2022, USD Million
- TABLE 138 Europe Spatial Computing Market, 2023 - 2030, USD Million
- TABLE 139 Europe Spatial Computing Market by End User, 2019 - 2022, USD Million
- TABLE 140 Europe Spatial Computing Market by End User, 2023 - 2030, USD Million
- TABLE 141 Europe Healthcare Market by Country, 2019 - 2022, USD Million
- TABLE 142 Europe Healthcare Market by Country, 2023 - 2030, USD Million
- TABLE 143 Europe Aerospace & Defense Market by Country, 2019 - 2022, USD Million
- TABLE 144 Europe Aerospace & Defense Market by Country, 2023 - 2030, USD Million
- TABLE 145 Europe Automotive Market by Country, 2019 - 2022, USD Million
- TABLE 146 Europe Automotive Market by Country, 2023 - 2030, USD Million
- TABLE 147 Europe Energy & Utilities Market by Country, 2019 - 2022, USD Million
- TABLE 148 Europe Energy & Utilities Market by Country, 2023 - 2030, USD Million
- TABLE 149 Europe Gaming Market by Country, 2019 - 2022, USD Million
- TABLE 150 Europe Gaming Market by Country, 2023 - 2030, USD Million
- TABLE 151 Europe Consumer Electronics Market by Country, 2019 - 2022, USD Million
- TABLE 152 Europe Consumer Electronics Market by Country, 2023 - 2030, USD Million
- TABLE 153 Europe Architecture, Engineering, and Construction (AEC) Market by Country, 2019 - 2022, USD Million
- TABLE 154 Europe Architecture, Engineering, and Construction (AEC) Market by Country, 2023 - 2030, USD Million
- TABLE 155 Europe Government and Public Sector Market by Country, 2019 - 2022, USD Million
- TABLE 156 Europe Government and Public Sector Market by Country, 2023 - 2030, USD Million
- TABLE 157 Europe Information Technology Market by Country, 2019 - 2022, USD Million
- TABLE 158 Europe Information Technology Market by Country, 2023 - 2030, USD Million
- TABLE 159 Europe Education Market by Country, 2019 - 2022, USD Million
- TABLE 160 Europe Education Market by Country, 2023 - 2030, USD Million
- TABLE 161 Europe Others Market by Country, 2019 - 2022, USD Million
- TABLE 162 Europe Others Market by Country, 2023 - 2030, USD Million
- TABLE 163 Europe Spatial Computing Market by Solution, 2019 - 2022, USD Million
- TABLE 164 Europe Spatial Computing Market by Solution, 2023 - 2030, USD Million
- TABLE 165 Europe Hardware Market by Country, 2019 - 2022, USD Million
- TABLE 166 Europe Hardware Market by Country, 2023 - 2030, USD Million
- TABLE 167 Europe Software Market by Country, 2019 - 2022, USD Million
- TABLE 168 Europe Software Market by Country, 2023 - 2030, USD Million
- TABLE 169 Europe Services Market by Country, 2019 - 2022, USD Million
- TABLE 170 Europe Services Market by Country, 2023 - 2030, USD Million
- TABLE 171 Europe Spatial Computing Market by Technology, 2019 - 2022, USD Million
- TABLE 172 Europe Spatial Computing Market by Technology, 2023 - 2030, USD Million
- TABLE 173 Europe Augmented Reality Market by Country, 2019 - 2022, USD Million
- TABLE 174 Europe Augmented Reality Market by Country, 2023 - 2030, USD Million
- TABLE 175 Europe Virtual Reality Market by Country, 2019 - 2022, USD Million
- TABLE 176 Europe Virtual Reality Market by Country, 2023 - 2030, USD Million
- TABLE 177 Europe Mixed Reality Market by Country, 2019 - 2022, USD Million
- TABLE 178 Europe Mixed Reality Market by Country, 2023 - 2030, USD Million
- TABLE 179 Europe Artificial Intelligence Market by Country, 2019 - 2022, USD Million
- TABLE 180 Europe Artificial Intelligence Market by Country, 2023 - 2030, USD Million
- TABLE 181 Europe Internet of Things (IoT) Market by Country, 2019 - 2022, USD Million
- TABLE 182 Europe Internet of Things (IoT) Market by Country, 2023 - 2030, USD Million
- TABLE 183 Europe Digital Twins Market by Country, 2019 - 2022, USD Million
- TABLE 184 Europe Digital Twins Market by Country, 2023 - 2030, USD Million
- TABLE 185 Europe Others Market by Country, 2019 - 2022, USD Million
- TABLE 186 Europe Others Market by Country, 2023 - 2030, USD Million
- TABLE 187 Europe Spatial Computing Market by Country, 2019 - 2022, USD Million
- TABLE 188 Europe Spatial Computing Market by Country, 2023 - 2030, USD Million
- TABLE 189 Germany Spatial Computing Market, 2019 - 2022, USD Million
- TABLE 190 Germany Spatial Computing Market, 2023 - 2030, USD Million
- TABLE 191 Germany Spatial Computing Market by End User, 2019 - 2022, USD Million
- TABLE 192 Germany Spatial Computing Market by End User, 2023 - 2030, USD Million
- TABLE 193 Germany Spatial Computing Market by Solution, 2019 - 2022, USD Million
- TABLE 194 Germany Spatial Computing Market by Solution, 2023 - 2030, USD Million
- TABLE 195 Germany Spatial Computing Market by Technology, 2019 - 2022, USD Million
- TABLE 196 Germany Spatial Computing Market by Technology, 2023 - 2030, USD Million
- TABLE 197 UK Spatial Computing Market, 2019 - 2022, USD Million
- TABLE 198 UK Spatial Computing Market, 2023 - 2030, USD Million
- TABLE 199 UK Spatial Computing Market by End User, 2019 - 2022, USD Million
- TABLE 200 UK Spatial Computing Market by End User, 2023 - 2030, USD Million
- TABLE 201 UK Spatial Computing Market by Solution, 2019 - 2022, USD Million
- TABLE 202 UK Spatial Computing Market by Solution, 2023 - 2030, USD Million
- TABLE 203 UK Spatial Computing Market by Technology, 2019 - 2022, USD Million
- TABLE 204 UK Spatial Computing Market by Technology, 2023 - 2030, USD Million
- TABLE 205 France Spatial Computing Market, 2019 - 2022, USD Million
- TABLE 206 France Spatial Computing Market, 2023 - 2030, USD Million
- TABLE 207 France Spatial Computing Market by End User, 2019 - 2022, USD Million
- TABLE 208 France Spatial Computing Market by End User, 2023 - 2030, USD Million
- TABLE 209 France Spatial Computing Market by Solution, 2019 - 2022, USD Million
- TABLE 210 France Spatial Computing Market by Solution, 2023 - 2030, USD Million
- TABLE 211 France Spatial Computing Market by Technology, 2019 - 2022, USD Million
- TABLE 212 France Spatial Computing Market by Technology, 2023 - 2030, USD Million
- TABLE 213 Russia Spatial Computing Market, 2019 - 2022, USD Million
- TABLE 214 Russia Spatial Computing Market, 2023 - 2030, USD Million
- TABLE 215 Russia Spatial Computing Market by End User, 2019 - 2022, USD Million
- TABLE 216 Russia Spatial Computing Market by End User, 2023 - 2030, USD Million
- TABLE 217 Russia Spatial Computing Market by Solution, 2019 - 2022, USD Million
- TABLE 218 Russia Spatial Computing Market by Solution, 2023 - 2030, USD Million
- TABLE 219 Russia Spatial Computing Market by Technology, 2019 - 2022, USD Million
- TABLE 220 Russia Spatial Computing Market by Technology, 2023 - 2030, USD Million
- TABLE 221 Spain Spatial Computing Market, 2019 - 2022, USD Million
- TABLE 222 Spain Spatial Computing Market, 2023 - 2030, USD Million
- TABLE 223 Spain Spatial Computing Market by End User, 2019 - 2022, USD Million
- TABLE 224 Spain Spatial Computing Market by End User, 2023 - 2030, USD Million
- TABLE 225 Spain Spatial Computing Market by Solution, 2019 - 2022, USD Million
- TABLE 226 Spain Spatial Computing Market by Solution, 2023 - 2030, USD Million
- TABLE 227 Spain Spatial Computing Market by Technology, 2019 - 2022, USD Million
- TABLE 228 Spain Spatial Computing Market by Technology, 2023 - 2030, USD Million
- TABLE 229 Italy Spatial Computing Market, 2019 - 2022, USD Million
- TABLE 230 Italy Spatial Computing Market, 2023 - 2030, USD Million
- TABLE 231 Italy Spatial Computing Market by End User, 2019 - 2022, USD Million
- TABLE 232 Italy Spatial Computing Market by End User, 2023 - 2030, USD Million
- TABLE 233 Italy Spatial Computing Market by Solution, 2019 - 2022, USD Million
- TABLE 234 Italy Spatial Computing Market by Solution, 2023 - 2030, USD Million
- TABLE 235 Italy Spatial Computing Market by Technology, 2019 - 2022, USD Million
- TABLE 236 Italy Spatial Computing Market by Technology, 2023 - 2030, USD Million
- TABLE 237 Rest of Europe Spatial Computing Market, 2019 - 2022, USD Million
- TABLE 238 Rest of Europe Spatial Computing Market, 2023 - 2030, USD Million
- TABLE 239 Rest of Europe Spatial Computing Market by End User, 2019 - 2022, USD Million
- TABLE 240 Rest of Europe Spatial Computing Market by End User, 2023 - 2030, USD Million
- TABLE 241 Rest of Europe Spatial Computing Market by Solution, 2019 - 2022, USD Million
- TABLE 242 Rest of Europe Spatial Computing Market by Solution, 2023 - 2030, USD Million
- TABLE 243 Rest of Europe Spatial Computing Market by Technology, 2019 - 2022, USD Million
- TABLE 244 Rest of Europe Spatial Computing Market by Technology, 2023 - 2030, USD Million
- TABLE 245 Asia Pacific Spatial Computing Market, 2019 - 2022, USD Million
- TABLE 246 Asia Pacific Spatial Computing Market, 2023 - 2030, USD Million
- TABLE 247 Asia Pacific Spatial Computing Market by End User, 2019 - 2022, USD Million
- TABLE 248 Asia Pacific Spatial Computing Market by End User, 2023 - 2030, USD Million
- TABLE 249 Asia Pacific Healthcare Market by Country, 2019 - 2022, USD Million
- TABLE 250 Asia Pacific Healthcare Market by Country, 2023 - 2030, USD Million
- TABLE 251 Asia Pacific Aerospace & Defense Market by Country, 2019 - 2022, USD Million
- TABLE 252 Asia Pacific Aerospace & Defense Market by Country, 2023 - 2030, USD Million
- TABLE 253 Asia Pacific Automotive Market by Country, 2019 - 2022, USD Million
- TABLE 254 Asia Pacific Automotive Market by Country, 2023 - 2030, USD Million
- TABLE 255 Asia Pacific Energy & Utilities Market by Country, 2019 - 2022, USD Million
- TABLE 256 Asia Pacific Energy & Utilities Market by Country, 2023 - 2030, USD Million
- TABLE 257 Asia Pacific Gaming Market by Country, 2019 - 2022, USD Million
- TABLE 258 Asia Pacific Gaming Market by Country, 2023 - 2030, USD Million
- TABLE 259 Asia Pacific Consumer Electronics Market by Country, 2019 - 2022, USD Million
- TABLE 260 Asia Pacific Consumer Electronics Market by Country, 2023 - 2030, USD Million
- TABLE 261 Asia Pacific Architecture, Engineering, and Construction (AEC) Market by Country, 2019 - 2022, USD Million
- TABLE 262 Asia Pacific Architecture, Engineering, and Construction (AEC) Market by Country, 2023 - 2030, USD Million
- TABLE 263 Asia Pacific Government and Public Sector Market by Country, 2019 - 2022, USD Million
- TABLE 264 Asia Pacific Government and Public Sector Market by Country, 2023 - 2030, USD Million
- TABLE 265 Asia Pacific Information Technology Market by Country, 2019 - 2022, USD Million
- TABLE 266 Asia Pacific Information Technology Market by Country, 2023 - 2030, USD Million
- TABLE 267 Asia Pacific Education Market by Country, 2019 - 2022, USD Million
- TABLE 268 Asia Pacific Education Market by Country, 2023 - 2030, USD Million
- TABLE 269 Asia Pacific Others Market by Country, 2019 - 2022, USD Million
- TABLE 270 Asia Pacific Others Market by Country, 2023 - 2030, USD Million
- TABLE 271 Asia Pacific Spatial Computing Market by Solution, 2019 - 2022, USD Million
- TABLE 272 Asia Pacific Spatial Computing Market by Solution, 2023 - 2030, USD Million
- TABLE 273 Asia Pacific Hardware Market by Country, 2019 - 2022, USD Million
- TABLE 274 Asia Pacific Hardware Market by Country, 2023 - 2030, USD Million
- TABLE 275 Asia Pacific Software Market by Country, 2019 - 2022, USD Million
- TABLE 276 Asia Pacific Software Market by Country, 2023 - 2030, USD Million
- TABLE 277 Asia Pacific Services Market by Country, 2019 - 2022, USD Million
- TABLE 278 Asia Pacific Services Market by Country, 2023 - 2030, USD Million
- TABLE 279 Asia Pacific Spatial Computing Market by Technology, 2019 - 2022, USD Million
- TABLE 280 Asia Pacific Spatial Computing Market by Technology, 2023 - 2030, USD Million
- TABLE 281 Asia Pacific Augmented Reality Market by Country, 2019 - 2022, USD Million
- TABLE 282 Asia Pacific Augmented Reality Market by Country, 2023 - 2030, USD Million
- TABLE 283 Asia Pacific Virtual Reality Market by Country, 2019 - 2022, USD Million
- TABLE 284 Asia Pacific Virtual Reality Market by Country, 2023 - 2030, USD Million
- TABLE 285 Asia Pacific Mixed Reality Market by Country, 2019 - 2022, USD Million
- TABLE 286 Asia Pacific Mixed Reality Market by Country, 2023 - 2030, USD Million
- TABLE 287 Asia Pacific Artificial Intelligence Market by Country, 2019 - 2022, USD Million
- TABLE 288 Asia Pacific Artificial Intelligence Market by Country, 2023 - 2030, USD Million
- TABLE 289 Asia Pacific Internet of Things (IoT) Market by Country, 2019 - 2022, USD Million
- TABLE 290 Asia Pacific Internet of Things (IoT) Market by Country, 2023 - 2030, USD Million
- TABLE 291 Asia Pacific Digital Twins Market by Country, 2019 - 2022, USD Million
- TABLE 292 Asia Pacific Digital Twins Market by Country, 2023 - 2030, USD Million
- TABLE 293 Asia Pacific Others Market by Country, 2019 - 2022, USD Million
- TABLE 294 Asia Pacific Others Market by Country, 2023 - 2030, USD Million
- TABLE 295 Asia Pacific Spatial Computing Market by Country, 2019 - 2022, USD Million
- TABLE 296 Asia Pacific Spatial Computing Market by Country, 2023 - 2030, USD Million
- TABLE 297 China Spatial Computing Market, 2019 - 2022, USD Million
- TABLE 298 China Spatial Computing Market, 2023 - 2030, USD Million
- TABLE 299 China Spatial Computing Market by End User, 2019 - 2022, USD Million
- TABLE 300 China Spatial Computing Market by End User, 2023 - 2030, USD Million
- TABLE 301 China Spatial Computing Market by Solution, 2019 - 2022, USD Million
- TABLE 302 China Spatial Computing Market by Solution, 2023 - 2030, USD Million
- TABLE 303 China Spatial Computing Market by Technology, 2019 - 2022, USD Million
- TABLE 304 China Spatial Computing Market by Technology, 2023 - 2030, USD Million
The Global Spatial Computing Market size is expected to reach $423.5 billion by 2030, rising at a market growth of 20.3% CAGR during the forecast period.
Consumer electronics devices like tablets and laptops are increasingly used in educational settings. Spatial computing apps and educational content can provide students with immersive learning experiences. Consequently, the consumer electronics segment would generate approximately 1/5th share of the market by 2030. Spatial computing apps and educational content can provide students with immersive learning experiences. Consumer electronics companies have introduced VR headsets like Oculus Rift and HTC Vive, AR headsets like Microsoft HoloLens, and AR glasses like Google Glass. As consumer demand for immersive and interactive experiences grows, innovation and investment in developing spatial computing applications and hardware drive innovation. Some of the factors affecting the market are significant improvements in hardware, expansion of the gaming and entertainment industry, and privacy and security concerns.
Advances in hardware, including augmented reality (AR) and virtual reality (VR) headsets, significantly impact the market. These improvements include higher-resolution displays, more powerful processors, better tracking capabilities, and enhanced ergonomics. As hardware becomes more capable and affordable, it drives greater adoption. More powerful and energy-efficient processors like CPUs and GPUs enable spatial computing devices to handle complex computational tasks, render high-quality graphics, and run sophisticated algorithms in real-time. Moreover, the gaming and entertainment industry has been a significant driver. VR gaming and immersive entertainment experiences continue to attract consumers and drive demand for VR headsets and content. Augmented reality gaming blends the virtual and real worlds, overlaying digital elements onto the user's physical environment. AR games encourage players to move and explore their surroundings while interacting with virtual objects and characters. Popular examples include Pokemon GO and AR escape room games. As these technologies become more integrated into the automotive ecosystem, they have the potential to drive significant growth in the market, benefiting both the automotive sector and consumers.
However, Spatial computing technologies involve sensors and cameras that capture and process data about the user's environment. Ensuring the privacy and security of this data is crucial to building trust among users and addressing potential privacy-related challenges. Spatial computing devices often collect data about users' surroundings, movements, and interactions. This data includes images, videos, and sensor readings. Ensuring the privacy of this data is crucial to protect users from unauthorized surveillance and data breaches. Therefore, regulatory and ethical issues present significant challenges that can impede the growth and adoption of the market.
End User Outlook
On the basis of end user, the market is divided into healthcare, education, architecture, engineering, & construction (AEC), aerospace & defense, automotive, gaming, consumer electronics, government & public sector, information technology, energy & utilities, and others. In 2022, the healthcare segment dominated the market with maximum revenue share. Spatial computing technology adoption is significantly increasing in the healthcare segment. Virtual reality (VR) and magnetic resonance (MR) simulations provide hands-on experiences for surgical training, patient examination, and medical interventions, allowing healthcare professionals to improve their abilities and expertise without risking patient security.
Solution Outlook
By solution, the market is categorized into hardware devices, software, and services. The software segment covered a considerable revenue share in the market in 2022. In addition to hardware devices, software solutions play a significant role in expanding the market because they enable the creation and deployment of immersive and interactive virtual reality, augmented reality, and mixed reality experiences. Content creation tools are software programs that enable developers, designers, and artists to create these experiences. These tools include 3D modeling and animation software, gaming engines, and authoring tools for VR, AR, and MR content.
Technology Outlook
Based on technology, the market is classified into artificial intelligence, augmented reality, virtual reality, mixed reality, Internet of Things (IoT), digital twins, and others. In 2022, the augmented reality segment witnessed the largest revenue share in the market in 2022. AR augments the real-world environment by superimposing digital information, such as 3D objects, images, video, and textual data, onto the user's view, typically via mobile devices or AR spectacles. The pervasive adoption of smartphones and tablets equipped with sophisticated cameras and sensors has made augmented reality (AR) accessible to a wide audience. Lightweight and more aesthetically pleasing AR glasses have been created due to technologies and miniaturization. Microsoft (HoloLens), Google (Google Glass), and Apple (VisionPro) are investing in augmented reality (AR) spectacles.
Regional Outlook
Region-wise, the market is analysed across North America, Europe, Asia Pacific, and LAMEA. In 2022, the Asia Pacific region acquired a significant revenue share in the market. Asia Pacific is a diversified and developing market with a sizable population, significant technological advancements, and rising use of digital technology. Smart technologies, such as wearables, tablets, and smartphones, have been quickly embraced throughout the region. These devices are the primary platforms for gaining access to spatial computing experiences. In countries such as China, India, Japan, and South Korea, the increasing prevalence of smart devices has generated a substantial user base for computing devices.
The market research report covers the analysis of key stakeholders of the market. Key companies profiled in the report include Apple Inc., Avegant Corporation, Blippar Group Limited, Seiko Epson Corporation, Google LLC, HTC Corporation, Lenovo Group Limited, Magic Leap, Inc., Microsoft Corporation, NVIDIA Corporation.
Strategies Deployed in-Spatial Computing Market
Aug-2023: Lenovo Group Limited came into partnership with VMware, a global leader in virtualization and cloud computing software, offering solutions for businesses to efficiently manage and optimize their IT infrastructure. Through this partnership, both the companies would be able to assist organizations of various scales in their digital transformation journey by investing in the essential infrastructure needed to support cutting-edge applications, including Generative AI.
Feb-2023: Google LLC came into Partnership with Samsung, a multinational conglomerate renowned for its diverse range of products and services, including electronics, smartphones, appliances, and semiconductor manufacturing and Qualcomm, a leading global semiconductor and telecommunications equipment company, recognized for its innovations in mobile technology and wireless communications. Through this partnership, all the companies would combine work on a project to build a w Mixed-Reality Platform.
Jul-2022: Magic Leap, Inc. came into partnership with NavVis, a German technology company specializing in indoor mapping and navigation solutions for various industries. Through this partnership, both the companies combining aimed to improve AR applications in industries like automotive and manufacturing, offering detailed and accurate 3D digital twin data.
Oct-2021: Seiko Epson Corporation came into partnership with AVI-SPL, a global technology solutions provider specializing in audiovisual and collaboration systems for businesses and organizations and Igloo Vision, a company known for creating immersive 360-degree projection environments and domes for various applications, including virtual reality experiences and data visualization. Through this partnership, all the companies would launch AVI-SPL XTG experience centre offers designers and clients an opportunity to personally witness the capabilities of immersive visual experiences and collaborative solutions.
Jan-2021: Google LLC came into partnership with Magic Leap, a pioneering augmented reality (AR) technology company known for creating mixed reality headsets and spatial computing experiences. Through this partnership, Magic Leap will make its enterprise solutions available on the Google Cloud Marketplace and investigate the development of possible new cloud-driven spatial computing solutions hosted on Google Cloud.
Nov-2019: Lenovo Group Limited Signed Collaboration with Varjo, a pioneering company in the field of high-performance mixed reality and virtual reality technologies, offering advanced headsets for professional use. Through this Collaboration, both the companies would be able to provide simplified process of adoption, enabling organizations to swiftly access the tools required to leverage the numerous advantages of virtual reality.
May-2019: Magic Leap Inc. took over Mimesys, a technology company specializing in holographic communication and spatial computing solutions. Through this acquisition, Magic leap would be able to provide their customer with a platform that transforms a sci-fi notion into reality, enabling individuals separated by distance to virtually gather in an empty meeting room as holographic figures, facilitating interactive communication, collaboration with 3D objects, and the expression of emotions and body language among colleagues.
Scope of the Study
Market Segments covered in the Report:
By End User
- Healthcare
- Aerospace & Defense
- Automotive
- Energy & Utilities
- Gaming
- Consumer Electronics
- Architecture, Engineering, and Construction (AEC)
- Government and Public Sector
- Information Technology
- Education
- Others
By Solution
- Hardware
- Software
- Services
By Technology
- Augmented Reality
- Virtual Reality
- Mixed Reality
- Artificial Intelligence
- Internet of Things (IoT)
- Digital Twins
- Others
By Geography
- North America
- US
- Canada
- Mexico
- Rest of North America
- Europe
- Germany
- UK
- France
- Russia
- Spain
- Italy
- Rest of Europe
- Asia Pacific
- China
- Japan
- India
- South Korea
- Singapore
- Malaysia
- Rest of Asia Pacific
- LAMEA
- Brazil
- Argentina
- UAE
- Saudi Arabia
- South Africa
- Nigeria
- Rest of LAMEA
Companies Profiled
- Apple Inc.
- Avegant Corporation
- Blippar Group Limited
- Seiko Epson Corporation
- Google LLC
- HTC Corporation
- Lenovo Group Limited
- Magic Leap, Inc.
- Microsoft Corporation
- NVIDIA Corporation
Unique Offerings from KBV Research
- Exhaustive coverage
- Highest number of market tables and figures
- Subscription based model available
- Guaranteed best price
- Assured post sales research support with 10% customization free
Table of Contents
Chapter 1. Market Scope & Methodology
- 1.1 Market Definition
- 1.2 Objectives
- 1.3 Market Scope
- 1.4 Segmentation
- 1.4.1 Global Spatial Computing Market, by End User
- 1.4.2 Global Spatial Computing Market, by Solution
- 1.4.3 Global Spatial Computing Market, by Technology
- 1.4.4 Global Spatial Computing Market, by Geography
- 1.5 Methodology for the research
Chapter 2. Market at a Glance
- 2.1 Key Highlights
Chapter 3. Market Overview
- 3.1 Introduction
- 3.1.1 Overview
- 3.1.1.1 Market Composition and Scenario
- 3.1.1 Overview
- 3.2 Key Factors Impacting the Market
- 3.2.1 Market Drivers
- 3.2.2 Market Restraints
Chapter 4. Competition Analysis - Global
- 4.1 Market Share Analysis, 2022
- 4.2 Strategies Deployed in-Spatial Computing Market
- 4.3 Porter Five Forces Analysis
Chapter 5. Global Spatial Computing Market by End User
- 5.1 Global Healthcare Market by Region
- 5.2 Global Aerospace & Defense Market by Region
- 5.3 Global Automotive Market by Region
- 5.4 Global Energy & Utilities Market by Region
- 5.5 Global Gaming Market by Region
- 5.6 Global Consumer Electronics Market by Region
- 5.7 Global Architecture, Engineering, and Construction (AEC) Market by Region
- 5.8 Global Government and Public Sector Market by Region
- 5.9 Global Information Technology Market by Region
- 5.1 Global Education Market by Region
- 5.11 Global Others Market by Region
Chapter 6. Global Spatial Computing Market by Solution
- 6.1 Global Hardware Market by Region
- 6.2 Global Software Market by Region
- 6.3 Global Services Market by Region
Chapter 7. Global Spatial Computing Market by Technology
- 7.1 Global Augmented Reality Market by Region
- 7.2 Global Virtual Reality Market by Region
- 7.3 Global Mixed Reality Market by Region
- 7.4 Global Artificial Intelligence Market by Region
- 7.5 Global Internet of Things (IoT) Market by Region
- 7.6 Global Digital Twins Market by Region
- 7.7 Global Others Market by Region
Chapter 8. Global Spatial Computing Market by Region
- 8.1 North America Spatial Computing Market
- 8.1.1 North America Spatial Computing Market by End User
- 8.1.1.1 North America Healthcare Market by Country
- 8.1.1.2 North America Aerospace & Defense Market by Country
- 8.1.1.3 North America Automotive Market by Country
- 8.1.1.4 North America Energy & Utilities Market by Country
- 8.1.1.5 North America Gaming Market by Country
- 8.1.1.6 North America Consumer Electronics Market by Country
- 8.1.1.7 North America Architecture, Engineering, and Construction (AEC) Market by Country
- 8.1.1.8 North America Government and Public Sector Market by Country
- 8.1.1.9 North America Information Technology Market by Country
- 8.1.1.10 North America Education Market by Country
- 8.1.1.11 North America Others Market by Country
- 8.1.2 North America Spatial Computing Market by Solution
- 8.1.2.1 North America Hardware Market by Country
- 8.1.2.2 North America Software Market by Country
- 8.1.2.3 North America Services Market by Country
- 8.1.3 North America Spatial Computing Market by Technology
- 8.1.3.1 North America Augmented Reality Market by Country
- 8.1.3.2 North America Virtual Reality Market by Country
- 8.1.3.3 North America Mixed Reality Market by Country
- 8.1.3.4 North America Artificial Intelligence Market by Country
- 8.1.3.5 North America Internet of Things (IoT) Market by Country
- 8.1.3.6 North America Digital Twins Market by Country
- 8.1.3.7 North America Others Market by Country
- 8.1.4 North America Spatial Computing Market by Country
- 8.1.4.1 US Spatial Computing Market
- 8.1.4.1.1 US Spatial Computing Market by End User
- 8.1.4.1.2 US Spatial Computing Market by Solution
- 8.1.4.1.3 US Spatial Computing Market by Technology
- 8.1.4.2 Canada Spatial Computing Market
- 8.1.4.2.1 Canada Spatial Computing Market by End User
- 8.1.4.2.2 Canada Spatial Computing Market by Solution
- 8.1.4.2.3 Canada Spatial Computing Market by Technology
- 8.1.4.3 Mexico Spatial Computing Market
- 8.1.4.3.1 Mexico Spatial Computing Market by End User
- 8.1.4.3.2 Mexico Spatial Computing Market by Solution
- 8.1.4.3.3 Mexico Spatial Computing Market by Technology
- 8.1.4.4 Rest of North America Spatial Computing Market
- 8.1.4.4.1 Rest of North America Spatial Computing Market by End User
- 8.1.4.4.2 Rest of North America Spatial Computing Market by Solution
- 8.1.4.4.3 Rest of North America Spatial Computing Market by Technology
- 8.1.4.1 US Spatial Computing Market
- 8.1.1 North America Spatial Computing Market by End User
- 8.2 Europe Spatial Computing Market
- 8.2.1 Europe Spatial Computing Market by End User
- 8.2.1.1 Europe Healthcare Market by Country
- 8.2.1.2 Europe Aerospace & Defense Market by Country
- 8.2.1.3 Europe Automotive Market by Country
- 8.2.1.4 Europe Energy & Utilities Market by Country
- 8.2.1.5 Europe Gaming Market by Country
- 8.2.1.6 Europe Consumer Electronics Market by Country
- 8.2.1.7 Europe Architecture, Engineering, and Construction (AEC) Market by Country
- 8.2.1.8 Europe Government and Public Sector Market by Country
- 8.2.1.9 Europe Information Technology Market by Country
- 8.2.1.10 Europe Education Market by Country
- 8.2.1.11 Europe Others Market by Country
- 8.2.2 Europe Spatial Computing Market by Solution
- 8.2.2.1 Europe Hardware Market by Country
- 8.2.2.2 Europe Software Market by Country
- 8.2.2.3 Europe Services Market by Country
- 8.2.3 Europe Spatial Computing Market by Technology
- 8.2.3.1 Europe Augmented Reality Market by Country
- 8.2.3.2 Europe Virtual Reality Market by Country
- 8.2.3.3 Europe Mixed Reality Market by Country
- 8.2.3.4 Europe Artificial Intelligence Market by Country
- 8.2.3.5 Europe Internet of Things (IoT) Market by Country
- 8.2.3.6 Europe Digital Twins Market by Country
- 8.2.3.7 Europe Others Market by Country
- 8.2.4 Europe Spatial Computing Market by Country
- 8.2.4.1 Germany Spatial Computing Market
- 8.2.4.1.1 Germany Spatial Computing Market by End User
- 8.2.4.1.2 Germany Spatial Computing Market by Solution
- 8.2.4.1.3 Germany Spatial Computing Market by Technology
- 8.2.4.2 UK Spatial Computing Market
- 8.2.4.2.1 UK Spatial Computing Market by End User
- 8.2.4.2.2 UK Spatial Computing Market by Solution
- 8.2.4.2.3 UK Spatial Computing Market by Technology
- 8.2.4.3 France Spatial Computing Market
- 8.2.4.3.1 France Spatial Computing Market by End User
- 8.2.4.3.2 France Spatial Computing Market by Solution
- 8.2.4.3.3 France Spatial Computing Market by Technology
- 8.2.4.4 Russia Spatial Computing Market
- 8.2.4.4.1 Russia Spatial Computing Market by End User
- 8.2.4.4.2 Russia Spatial Computing Market by Solution
- 8.2.4.4.3 Russia Spatial Computing Market by Technology
- 8.2.4.5 Spain Spatial Computing Market
- 8.2.4.5.1 Spain Spatial Computing Market by End User
- 8.2.4.5.2 Spain Spatial Computing Market by Solution
- 8.2.4.5.3 Spain Spatial Computing Market by Technology
- 8.2.4.6 Italy Spatial Computing Market
- 8.2.4.6.1 Italy Spatial Computing Market by End User
- 8.2.4.6.2 Italy Spatial Computing Market by Solution
- 8.2.4.6.3 Italy Spatial Computing Market by Technology
- 8.2.4.7 Rest of Europe Spatial Computing Market
- 8.2.4.7.1 Rest of Europe Spatial Computing Market by End User
- 8.2.4.7.2 Rest of Europe Spatial Computing Market by Solution
- 8.2.4.7.3 Rest of Europe Spatial Computing Market by Technology
- 8.2.4.1 Germany Spatial Computing Market
- 8.2.1 Europe Spatial Computing Market by End User
- 8.3 Asia Pacific Spatial Computing Market
- 8.3.1 Asia Pacific Spatial Computing Market by End User
- 8.3.1.1 Asia Pacific Healthcare Market by Country
- 8.3.1.2 Asia Pacific Aerospace & Defense Market by Country
- 8.3.1.3 Asia Pacific Automotive Market by Country
- 8.3.1.4 Asia Pacific Energy & Utilities Market by Country
- 8.3.1.5 Asia Pacific Gaming Market by Country
- 8.3.1.6 Asia Pacific Consumer Electronics Market by Country
- 8.3.1.7 Asia Pacific Architecture, Engineering, and Construction (AEC) Market by Country
- 8.3.1.8 Asia Pacific Government and Public Sector Market by Country
- 8.3.1.9 Asia Pacific Information Technology Market by Country
- 8.3.1.10 Asia Pacific Education Market by Country
- 8.3.1.11 Asia Pacific Others Market by Country
- 8.3.2 Asia Pacific Spatial Computing Market by Solution
- 8.3.2.1 Asia Pacific Hardware Market by Country
- 8.3.2.2 Asia Pacific Software Market by Country
- 8.3.2.3 Asia Pacific Services Market by Country
- 8.3.3 Asia Pacific Spatial Computing Market by Technology
- 8.3.3.1 Asia Pacific Augmented Reality Market by Country
- 8.3.3.2 Asia Pacific Virtual Reality Market by Country
- 8.3.3.3 Asia Pacific Mixed Reality Market by Country
- 8.3.3.4 Asia Pacific Artificial Intelligence Market by Country
- 8.3.3.5 Asia Pacific Internet of Things (IoT) Market by Country
- 8.3.3.6 Asia Pacific Digital Twins Market by Country
- 8.3.3.7 Asia Pacific Others Market by Country
- 8.3.4 Asia Pacific Spatial Computing Market by Country
- 8.3.4.1 China Spatial Computing Market
- 8.3.4.1.1 China Spatial Computing Market by End User
- 8.3.4.1.2 China Spatial Computing Market by Solution
- 8.3.4.1.3 China Spatial Computing Market by Technology
- 8.3.4.2 Japan Spatial Computing Market
- 8.3.4.2.1 Japan Spatial Computing Market by End User
- 8.3.4.2.2 Japan Spatial Computing Market by Solution
- 8.3.4.2.3 Japan Spatial Computing Market by Technology
- 8.3.4.3 India Spatial Computing Market
- 8.3.4.3.1 India Spatial Computing Market by End User
- 8.3.4.3.2 India Spatial Computing Market by Solution
- 8.3.4.3.3 India Spatial Computing Market by Technology
- 8.3.4.4 South Korea Spatial Computing Market
- 8.3.4.4.1 South Korea Spatial Computing Market by End User
- 8.3.4.4.2 South Korea Spatial Computing Market by Solution
- 8.3.4.4.3 South Korea Spatial Computing Market by Technology
- 8.3.4.5 Singapore Spatial Computing Market
- 8.3.4.5.1 Singapore Spatial Computing Market by End User
- 8.3.4.5.2 Singapore Spatial Computing Market by Solution
- 8.3.4.5.3 Singapore Spatial Computing Market by Technology
- 8.3.4.6 Malaysia Spatial Computing Market
- 8.3.4.6.1 Malaysia Spatial Computing Market by End User
- 8.3.4.6.2 Malaysia Spatial Computing Market by Solution
- 8.3.4.6.3 Malaysia Spatial Computing Market by Technology
- 8.3.4.7 Rest of Asia Pacific Spatial Computing Market
- 8.3.4.7.1 Rest of Asia Pacific Spatial Computing Market by End User
- 8.3.4.7.2 Rest of Asia Pacific Spatial Computing Market by Solution
- 8.3.4.7.3 Rest of Asia Pacific Spatial Computing Market by Technology
- 8.3.4.1 China Spatial Computing Market
- 8.3.1 Asia Pacific Spatial Computing Market by End User
- 8.4 LAMEA Spatial Computing Market
- 8.4.1 LAMEA Spatial Computing Market by End User
- 8.4.1.1 LAMEA Healthcare Market by Country
- 8.4.1.2 LAMEA Aerospace & Defense Market by Country
- 8.4.1.3 LAMEA Automotive Market by Country
- 8.4.1.4 LAMEA Energy & Utilities Market by Country
- 8.4.1.5 LAMEA Gaming Market by Country
- 8.4.1.6 LAMEA Consumer Electronics Market by Country
- 8.4.1.7 LAMEA Architecture, Engineering, and Construction (AEC) Market by Country
- 8.4.1.8 LAMEA Government and Public Sector Market by Country
- 8.4.1.9 LAMEA Information Technology Market by Country
- 8.4.1.10 LAMEA Education Market by Country
- 8.4.1.11 LAMEA Others Market by Country
- 8.4.2 LAMEA Spatial Computing Market by Solution
- 8.4.2.1 LAMEA Hardware Market by Country
- 8.4.2.2 LAMEA Software Market by Country
- 8.4.2.3 LAMEA Services Market by Country
- 8.4.3 LAMEA Spatial Computing Market by Technology
- 8.4.3.1 LAMEA Augmented Reality Market by Country
- 8.4.3.2 LAMEA Virtual Reality Market by Country
- 8.4.3.3 LAMEA Mixed Reality Market by Country
- 8.4.3.4 LAMEA Artificial Intelligence Market by Country
- 8.4.3.5 LAMEA Internet of Things (IoT) Market by Country
- 8.4.3.6 LAMEA Digital Twins Market by Country
- 8.4.3.7 LAMEA Others Market by Country
- 8.4.4 LAMEA Spatial Computing Market by Country
- 8.4.4.1 Brazil Spatial Computing Market
- 8.4.4.1.1 Brazil Spatial Computing Market by End User
- 8.4.4.1.2 Brazil Spatial Computing Market by Solution
- 8.4.4.1.3 Brazil Spatial Computing Market by Technology
- 8.4.4.2 Argentina Spatial Computing Market
- 8.4.4.2.1 Argentina Spatial Computing Market by End User
- 8.4.4.2.2 Argentina Spatial Computing Market by Solution
- 8.4.4.2.3 Argentina Spatial Computing Market by Technology
- 8.4.4.3 UAE Spatial Computing Market
- 8.4.4.3.1 UAE Spatial Computing Market by End User
- 8.4.4.3.2 UAE Spatial Computing Market by Solution
- 8.4.4.3.3 UAE Spatial Computing Market by Technology
- 8.4.4.4 Saudi Arabia Spatial Computing Market
- 8.4.4.4.1 Saudi Arabia Spatial Computing Market by End User
- 8.4.4.4.2 Saudi Arabia Spatial Computing Market by Solution
- 8.4.4.4.3 Saudi Arabia Spatial Computing Market by Technology
- 8.4.4.5 South Africa Spatial Computing Market
- 8.4.4.5.1 South Africa Spatial Computing Market by End User
- 8.4.4.5.2 South Africa Spatial Computing Market by Solution
- 8.4.4.5.3 South Africa Spatial Computing Market by Technology
- 8.4.4.6 Nigeria Spatial Computing Market
- 8.4.4.6.1 Nigeria Spatial Computing Market by End User
- 8.4.4.6.2 Nigeria Spatial Computing Market by Solution
- 8.4.4.6.3 Nigeria Spatial Computing Market by Technology
- 8.4.4.7 Rest of LAMEA Spatial Computing Market
- 8.4.4.7.1 Rest of LAMEA Spatial Computing Market by End User
- 8.4.4.7.2 Rest of LAMEA Spatial Computing Market by Solution
- 8.4.4.7.3 Rest of LAMEA Spatial Computing Market by Technology
- 8.4.4.1 Brazil Spatial Computing Market
- 8.4.1 LAMEA Spatial Computing Market by End User
Chapter 9. Company Profiles
- 9.1 Apple, Inc.
- 9.1.1 Company Overview
- 9.1.2 Financial Analysis
- 9.1.3 Regional Analysis
- 9.1.4 Research & Development Expense
- 9.1.5 SWOT Analysis
- 9.2 Avegant Corporation
- 9.2.1 Company Overview
- 9.2.2 SWOT Analysis
- 9.3 Blippar Group Limited
- 9.3.1 Company Overview
- 9.3.2 SWOT Analysis
- 9.4 Seiko Epson Corporation
- 9.4.1 Company Overview
- 9.4.2 Financial Analysis
- 9.4.3 Segmental and Regional Analysis
- 9.4.4 Research & Development Expenses
- 9.4.5 Recent strategies and developments:
- 9.4.5.1 Partnerships, Collaborations, and Agreements:
- 9.4.6 SWOT Analysis
- 9.5 Google LLC (Alphabet Inc.)
- 9.5.1 Company Overview
- 9.5.2 Financial Analysis
- 9.5.3 Segmental and Regional Analysis
- 9.5.4 Research & Development Expense
- 9.5.5 Recent strategies and developments:
- 9.5.5.1 Partnerships, Collaborations, and Agreements:
- 9.5.6 SWOT Analysis
- 9.6 HTC Corporation
- 9.6.1 Company Overview
- 9.6.2 Financial Analysis
- 9.6.3 Regional Analysis
- 9.6.4 Research & Development Expense
- 9.6.5 SWOT Analysis
- 9.7 Lenovo Group Limited
- 9.7.1 Company Overview
- 9.7.2 Financial Analysis
- 9.7.3 Segmental and Regional Analysis
- 9.7.4 Research & Development Expense
- 9.7.5 Recent strategies and developments:
- 9.7.5.1 Partnerships, Collaborations, and Agreements:
- 9.7.6 SWOT Analysis
- 9.8 Magic Leap, Inc.
- 9.8.1 Company Overview
- 9.8.2 Recent strategies and developments:
- 9.8.2.1 Partnerships, Collaborations, and Agreements:
- 9.8.2.2 Acquisition and Mergers:
- 9.8.3 SWOT Analysis
- 9.9 Microsoft Corporation
- 9.9.1 Company Overview
- 9.9.2 Financial Analysis
- 9.9.3 Segmental and Regional Analysis
- 9.9.4 Research & Development Expenses
- 9.9.5 SWOT Analysis
- 9.10. NVIDIA Corporation
- 9.10.1 Company Overview
- 9.10.2 Financial Analysis
- 9.10.3 Segmental and Regional Analysis
- 9.10.4 Research & Development Expenses
- 9.10.5 SWOT Analysis
