|
|
市場調査レポート
商品コード
1762940
世界の中古車市場2025-2029Global Used Car Market 2025-2029 |
||||||

|
|||||||
カスタマイズ可能
|
|||||||

| 世界の中古車市場2025-2029 |
|
出版日: 2025年06月24日
発行: TechNavio
ページ情報: 英文 215 Pages
納期: 即納可能
|

全表示
- 概要
- 図表
- 目次
中古車市場は2024-2029年に8,853億米ドル、予測期間中のCAGRは7.4%で成長すると予測されます。
当レポートでは、中古車市場の全体的な分析、市場規模・予測、動向、成長促進要因、課題、約25のベンダーを網羅したベンダー分析などを掲載しています。
現在の市場シナリオ、最新動向と促進要因、市場環境全体に関する最新分析を提供しています。市場を牽引しているのは、競合の激化による新車発売台数の増加、新興国の都市部消費者の自動車所有サイクルの低下、中古車の優れたコストパフォーマンスの提案などです。
| 市場範囲 | |
|---|---|
| 基準年 | 2025 |
| 終了年 | 2029 |
| 予測期間 | 2025-2029 |
| 成長モメンタム | 加速 |
| 前年比 | 6.8% |
| CAGR | 7.4% |
| 増分額 | 8,853億米ドル |
本調査は、業界の主要参加者からのインプットを含め、一次情報と二次情報を客観的に組み合わせて実施しました。本レポートには、主要企業の分析に加え、包括的な市場規模データ、地域分析によるセグメント、ベンダー情勢が含まれています。レポートには過去データと予測データがあります。
本調査では、今後数年間の中古車市場の成長を促進する主な理由の一つとして、自動車サブスクリプションサービスに対する需要の高まりを挙げています。また、中古車を販売する自動販売機のプラットフォームや、中古車のオンラインポータルサイトにシフトするOEMは、市場の大きな需要につながります。
目次
第1章 エグゼクティブサマリー
- 市場概要
第2章 Technavio分析
- 価格・ライフサイクル・顧客購入バスケット・採用率・購入基準の分析
- インプットの重要性と差別化の要因
- 混乱の要因
- 促進要因と課題の影響
第3章 市場情勢
- 市場エコシステム
- 市場の特徴
- バリューチェーン分析
第4章 市場規模
- 市場の定義
- 市場セグメント分析
- 市場規模 2024
- 市場の見通し 2024-2029
第5章 市場規模実績
- 世界の中古車市場 2019-2023
- 車両タイプセグメント分析 2019-2023
- チャネルセグメント分析 2019-2023
- 燃料タイプセグメント分析 2019-2023
- 地域別セグメント分析 2019-2023
- 国別セグメント分析 2019-2023
第6章 定性分析
- AIの影響世界の中古車市場
第7章 ファイブフォース分析
- ファイブフォースの要約
- 買い手の交渉力
- 供給企業の交渉力
- 新規参入業者の脅威
- 代替品の脅威
- 競争の脅威
- 市況
第8章 市場セグメンテーション:車両タイプ別
- 市場セグメント
- 比較:車両タイプ別
- コンパクト:市場規模と予測 2024-2029
- SUV:市場規模と予測 2024-2029
- 中型サイズ:市場規模と予測 2024-2029
- 市場機会:車両タイプ別
第9章 市場セグメンテーション:チャネル別
- 市場セグメント
- 比較:チャネル別
- 整頓された:市場規模と予測 2024-2029
- 整理されていない:市場規模と予測 2024-2029
- 市場機会:チャネル別
第10章 市場セグメンテーション:燃料の種類別
- 市場セグメント
- 比較:燃料の種類別
- ディーゼル:市場規模と予測 2024-2029
- ガソリン:市場規模と予測 2024-2029
- 市場機会:燃料の種類別
第11章 顧客情勢
- 顧客情勢の概要
第12章 地域別情勢
- 地域別セグメンテーション
- 地域別比較
- アジア太平洋:市場規模と予測 2024-2029
- 北米:市場規模と予測 2024-2029
- 欧州:市場規模と予測 2024-2029
- 中東・アフリカ:市場規模と予測 2024-2029
- 南米:市場規模と予測 2024-2029
- 米国:市場規模と予測 2024-2029
- 中国:市場規模と予測 2024-2029
- 日本:市場規模と予測 2024-2029
- インド:市場規模と予測 2024-2029
- ドイツ:市場規模と予測 2024-2029
- カナダ:市場規模と予測 2024-2029
- 英国:市場規模と予測 2024-2029
- 韓国:市場規模と予測 2024-2029
- フランス:市場規模と予測 2024-2029
- ブラジル:市場規模と予測 2024-2029
- 市場機会:地域情勢別
第13章 促進要因・課題・機会・抑制要因
- 市場促進要因
- 市場の課題
- 促進要因と課題の影響
- 市場の機会・抑制要因
第14章 競合情勢
- 概要
- 競合情勢
- 混乱の状況
- 業界のリスク
第15章 競合分析
- 企業プロファイル
- 企業ランキング指数
- 企業の市場ポジショニング
- Alibaba Group Holding Ltd.
- Asbury Automotive Group Inc.
- AutoNation Inc.
- Berman Auto Group
- CarMax Inc.
- DriveTime Automotive Group Inc.
- eBay Inc.
- Group 1 Automotive Inc.
- Hendrick Automotive Group
- Hertz Global Holdings Inc.
- Lithia Motors Inc.
- Penske Corp.
- Scout24 AG
- Sonic Automotive Inc.
- Toyota Motor Corp.
第16章 付録
Exhibits:
- Exhibits1: Executive Summary - Chart on Market Overview
- Exhibits2: Executive Summary - Data Table on Market Overview
- Exhibits3: Executive Summary - Chart on Global Market Characteristics
- Exhibits4: Executive Summary - Chart on Market By Geographical Landscape
- Exhibits5: Executive Summary - Chart on Market Segmentation by Vehicle Type
- Exhibits6: Executive Summary - Chart on Market Segmentation by Channel
- Exhibits7: Executive Summary - Chart on Market Segmentation by Fuel Type
- Exhibits8: Executive Summary - Chart on Incremental Growth
- Exhibits9: Executive Summary - Data Table on Incremental Growth
- Exhibits10: Executive Summary - Chart on Company Market Positioning
- Exhibits11: Analysis of price sensitivity, lifecycle, customer purchase basket, adoption rates, and purchase criteria
- Exhibits12: Overview on criticality of inputs and factors of differentiation
- Exhibits13: Overview on factors of disruption
- Exhibits14: Impact of drivers and challenges in 2024 and 2029
- Exhibits15: Parent Market
- Exhibits16: Data Table on - Parent Market
- Exhibits17: Market characteristics analysis
- Exhibits18: Value chain analysis
- Exhibits19: Offerings of companies included in the market definition
- Exhibits20: Market segments
- Exhibits21: Chart on Global - Market size and forecast 2024-2029 ($ billion)
- Exhibits22: Data Table on Global - Market size and forecast 2024-2029 ($ billion)
- Exhibits23: Chart on Global Market: Year-over-year growth 2024-2029 (%)
- Exhibits24: Data Table on Global Market: Year-over-year growth 2024-2029 (%)
- Exhibits25: Historic Market Size - Data Table on Global Used Car Market 2019 - 2023 ($ billion)
- Exhibits26: Historic Market Size - Vehicle Type Segment 2019 - 2023 ($ billion)
- Exhibits27: Historic Market Size - Channel Segment 2019 - 2023 ($ billion)
- Exhibits28: Historic Market Size - Fuel Type Segment 2019 - 2023 ($ billion)
- Exhibits29: Historic Market Size - Geography Segment 2019 - 2023 ($ billion)
- Exhibits30: Historic Market Size - Country Segment 2019 - 2023 ($ billion)
- Exhibits31: Five forces analysis - Comparison between 2024 and 2029
- Exhibits32: Bargaining power of buyers - Impact of key factors 2024 and 2029
- Exhibits33: Bargaining power of suppliers - Impact of key factors in 2024 and 2029
- Exhibits34: Threat of new entrants - Impact of key factors in 2024 and 2029
- Exhibits35: Threat of substitutes - Impact of key factors in 2024 and 2029
- Exhibits36: Threat of rivalry - Impact of key factors in 2024 and 2029
- Exhibits37: Chart on Market condition - Five forces 2024 and 2029
- Exhibits38: Chart on Vehicle Type - Market share 2024-2029 (%)
- Exhibits39: Data Table on Vehicle Type - Market share 2024-2029 (%)
- Exhibits40: Chart on Comparison by Vehicle Type
- Exhibits41: Data Table on Comparison by Vehicle Type
- Exhibits42: Chart on Compact - Market size and forecast 2024-2029 ($ billion)
- Exhibits43: Data Table on Compact - Market size and forecast 2024-2029 ($ billion)
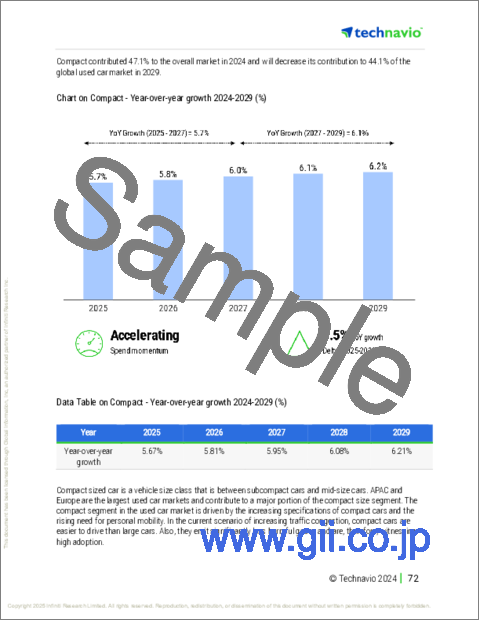
- Exhibits44: Chart on Compact - Year-over-year growth 2024-2029 (%)
- Exhibits45: Data Table on Compact - Year-over-year growth 2024-2029 (%)
- Exhibits46: Chart on SUV - Market size and forecast 2024-2029 ($ billion)
- Exhibits47: Data Table on SUV - Market size and forecast 2024-2029 ($ billion)
- Exhibits48: Chart on SUV - Year-over-year growth 2024-2029 (%)
- Exhibits49: Data Table on SUV - Year-over-year growth 2024-2029 (%)
- Exhibits50: Chart on Mid size - Market size and forecast 2024-2029 ($ billion)
- Exhibits51: Data Table on Mid size - Market size and forecast 2024-2029 ($ billion)
- Exhibits52: Chart on Mid size - Year-over-year growth 2024-2029 (%)
- Exhibits53: Data Table on Mid size - Year-over-year growth 2024-2029 (%)
- Exhibits54: Market opportunity by Vehicle Type ($ billion)
- Exhibits55: Data Table on Market opportunity by Vehicle Type ($ billion)
- Exhibits56: Chart on Channel - Market share 2024-2029 (%)
- Exhibits57: Data Table on Channel - Market share 2024-2029 (%)
- Exhibits58: Chart on Comparison by Channel
- Exhibits59: Data Table on Comparison by Channel
- Exhibits60: Chart on Organized - Market size and forecast 2024-2029 ($ billion)
- Exhibits61: Data Table on Organized - Market size and forecast 2024-2029 ($ billion)
- Exhibits62: Chart on Organized - Year-over-year growth 2024-2029 (%)
- Exhibits63: Data Table on Organized - Year-over-year growth 2024-2029 (%)
- Exhibits64: Chart on Unorganized - Market size and forecast 2024-2029 ($ billion)
- Exhibits65: Data Table on Unorganized - Market size and forecast 2024-2029 ($ billion)
- Exhibits66: Chart on Unorganized - Year-over-year growth 2024-2029 (%)
- Exhibits67: Data Table on Unorganized - Year-over-year growth 2024-2029 (%)
- Exhibits68: Market opportunity by Channel ($ billion)
- Exhibits69: Data Table on Market opportunity by Channel ($ billion)
- Exhibits70: Chart on Fuel Type - Market share 2024-2029 (%)
- Exhibits71: Data Table on Fuel Type - Market share 2024-2029 (%)
- Exhibits72: Chart on Comparison by Fuel Type
- Exhibits73: Data Table on Comparison by Fuel Type
- Exhibits74: Chart on Diesel - Market size and forecast 2024-2029 ($ billion)
- Exhibits75: Data Table on Diesel - Market size and forecast 2024-2029 ($ billion)
- Exhibits76: Chart on Diesel - Year-over-year growth 2024-2029 (%)
- Exhibits77: Data Table on Diesel - Year-over-year growth 2024-2029 (%)
- Exhibits78: Chart on Petrol - Market size and forecast 2024-2029 ($ billion)
- Exhibits79: Data Table on Petrol - Market size and forecast 2024-2029 ($ billion)
- Exhibits80: Chart on Petrol - Year-over-year growth 2024-2029 (%)
- Exhibits81: Data Table on Petrol - Year-over-year growth 2024-2029 (%)
- Exhibits82: Market opportunity by Fuel Type ($ billion)
- Exhibits83: Data Table on Market opportunity by Fuel Type ($ billion)
- Exhibits84: Analysis of price sensitivity, lifecycle, customer purchase basket, adoption rates, and purchase criteria
- Exhibits85: Chart on Market share By Geographical Landscape 2024-2029 (%)
- Exhibits86: Data Table on Market share By Geographical Landscape 2024-2029 (%)
- Exhibits87: Chart on Geographic comparison
- Exhibits88: Data Table on Geographic comparison
- Exhibits89: Chart on APAC - Market size and forecast 2024-2029 ($ billion)
- Exhibits90: Data Table on APAC - Market size and forecast 2024-2029 ($ billion)
- Exhibits91: Chart on APAC - Year-over-year growth 2024-2029 (%)
- Exhibits92: Data Table on APAC - Year-over-year growth 2024-2029 (%)
- Exhibits93: Chart on North America - Market size and forecast 2024-2029 ($ billion)
- Exhibits94: Data Table on North America - Market size and forecast 2024-2029 ($ billion)
- Exhibits95: Chart on North America - Year-over-year growth 2024-2029 (%)
- Exhibits96: Data Table on North America - Year-over-year growth 2024-2029 (%)
- Exhibits97: Chart on Europe - Market size and forecast 2024-2029 ($ billion)
- Exhibits98: Data Table on Europe - Market size and forecast 2024-2029 ($ billion)
- Exhibits99: Chart on Europe - Year-over-year growth 2024-2029 (%)
- Exhibits100: Data Table on Europe - Year-over-year growth 2024-2029 (%)
- Exhibits101: Chart on Middle East and Africa - Market size and forecast 2024-2029 ($ billion)
- Exhibits102: Data Table on Middle East and Africa - Market size and forecast 2024-2029 ($ billion)
- Exhibits103: Chart on Middle East and Africa - Year-over-year growth 2024-2029 (%)
- Exhibits104: Data Table on Middle East and Africa - Year-over-year growth 2024-2029 (%)
- Exhibits105: Chart on South America - Market size and forecast 2024-2029 ($ billion)
- Exhibits106: Data Table on South America - Market size and forecast 2024-2029 ($ billion)
- Exhibits107: Chart on South America - Year-over-year growth 2024-2029 (%)
- Exhibits108: Data Table on South America - Year-over-year growth 2024-2029 (%)
- Exhibits109: Chart on US - Market size and forecast 2024-2029 ($ billion)
- Exhibits110: Data Table on US - Market size and forecast 2024-2029 ($ billion)
- Exhibits111: Chart on US - Year-over-year growth 2024-2029 (%)
- Exhibits112: Data Table on US - Year-over-year growth 2024-2029 (%)
- Exhibits113: Chart on China - Market size and forecast 2024-2029 ($ billion)
- Exhibits114: Data Table on China - Market size and forecast 2024-2029 ($ billion)
- Exhibits115: Chart on China - Year-over-year growth 2024-2029 (%)
- Exhibits116: Data Table on China - Year-over-year growth 2024-2029 (%)
- Exhibits117: Chart on Japan - Market size and forecast 2024-2029 ($ billion)
- Exhibits118: Data Table on Japan - Market size and forecast 2024-2029 ($ billion)
- Exhibits119: Chart on Japan - Year-over-year growth 2024-2029 (%)
- Exhibits120: Data Table on Japan - Year-over-year growth 2024-2029 (%)
- Exhibits121: Chart on India - Market size and forecast 2024-2029 ($ billion)
- Exhibits122: Data Table on India - Market size and forecast 2024-2029 ($ billion)
- Exhibits123: Chart on India - Year-over-year growth 2024-2029 (%)
- Exhibits124: Data Table on India - Year-over-year growth 2024-2029 (%)
- Exhibits125: Chart on Germany - Market size and forecast 2024-2029 ($ billion)
- Exhibits126: Data Table on Germany - Market size and forecast 2024-2029 ($ billion)
- Exhibits127: Chart on Germany - Year-over-year growth 2024-2029 (%)
- Exhibits128: Data Table on Germany - Year-over-year growth 2024-2029 (%)
- Exhibits129: Chart on Canada - Market size and forecast 2024-2029 ($ billion)
- Exhibits130: Data Table on Canada - Market size and forecast 2024-2029 ($ billion)
- Exhibits131: Chart on Canada - Year-over-year growth 2024-2029 (%)
- Exhibits132: Data Table on Canada - Year-over-year growth 2024-2029 (%)
- Exhibits133: Chart on UK - Market size and forecast 2024-2029 ($ billion)
- Exhibits134: Data Table on UK - Market size and forecast 2024-2029 ($ billion)
- Exhibits135: Chart on UK - Year-over-year growth 2024-2029 (%)
- Exhibits136: Data Table on UK - Year-over-year growth 2024-2029 (%)
- Exhibits137: Chart on South Korea - Market size and forecast 2024-2029 ($ billion)
- Exhibits138: Data Table on South Korea - Market size and forecast 2024-2029 ($ billion)
- Exhibits139: Chart on South Korea - Year-over-year growth 2024-2029 (%)
- Exhibits140: Data Table on South Korea - Year-over-year growth 2024-2029 (%)
- Exhibits141: Chart on France - Market size and forecast 2024-2029 ($ billion)
- Exhibits142: Data Table on France - Market size and forecast 2024-2029 ($ billion)
- Exhibits143: Chart on France - Year-over-year growth 2024-2029 (%)
- Exhibits144: Data Table on France - Year-over-year growth 2024-2029 (%)
- Exhibits145: Chart on Brazil - Market size and forecast 2024-2029 ($ billion)
- Exhibits146: Data Table on Brazil - Market size and forecast 2024-2029 ($ billion)
- Exhibits147: Chart on Brazil - Year-over-year growth 2024-2029 (%)
- Exhibits148: Data Table on Brazil - Year-over-year growth 2024-2029 (%)
- Exhibits149: Market opportunity By Geographical Landscape ($ billion)
- Exhibits150: Data Tables on Market opportunity By Geographical Landscape ($ billion)
- Exhibits151: Impact of drivers and challenges in 2024 and 2029
- Exhibits152: Overview on criticality of inputs and factors of differentiation
- Exhibits153: Overview on factors of disruption
- Exhibits154: Impact of key risks on business
- Exhibits155: Companies covered
- Exhibits156: Company ranking index
- Exhibits157: Matrix on companies position and classification
- Exhibits158: Alibaba Group Holding Ltd. - Overview
- Exhibits159: Alibaba Group Holding Ltd. - Business segments
- Exhibits160: Alibaba Group Holding Ltd. - Key news
- Exhibits161: Alibaba Group Holding Ltd. - Key offerings
- Exhibits162: Alibaba Group Holding Ltd. - Segment focus
- Exhibits163: SWOT
- Exhibits164: Asbury Automotive Group Inc. - Overview
- Exhibits165: Asbury Automotive Group Inc. - Business segments
- Exhibits166: Asbury Automotive Group Inc. - Key offerings
- Exhibits167: Asbury Automotive Group Inc. - Segment focus
- Exhibits168: SWOT
- Exhibits169: AutoNation Inc. - Overview
- Exhibits170: AutoNation Inc. - Business segments
- Exhibits171: AutoNation Inc. - Key offerings
- Exhibits172: AutoNation Inc. - Segment focus
- Exhibits173: SWOT
- Exhibits174: Berman Auto Group - Overview
- Exhibits175: Berman Auto Group - Product / Service
- Exhibits176: Berman Auto Group - Key offerings
- Exhibits177: SWOT
- Exhibits178: CarMax Inc. - Overview
- Exhibits179: CarMax Inc. - Business segments
- Exhibits180: CarMax Inc. - Key offerings
- Exhibits181: CarMax Inc. - Segment focus
- Exhibits182: SWOT
- Exhibits183: DriveTime Automotive Group Inc. - Overview
- Exhibits184: DriveTime Automotive Group Inc. - Product / Service
- Exhibits185: DriveTime Automotive Group Inc. - Key offerings
- Exhibits186: SWOT
- Exhibits187: eBay Inc. - Overview
- Exhibits188: eBay Inc. - Product / Service
- Exhibits189: eBay Inc. - Key offerings
- Exhibits190: SWOT
- Exhibits191: Group 1 Automotive Inc. - Overview
- Exhibits192: Group 1 Automotive Inc. - Business segments
- Exhibits193: Group 1 Automotive Inc. - Key offerings
- Exhibits194: Group 1 Automotive Inc. - Segment focus
- Exhibits195: SWOT
- Exhibits196: Hendrick Automotive Group - Overview
- Exhibits197: Hendrick Automotive Group - Product / Service
- Exhibits198: Hendrick Automotive Group - Key offerings
- Exhibits199: SWOT
- Exhibits200: Hertz Global Holdings Inc. - Overview
- Exhibits201: Hertz Global Holdings Inc. - Business segments
- Exhibits202: Hertz Global Holdings Inc. - Key news
- Exhibits203: Hertz Global Holdings Inc. - Key offerings
- Exhibits204: Hertz Global Holdings Inc. - Segment focus
- Exhibits205: SWOT
- Exhibits206: Lithia Motors Inc. - Overview
- Exhibits207: Lithia Motors Inc. - Business segments
- Exhibits208: Lithia Motors Inc. - Key offerings
- Exhibits209: Lithia Motors Inc. - Segment focus
- Exhibits210: SWOT
- Exhibits211: Penske Corp. - Overview
- Exhibits212: Penske Corp. - Product / Service
- Exhibits213: Penske Corp. - Key offerings
- Exhibits214: SWOT
- Exhibits215: Scout24 AG - Overview
- Exhibits216: Scout24 AG - Business segments
- Exhibits217: Scout24 AG - Key offerings
- Exhibits218: Scout24 AG - Segment focus
- Exhibits219: SWOT
- Exhibits220: Sonic Automotive Inc. - Overview
- Exhibits221: Sonic Automotive Inc. - Business segments
- Exhibits222: Sonic Automotive Inc. - Key offerings
- Exhibits223: Sonic Automotive Inc. - Segment focus
- Exhibits224: SWOT
- Exhibits225: Toyota Motor Corp. - Overview
- Exhibits226: Toyota Motor Corp. - Business segments
- Exhibits227: Toyota Motor Corp. - Key news
- Exhibits228: Toyota Motor Corp. - Key offerings
- Exhibits229: Toyota Motor Corp. - Segment focus
- Exhibits230: SWOT
- Exhibits231: Inclusions checklist
- Exhibits232: Exclusions checklist
- Exhibits233: Currency conversion rates for US$
- Exhibits234: Research methodology
- Exhibits235: Information sources
- Exhibits236: Data validation
- Exhibits237: Validation techniques employed for market sizing
- Exhibits238: Data synthesis
- Exhibits239: 360 degree market analysis
- Exhibits240: List of abbreviations
The used car market is forecasted to grow by USD 885.3 bn during 2024-2029, accelerating at a CAGR of 7.4% during the forecast period. The report on the used car market provides a holistic analysis, market size and forecast, trends, growth drivers, and challenges, as well as vendor analysis covering around 25 vendors.
The report offers an up-to-date analysis regarding the current market scenario, the latest trends and drivers, and the overall market environment. The market is driven by increasing number of new models of cars launched due to high competition, declining ownership cycle of vehicles among urban consumers in emerging countries, and excellent value for money proposition of used cars.
| Market Scope | |
|---|---|
| Base Year | 2025 |
| End Year | 2029 |
| Series Year | 2025-2029 |
| Growth Momentum | Accelerate |
| YOY 2025 | 6.8% |
| CAGR | 7.4% |
| Incremental Value | $885.3 bn |
The study was conducted using an objective combination of primary and secondary information including inputs from key participants in the industry. The report contains a comprehensive market size data, segment with regional analysis and vendor landscape in addition to an analysis of the key companies. Reports have historic and forecast data.
Technavio's used car market is segmented as below:
By Vehicle Type
- Compact
- SUV
- Mid size
By Channel
- Organized
- Unorganized
By Fuel Type
- Diesel
- Petrol
By Geographical Landscape
- APAC
- North America
- Europe
- Middle East and Africa
- South America
This study identifies the growing demand for car subscription services as one of the prime reasons driving the used car market growth during the next few years. Also, vending machine platform for dispensing used cars and oems shifting to online portals for used cars will lead to sizable demand in the market.
The report on the used car market covers the following areas:
- Used Car Market sizing
- Used Car Market forecast
- Used Car Market industry analysis
The robust vendor analysis is designed to help clients improve their market position, and in line with this, this report provides a detailed analysis of several leading used car market vendors that include Alibaba Group Holding Ltd., Asbury Automotive Group Inc., AutoNation Inc., Autotrader.com Inc., Berman Auto Group, CarGurus Inc., CarMax Inc., Cars24 Services Pvt. Ltd., DriveTime Automotive Group Inc., eBay Inc., Group 1 Automotive Inc., Hendrick Automotive Group, Hertz Global Holdings Inc., Lithia Motors Inc., Mahindra and Mahindra Ltd., Penske Corp., Scout24 AG, Sonic Automotive Inc., Toyota Motor Corp., and TrueCar Inc.. Also, the used car market analysis report includes information on upcoming trends and challenges that will influence market growth. This is to help companies strategize and leverage all forthcoming growth opportunities.
The publisher presents a detailed picture of the market by the way of study, synthesis, and summation of data from multiple sources by an analysis of key parameters such as profit, pricing, competition, and promotions. It presents various market facets by identifying the key industry influencers. The data presented is comprehensive, reliable, and a result of extensive primary and secondary research. The market research reports provide a complete competitive landscape and an in-depth vendor selection methodology and analysis using qualitative and quantitative research to forecast accurate market growth.
Table of Contents
1 Executive Summary
- 1.1 Market overview
- Executive Summary - Chart on Market Overview
- Executive Summary - Data Table on Market Overview
- Executive Summary - Chart on Global Market Characteristics
- Executive Summary - Chart on Market By Geographical Landscape
- Executive Summary - Chart on Market Segmentation by Vehicle Type
- Executive Summary - Chart on Market Segmentation by Channel
- Executive Summary - Chart on Market Segmentation by Fuel Type
- Executive Summary - Chart on Incremental Growth
- Executive Summary - Data Table on Incremental Growth
- Executive Summary - Chart on Company Market Positioning
2 Technavio Analysis
- 2.1 Analysis of price sensitivity, lifecycle, customer purchase basket, adoption rates, and purchase criteria
- Analysis of price sensitivity, lifecycle, customer purchase basket, adoption rates, and purchase criteria
- 2.2 Criticality of inputs and Factors of differentiation
- Overview on criticality of inputs and factors of differentiation
- 2.3 Factors of disruption
- Overview on factors of disruption
- 2.4 Impact of drivers and challenges
- Impact of drivers and challenges in 2024 and 2029
3 Market Landscape
- 3.1 Market ecosystem
- Parent Market
- Data Table on - Parent Market
- 3.2 Market characteristics
- Market characteristics analysis
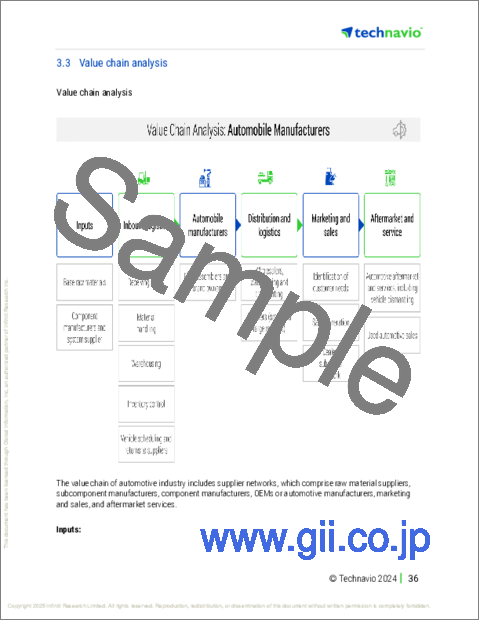
- 3.3 Value chain analysis
- Value chain analysis
4 Market Sizing
- 4.1 Market definition
- Offerings of companies included in the market definition
- 4.2 Market segment analysis
- Market segments
- 4.3 Market size 2024
- 4.4 Market outlook: Forecast for 2024-2029
- Chart on Global - Market size and forecast 2024-2029 ($ billion)
- Data Table on Global - Market size and forecast 2024-2029 ($ billion)
- Chart on Global Market: Year-over-year growth 2024-2029 (%)
- Data Table on Global Market: Year-over-year growth 2024-2029 (%)
5 Historic Market Size
- 5.1 Global Used Car Market 2019 - 2023
- Historic Market Size - Data Table on Global Used Car Market 2019 - 2023 ($ billion)
- 5.2 Vehicle Type segment analysis 2019 - 2023
- Historic Market Size - Vehicle Type Segment 2019 - 2023 ($ billion)
- 5.3 Channel segment analysis 2019 - 2023
- Historic Market Size - Channel Segment 2019 - 2023 ($ billion)
- 5.4 Fuel Type segment analysis 2019 - 2023
- Historic Market Size - Fuel Type Segment 2019 - 2023 ($ billion)
- 5.5 Geography segment analysis 2019 - 2023
- Historic Market Size - Geography Segment 2019 - 2023 ($ billion)
- 5.6 Country segment analysis 2019 - 2023
- Historic Market Size - Country Segment 2019 - 2023 ($ billion)
6 Qualitative Analysis
- 6.1 Impact of AI in the Global Used Car Market
7 Five Forces Analysis
- 7.1 Five forces summary
- Five forces analysis - Comparison between 2024 and 2029
- 7.2 Bargaining power of buyers
- Bargaining power of buyers - Impact of key factors 2024 and 2029
- 7.3 Bargaining power of suppliers
- Bargaining power of suppliers - Impact of key factors in 2024 and 2029
- 7.4 Threat of new entrants
- Threat of new entrants - Impact of key factors in 2024 and 2029
- 7.5 Threat of substitutes
- Threat of substitutes - Impact of key factors in 2024 and 2029
- 7.6 Threat of rivalry
- Threat of rivalry - Impact of key factors in 2024 and 2029
- 7.7 Market condition
- Chart on Market condition - Five forces 2024 and 2029
8 Market Segmentation by Vehicle Type
- 8.1 Market segments
- Chart on Vehicle Type - Market share 2024-2029 (%)
- Data Table on Vehicle Type - Market share 2024-2029 (%)
- 8.2 Comparison by Vehicle Type
- Chart on Comparison by Vehicle Type
- Data Table on Comparison by Vehicle Type
- 8.3 Compact - Market size and forecast 2024-2029
- Chart on Compact - Market size and forecast 2024-2029 ($ billion)
- Data Table on Compact - Market size and forecast 2024-2029 ($ billion)
- Chart on Compact - Year-over-year growth 2024-2029 (%)
- Data Table on Compact - Year-over-year growth 2024-2029 (%)
- 8.4 SUV - Market size and forecast 2024-2029
- Chart on SUV - Market size and forecast 2024-2029 ($ billion)
- Data Table on SUV - Market size and forecast 2024-2029 ($ billion)
- Chart on SUV - Year-over-year growth 2024-2029 (%)
- Data Table on SUV - Year-over-year growth 2024-2029 (%)
- 8.5 Mid size - Market size and forecast 2024-2029
- Chart on Mid size - Market size and forecast 2024-2029 ($ billion)
- Data Table on Mid size - Market size and forecast 2024-2029 ($ billion)
- Chart on Mid size - Year-over-year growth 2024-2029 (%)
- Data Table on Mid size - Year-over-year growth 2024-2029 (%)
- 8.6 Market opportunity by Vehicle Type
- Market opportunity by Vehicle Type ($ billion)
- Data Table on Market opportunity by Vehicle Type ($ billion)
9 Market Segmentation by Channel
- 9.1 Market segments
- Chart on Channel - Market share 2024-2029 (%)
- Data Table on Channel - Market share 2024-2029 (%)
- 9.2 Comparison by Channel
- Chart on Comparison by Channel
- Data Table on Comparison by Channel
- 9.3 Organized - Market size and forecast 2024-2029
- Chart on Organized - Market size and forecast 2024-2029 ($ billion)
- Data Table on Organized - Market size and forecast 2024-2029 ($ billion)
- Chart on Organized - Year-over-year growth 2024-2029 (%)
- Data Table on Organized - Year-over-year growth 2024-2029 (%)
- 9.4 Unorganized - Market size and forecast 2024-2029
- Chart on Unorganized - Market size and forecast 2024-2029 ($ billion)
- Data Table on Unorganized - Market size and forecast 2024-2029 ($ billion)
- Chart on Unorganized - Year-over-year growth 2024-2029 (%)
- Data Table on Unorganized - Year-over-year growth 2024-2029 (%)
- 9.5 Market opportunity by Channel
- Market opportunity by Channel ($ billion)
- Data Table on Market opportunity by Channel ($ billion)
10 Market Segmentation by Fuel Type
- 10.1 Market segments
- Chart on Fuel Type - Market share 2024-2029 (%)
- Data Table on Fuel Type - Market share 2024-2029 (%)
- 10.2 Comparison by Fuel Type
- Chart on Comparison by Fuel Type
- Data Table on Comparison by Fuel Type
- 10.3 Diesel - Market size and forecast 2024-2029
- Chart on Diesel - Market size and forecast 2024-2029 ($ billion)
- Data Table on Diesel - Market size and forecast 2024-2029 ($ billion)
- Chart on Diesel - Year-over-year growth 2024-2029 (%)
- Data Table on Diesel - Year-over-year growth 2024-2029 (%)
- 10.4 Petrol - Market size and forecast 2024-2029
- Chart on Petrol - Market size and forecast 2024-2029 ($ billion)
- Data Table on Petrol - Market size and forecast 2024-2029 ($ billion)
- Chart on Petrol - Year-over-year growth 2024-2029 (%)
- Data Table on Petrol - Year-over-year growth 2024-2029 (%)
- 10.5 Market opportunity by Fuel Type
- Market opportunity by Fuel Type ($ billion)
- Data Table on Market opportunity by Fuel Type ($ billion)
11 Customer Landscape
- 11.1 Customer landscape overview
- Analysis of price sensitivity, lifecycle, customer purchase basket, adoption rates, and purchase criteria
12 Geographic Landscape
- 12.1 Geographic segmentation
- Chart on Market share By Geographical Landscape 2024-2029 (%)
- Data Table on Market share By Geographical Landscape 2024-2029 (%)
- 12.2 Geographic comparison
- Chart on Geographic comparison
- Data Table on Geographic comparison
- 12.3 APAC - Market size and forecast 2024-2029
- Chart on APAC - Market size and forecast 2024-2029 ($ billion)
- Data Table on APAC - Market size and forecast 2024-2029 ($ billion)
- Chart on APAC - Year-over-year growth 2024-2029 (%)
- Data Table on APAC - Year-over-year growth 2024-2029 (%)
- 12.4 North America - Market size and forecast 2024-2029
- Chart on North America - Market size and forecast 2024-2029 ($ billion)
- Data Table on North America - Market size and forecast 2024-2029 ($ billion)
- Chart on North America - Year-over-year growth 2024-2029 (%)
- Data Table on North America - Year-over-year growth 2024-2029 (%)
- 12.5 Europe - Market size and forecast 2024-2029
- Chart on Europe - Market size and forecast 2024-2029 ($ billion)
- Data Table on Europe - Market size and forecast 2024-2029 ($ billion)
- Chart on Europe - Year-over-year growth 2024-2029 (%)
- Data Table on Europe - Year-over-year growth 2024-2029 (%)
- 12.6 Middle East and Africa - Market size and forecast 2024-2029
- Chart on Middle East and Africa - Market size and forecast 2024-2029 ($ billion)
- Data Table on Middle East and Africa - Market size and forecast 2024-2029 ($ billion)
- Chart on Middle East and Africa - Year-over-year growth 2024-2029 (%)
- Data Table on Middle East and Africa - Year-over-year growth 2024-2029 (%)
- 12.7 South America - Market size and forecast 2024-2029
- Chart on South America - Market size and forecast 2024-2029 ($ billion)
- Data Table on South America - Market size and forecast 2024-2029 ($ billion)
- Chart on South America - Year-over-year growth 2024-2029 (%)
- Data Table on South America - Year-over-year growth 2024-2029 (%)
- 12.8 US - Market size and forecast 2024-2029
- Chart on US - Market size and forecast 2024-2029 ($ billion)
- Data Table on US - Market size and forecast 2024-2029 ($ billion)
- Chart on US - Year-over-year growth 2024-2029 (%)
- Data Table on US - Year-over-year growth 2024-2029 (%)
- 12.9 China - Market size and forecast 2024-2029
- Chart on China - Market size and forecast 2024-2029 ($ billion)
- Data Table on China - Market size and forecast 2024-2029 ($ billion)
- Chart on China - Year-over-year growth 2024-2029 (%)
- Data Table on China - Year-over-year growth 2024-2029 (%)
- 12.10 Japan - Market size and forecast 2024-2029
- Chart on Japan - Market size and forecast 2024-2029 ($ billion)
- Data Table on Japan - Market size and forecast 2024-2029 ($ billion)
- Chart on Japan - Year-over-year growth 2024-2029 (%)
- Data Table on Japan - Year-over-year growth 2024-2029 (%)
- 12.11 India - Market size and forecast 2024-2029
- Chart on India - Market size and forecast 2024-2029 ($ billion)
- Data Table on India - Market size and forecast 2024-2029 ($ billion)
- Chart on India - Year-over-year growth 2024-2029 (%)
- Data Table on India - Year-over-year growth 2024-2029 (%)
- 12.12 Germany - Market size and forecast 2024-2029
- Chart on Germany - Market size and forecast 2024-2029 ($ billion)
- Data Table on Germany - Market size and forecast 2024-2029 ($ billion)
- Chart on Germany - Year-over-year growth 2024-2029 (%)
- Data Table on Germany - Year-over-year growth 2024-2029 (%)
- 12.13 Canada - Market size and forecast 2024-2029
- Chart on Canada - Market size and forecast 2024-2029 ($ billion)
- Data Table on Canada - Market size and forecast 2024-2029 ($ billion)
- Chart on Canada - Year-over-year growth 2024-2029 (%)
- Data Table on Canada - Year-over-year growth 2024-2029 (%)
- 12.14 UK - Market size and forecast 2024-2029
- Chart on UK - Market size and forecast 2024-2029 ($ billion)
- Data Table on UK - Market size and forecast 2024-2029 ($ billion)
- Chart on UK - Year-over-year growth 2024-2029 (%)
- Data Table on UK - Year-over-year growth 2024-2029 (%)
- 12.15 South Korea - Market size and forecast 2024-2029
- Chart on South Korea - Market size and forecast 2024-2029 ($ billion)
- Data Table on South Korea - Market size and forecast 2024-2029 ($ billion)
- Chart on South Korea - Year-over-year growth 2024-2029 (%)
- Data Table on South Korea - Year-over-year growth 2024-2029 (%)
- 12.16 France - Market size and forecast 2024-2029
- Chart on France - Market size and forecast 2024-2029 ($ billion)
- Data Table on France - Market size and forecast 2024-2029 ($ billion)
- Chart on France - Year-over-year growth 2024-2029 (%)
- Data Table on France - Year-over-year growth 2024-2029 (%)
- 12.17 Brazil - Market size and forecast 2024-2029
- Chart on Brazil - Market size and forecast 2024-2029 ($ billion)
- Data Table on Brazil - Market size and forecast 2024-2029 ($ billion)
- Chart on Brazil - Year-over-year growth 2024-2029 (%)
- Data Table on Brazil - Year-over-year growth 2024-2029 (%)
- 12.18 Market opportunity By Geographical Landscape
- Market opportunity By Geographical Landscape ($ billion)
- Data Tables on Market opportunity By Geographical Landscape ($ billion)
13 Drivers, Challenges, and Opportunity/Restraints
- 13.1 Market drivers
- 13.2 Market challenges
- 13.3 Impact of drivers and challenges
- Impact of drivers and challenges in 2024 and 2029
- 13.4 Market opportunities/restraints
14 Competitive Landscape
- 14.1 Overview
- 14.2 Competitive Landscape
- Overview on criticality of inputs and factors of differentiation
- 14.3 Landscape disruption
- Overview on factors of disruption
- 14.4 Industry risks
- Impact of key risks on business
15 Competitive Analysis
- 15.1 Companies profiled
- Companies covered
- 15.2 Company ranking index
- Company ranking index
- 15.3 Market positioning of companies
- Matrix on companies position and classification
- 15.4 Alibaba Group Holding Ltd.
- Alibaba Group Holding Ltd. - Overview
- Alibaba Group Holding Ltd. - Business segments
- Alibaba Group Holding Ltd. - Key news
- Alibaba Group Holding Ltd. - Key offerings
- Alibaba Group Holding Ltd. - Segment focus
- SWOT
- 15.5 Asbury Automotive Group Inc.
- Asbury Automotive Group Inc. - Overview
- Asbury Automotive Group Inc. - Business segments
- Asbury Automotive Group Inc. - Key offerings
- Asbury Automotive Group Inc. - Segment focus
- SWOT
- 15.6 AutoNation Inc.
- AutoNation Inc. - Overview
- AutoNation Inc. - Business segments
- AutoNation Inc. - Key offerings
- AutoNation Inc. - Segment focus
- SWOT
- 15.7 Berman Auto Group
- Berman Auto Group - Overview
- Berman Auto Group - Product / Service
- Berman Auto Group - Key offerings
- SWOT
- 15.8 CarMax Inc.
- CarMax Inc. - Overview
- CarMax Inc. - Business segments
- CarMax Inc. - Key offerings
- CarMax Inc. - Segment focus
- SWOT
- 15.9 DriveTime Automotive Group Inc.
- DriveTime Automotive Group Inc. - Overview
- DriveTime Automotive Group Inc. - Product / Service
- DriveTime Automotive Group Inc. - Key offerings
- SWOT
- 15.10 eBay Inc.
- eBay Inc. - Overview
- eBay Inc. - Product / Service
- eBay Inc. - Key offerings
- SWOT
- 15.11 Group 1 Automotive Inc.
- Group 1 Automotive Inc. - Overview
- Group 1 Automotive Inc. - Business segments
- Group 1 Automotive Inc. - Key offerings
- Group 1 Automotive Inc. - Segment focus
- SWOT
- 15.12 Hendrick Automotive Group
- Hendrick Automotive Group - Overview
- Hendrick Automotive Group - Product / Service
- Hendrick Automotive Group - Key offerings
- SWOT
- 15.13 Hertz Global Holdings Inc.
- Hertz Global Holdings Inc. - Overview
- Hertz Global Holdings Inc. - Business segments
- Hertz Global Holdings Inc. - Key news
- Hertz Global Holdings Inc. - Key offerings
- Hertz Global Holdings Inc. - Segment focus
- SWOT
- 15.14 Lithia Motors Inc.
- Lithia Motors Inc. - Overview
- Lithia Motors Inc. - Business segments
- Lithia Motors Inc. - Key offerings
- Lithia Motors Inc. - Segment focus
- SWOT
- 15.15 Penske Corp.
- Penske Corp. - Overview
- Penske Corp. - Product / Service
- Penske Corp. - Key offerings
- SWOT
- 15.16 Scout24 AG
- Scout24 AG - Overview
- Scout24 AG - Business segments
- Scout24 AG - Key offerings
- Scout24 AG - Segment focus
- SWOT
- 15.17 Sonic Automotive Inc.
- Sonic Automotive Inc. - Overview
- Sonic Automotive Inc. - Business segments
- Sonic Automotive Inc. - Key offerings
- Sonic Automotive Inc. - Segment focus
- SWOT
- 15.18 Toyota Motor Corp.
- Toyota Motor Corp. - Overview
- Toyota Motor Corp. - Business segments
- Toyota Motor Corp. - Key news
- Toyota Motor Corp. - Key offerings
- Toyota Motor Corp. - Segment focus
- SWOT
16 Appendix
- 16.1 Scope of the report
- 16.2 Inclusions and exclusions checklist
- Inclusions checklist
- Exclusions checklist
- 16.3 Currency conversion rates for US$
- Currency conversion rates for US$
- 16.4 Research methodology
- Research methodology
- 16.5 Data procurement
- Information sources
- 16.6 Data validation
- Data validation
- 16.7 Validation techniques employed for market sizing
- Validation techniques employed for market sizing
- 16.8 Data synthesis
- Data synthesis
- 16.9 360 degree market analysis
- 360 degree market analysis
- 16.10 List of abbreviations
- List of abbreviations

