|
|
市場調査レポート
商品コード
1581950
砂糖菓子の世界市場 (2024~2028年)Global Sugar Confectionery Market 2024-2028 |
||||||

|
|||||||
カスタマイズ可能
|
|||||||


| 砂糖菓子の世界市場 (2024~2028年) |
|
出版日: 2024年10月16日
発行: TechNavio
ページ情報: 英文 210 Pages
納期: 即納可能
|

全表示
- 概要
- 図表
- 目次
砂糖菓子市場 (2024~2028年)
砂糖菓子市場は2023-2028年に248億米ドル、予測期間中のCAGRは5.5%で成長すると予測されます。当レポートでは、砂糖菓子市場の全体的な分析、市場規模・予測、動向、成長促進要因、課題、約25社のベンダーを網羅したベンダー分析などを掲載しています。
当レポートでは、現在の市場シナリオ、最新動向と促進要因、市場環境全体に関する最新分析を提供しています。この市場は、製品発売の増加、低糖質菓子の需要増加、製品イノベーションの拡大によって牽引されています。
| 市場範囲 | |
|---|---|
| 基準年 | 2024年 |
| 終了年 | 2028年 |
| 予測期間 | 2024~2028年 |
| 成長モメンタム | 加速 |
| 前年比 (2024年) | 4.8% |
| CAGR | 5.5% |
| 増分額 | 248億米ドル |
当レポートでは、今後数年間の砂糖菓子市場の主な成長促進要因として、オンライン小売の台頭を挙げています。また、新興国からの砂糖菓子の需要増加や、ベンダーによる無機戦略の拡大が、市場の大きな需要につながると思われます。
目次
第1章 エグゼクティブサマリー
- 市場概要
第2章 Technavioによる分析
- 価格感応度・ライフサイクル・顧客購入バスケット・採用率・購入基準の分析
- インプットの重要性と差別化の要因
- 混乱の要因
- 促進要因と課題の影響
第3章 市場情勢
- 市場エコシステム
- 市場の特徴
- バリューチェーン分析
第4章 市場規模の評価
- 市場の定義
- 市場セグメント分析
- 市場規模 (2023年)
- 市場の見通し (2023~2028年)
第5章 市場規模実績
- 砂糖菓子の世界市場 (2018~2022年)
- 製品種類別分析 (2018~2022年)
- 流通チャネル別分析 (2018~2022年)
- 地域別分析 (2018~2022年)
- 国別分析 (2018~2022年)
第6章 定性分析
- 世界の砂糖菓子市場に対するAIの影響
第7章 ファイブフォース分析
- ファイブフォースの要約
- 買い手の交渉力
- 供給企業の交渉力
- 新規参入業者の脅威
- 代替品の脅威
- 競争の脅威
- 市況
第8章 市場セグメンテーション:製品種類別
- 市場セグメンテーション
- 比較:製品種類別
- ハードキャンディ:市場規模と予測 (2023~2028年)
- キャラメル・トフィー:市場規模と予測 (2023~2028年)
- ガム・ゼリー:市場規模と予測 (2023~2028年)
- 薬用菓子:市場規模と予測 (2023~2028年)
- その他:市場規模と予測 (2023~2028年)
- 製品種類別の市場機会
第9章 市場セグメンテーション:流通チャネル別
- 市場セグメンテーション
- 比較:流通チャネル別
- オフライン:市場規模と予測 (2023~2028年)
- オンライン:市場規模と予測 (2023~2028年)
- 流通チャネル別の市場機会
第10章 顧客情勢
- 顧客情勢の概要
第11章 地域別情勢
- 地域別セグメンテーション
- 地域別比較
- アジア太平洋:市場規模と予測 (2023~2028年)
- 北米:市場規模と予測 (2023~2028年)
- 欧州:市場規模と予測 (2023~2028年)
- 中東・アフリカ:市場規模と予測 (2023~2028年)
- 南米:市場規模と予測 (2023~2028年)
- 米国:市場規模と予測 (2023~2028年)
- 中国:市場規模と予測 (2023~2028年)
- 日本:市場規模と予測 (2023~2028年)
- ドイツ:市場規模と予測 (2023~2028年)
- インド:市場規模と予測 (2023~2028年)
- メキシコ:市場規模と予測 (2023~2028年)
- 英国:市場規模と予測 (2023~2028年)
- フランス:市場規模と予測 (2023~2028年)
- ブラジル:市場規模と予測 (2023~2028年)
- イタリア:市場規模と予測 (2023~2028年)
- 地域別の市場機会
第12章 促進要因・課題・機会・抑制要因
- 市場促進要因
- 市場の課題
- 促進要因と課題の影響
- 市場の機会・抑制要因
第13章 競合情勢
- 概要
- 競合情勢
- 混乱の状況
- 業界のリスク
第14章 競合分析
- 企業プロファイル
- 企業ランキング指数
- 企業の市場ポジショニング
- Amar Bio-Organics India Pvt. Ltd.
- Barry Callebaut AG
- Dhiman Foods Pvt. Ltd
- Ferrara Candy Co
- Gumlink Confectionery Company AS
- HARIBO GmbH and Co. KG
- Mars Inc.
- Melbas Australia Pty Ltd
- Mondelez International Inc.
- Nestle SA
- Perfetti Van Melle Group BV
- Prayagh Consumer Care P. Ltd.
- Swan Sweets Pvt Ltd.
- The Beechworth Sweet Co.
- The Hershey Co.
第15章 付録
Exhibits:
- Exhibits1: Executive Summary - Chart on Market Overview
- Exhibits2: Executive Summary - Data Table on Market Overview
- Exhibits3: Executive Summary - Chart on Global Market Characteristics
- Exhibits4: Executive Summary - Chart on Market By Geographical Landscape
- Exhibits5: Executive Summary - Chart on Market Segmentation by Product Type
- Exhibits6: Executive Summary - Chart on Market Segmentation by Distribution Channel
- Exhibits7: Executive Summary - Chart on Incremental Growth
- Exhibits8: Executive Summary - Data Table on Incremental Growth
- Exhibits9: Executive Summary - Chart on Company Market Positioning
- Exhibits10: Analysis of price sensitivity, lifecycle, customer purchase basket, adoption rates, and purchase criteria
- Exhibits11: Overview on criticality of inputs and factors of differentiation
- Exhibits12: Overview on factors of disruption
- Exhibits13: Impact of drivers and challenges in 2023 and 2028
- Exhibits14: Parent Market
- Exhibits15: Data Table on - Parent Market
- Exhibits16: Market characteristics analysis
- Exhibits17: Value Chain Analysis
- Exhibits18: Offerings of companies included in the market definition
- Exhibits19: Market segments
- Exhibits20: Chart on Global - Market size and forecast 2023-2028 ($ billion)
- Exhibits21: Data Table on Global - Market size and forecast 2023-2028 ($ billion)
- Exhibits22: Chart on Global Market: Year-over-year growth 2023-2028 (%)
- Exhibits23: Data Table on Global Market: Year-over-year growth 2023-2028 (%)
- Exhibits24: Historic Market Size - Data Table on Global Sugar Confectionery Market 2018 - 2022 ($ billion)
- Exhibits25: Historic Market Size - Product Type Segment 2018 - 2022 ($ billion)
- Exhibits26: Historic Market Size - Distribution Channel Segment 2018 - 2022 ($ billion)
- Exhibits27: Historic Market Size - Geography Segment 2018 - 2022 ($ billion)
- Exhibits28: Historic Market Size - Country Segment 2018 - 2022 ($ billion)
- Exhibits29: Five forces analysis - Comparison between 2023 and 2028
- Exhibits30: Bargaining power of buyers - Impact of key factors 2023 and 2028
- Exhibits31: Bargaining power of suppliers - Impact of key factors in 2023 and 2028
- Exhibits32: Threat of new entrants - Impact of key factors in 2023 and 2028
- Exhibits33: Threat of substitutes - Impact of key factors in 2023 and 2028
- Exhibits34: Threat of rivalry - Impact of key factors in 2023 and 2028
- Exhibits35: Chart on Market condition - Five forces 2023 and 2028
- Exhibits36: Chart on Product Type - Market share 2023-2028 (%)
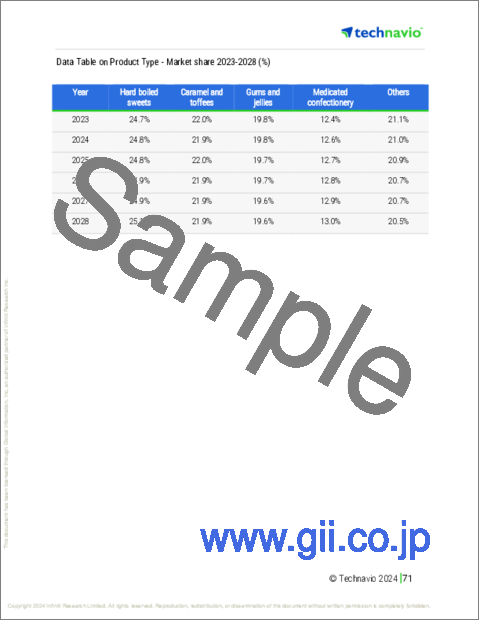
- Exhibits37: Data Table on Product Type - Market share 2023-2028 (%)
- Exhibits38: Chart on Comparison by Product Type
- Exhibits39: Data Table on Comparison by Product Type
- Exhibits40: Chart on Hard boiled sweets - Market size and forecast 2023-2028 ($ billion)
- Exhibits41: Data Table on Hard boiled sweets - Market size and forecast 2023-2028 ($ billion)
- Exhibits42: Chart on Hard boiled sweets - Year-over-year growth 2023-2028 (%)
- Exhibits43: Data Table on Hard boiled sweets - Year-over-year growth 2023-2028 (%)
- Exhibits44: Chart on Caramel and toffees - Market size and forecast 2023-2028 ($ billion)
- Exhibits45: Data Table on Caramel and toffees - Market size and forecast 2023-2028 ($ billion)
- Exhibits46: Chart on Caramel and toffees - Year-over-year growth 2023-2028 (%)
- Exhibits47: Data Table on Caramel and toffees - Year-over-year growth 2023-2028 (%)
- Exhibits48: Chart on Gums and jellies - Market size and forecast 2023-2028 ($ billion)
- Exhibits49: Data Table on Gums and jellies - Market size and forecast 2023-2028 ($ billion)
- Exhibits50: Chart on Gums and jellies - Year-over-year growth 2023-2028 (%)
- Exhibits51: Data Table on Gums and jellies - Year-over-year growth 2023-2028 (%)
- Exhibits52: Chart on Medicated confectionery - Market size and forecast 2023-2028 ($ billion)
- Exhibits53: Data Table on Medicated confectionery - Market size and forecast 2023-2028 ($ billion)
- Exhibits54: Chart on Medicated confectionery - Year-over-year growth 2023-2028 (%)
- Exhibits55: Data Table on Medicated confectionery - Year-over-year growth 2023-2028 (%)
- Exhibits56: Chart on Others - Market size and forecast 2023-2028 ($ billion)
- Exhibits57: Data Table on Others - Market size and forecast 2023-2028 ($ billion)
- Exhibits58: Chart on Others - Year-over-year growth 2023-2028 (%)
- Exhibits59: Data Table on Others - Year-over-year growth 2023-2028 (%)
- Exhibits60: Market opportunity by Product Type ($ billion)
- Exhibits61: Data Table on Market opportunity by Product Type ($ billion)
- Exhibits62: Chart on Distribution Channel - Market share 2023-2028 (%)
- Exhibits63: Data Table on Distribution Channel - Market share 2023-2028 (%)
- Exhibits64: Chart on Comparison by Distribution Channel
- Exhibits65: Data Table on Comparison by Distribution Channel
- Exhibits66: Chart on Offline - Market size and forecast 2023-2028 ($ billion)
- Exhibits67: Data Table on Offline - Market size and forecast 2023-2028 ($ billion)
- Exhibits68: Chart on Offline - Year-over-year growth 2023-2028 (%)
- Exhibits69: Data Table on Offline - Year-over-year growth 2023-2028 (%)
- Exhibits70: Chart on Online - Market size and forecast 2023-2028 ($ billion)
- Exhibits71: Data Table on Online - Market size and forecast 2023-2028 ($ billion)
- Exhibits72: Chart on Online - Year-over-year growth 2023-2028 (%)
- Exhibits73: Data Table on Online - Year-over-year growth 2023-2028 (%)
- Exhibits74: Market opportunity by Distribution Channel ($ billion)
- Exhibits75: Data Table on Market opportunity by Distribution Channel ($ billion)
- Exhibits76: Analysis of price sensitivity, lifecycle, customer purchase basket, adoption rates, and purchase criteria
- Exhibits77: Chart on Market share By Geographical Landscape 2023-2028 (%)
- Exhibits78: Data Table on Market share By Geographical Landscape 2023-2028 (%)
- Exhibits79: Chart on Geographic comparison
- Exhibits80: Data Table on Geographic comparison
- Exhibits81: Chart on APAC - Market size and forecast 2023-2028 ($ billion)
- Exhibits82: Data Table on APAC - Market size and forecast 2023-2028 ($ billion)
- Exhibits83: Chart on APAC - Year-over-year growth 2023-2028 (%)
- Exhibits84: Data Table on APAC - Year-over-year growth 2023-2028 (%)
- Exhibits85: Chart on North America - Market size and forecast 2023-2028 ($ billion)
- Exhibits86: Data Table on North America - Market size and forecast 2023-2028 ($ billion)
- Exhibits87: Chart on North America - Year-over-year growth 2023-2028 (%)
- Exhibits88: Data Table on North America - Year-over-year growth 2023-2028 (%)
- Exhibits89: Chart on Europe - Market size and forecast 2023-2028 ($ billion)
- Exhibits90: Data Table on Europe - Market size and forecast 2023-2028 ($ billion)
- Exhibits91: Chart on Europe - Year-over-year growth 2023-2028 (%)
- Exhibits92: Data Table on Europe - Year-over-year growth 2023-2028 (%)
- Exhibits93: Chart on Middle East and Africa - Market size and forecast 2023-2028 ($ billion)
- Exhibits94: Data Table on Middle East and Africa - Market size and forecast 2023-2028 ($ billion)
- Exhibits95: Chart on Middle East and Africa - Year-over-year growth 2023-2028 (%)
- Exhibits96: Data Table on Middle East and Africa - Year-over-year growth 2023-2028 (%)
- Exhibits97: Chart on South America - Market size and forecast 2023-2028 ($ billion)
- Exhibits98: Data Table on South America - Market size and forecast 2023-2028 ($ billion)
- Exhibits99: Chart on South America - Year-over-year growth 2023-2028 (%)
- Exhibits100: Data Table on South America - Year-over-year growth 2023-2028 (%)
- Exhibits101: Chart on US - Market size and forecast 2023-2028 ($ billion)
- Exhibits102: Data Table on US - Market size and forecast 2023-2028 ($ billion)
- Exhibits103: Chart on US - Year-over-year growth 2023-2028 (%)
- Exhibits104: Data Table on US - Year-over-year growth 2023-2028 (%)
- Exhibits105: Chart on China - Market size and forecast 2023-2028 ($ billion)
- Exhibits106: Data Table on China - Market size and forecast 2023-2028 ($ billion)
- Exhibits107: Chart on China - Year-over-year growth 2023-2028 (%)
- Exhibits108: Data Table on China - Year-over-year growth 2023-2028 (%)
- Exhibits109: Chart on Japan - Market size and forecast 2023-2028 ($ billion)
- Exhibits110: Data Table on Japan - Market size and forecast 2023-2028 ($ billion)
- Exhibits111: Chart on Japan - Year-over-year growth 2023-2028 (%)
- Exhibits112: Data Table on Japan - Year-over-year growth 2023-2028 (%)
- Exhibits113: Chart on Germany - Market size and forecast 2023-2028 ($ billion)
- Exhibits114: Data Table on Germany - Market size and forecast 2023-2028 ($ billion)
- Exhibits115: Chart on Germany - Year-over-year growth 2023-2028 (%)
- Exhibits116: Data Table on Germany - Year-over-year growth 2023-2028 (%)
- Exhibits117: Chart on India - Market size and forecast 2023-2028 ($ billion)
- Exhibits118: Data Table on India - Market size and forecast 2023-2028 ($ billion)
- Exhibits119: Chart on India - Year-over-year growth 2023-2028 (%)
- Exhibits120: Data Table on India - Year-over-year growth 2023-2028 (%)
- Exhibits121: Chart on Mexico - Market size and forecast 2023-2028 ($ billion)
- Exhibits122: Data Table on Mexico - Market size and forecast 2023-2028 ($ billion)
- Exhibits123: Chart on Mexico - Year-over-year growth 2023-2028 (%)
- Exhibits124: Data Table on Mexico - Year-over-year growth 2023-2028 (%)
- Exhibits125: Chart on UK - Market size and forecast 2023-2028 ($ billion)
- Exhibits126: Data Table on UK - Market size and forecast 2023-2028 ($ billion)
- Exhibits127: Chart on UK - Year-over-year growth 2023-2028 (%)
- Exhibits128: Data Table on UK - Year-over-year growth 2023-2028 (%)
- Exhibits129: Chart on France - Market size and forecast 2023-2028 ($ billion)
- Exhibits130: Data Table on France - Market size and forecast 2023-2028 ($ billion)
- Exhibits131: Chart on France - Year-over-year growth 2023-2028 (%)
- Exhibits132: Data Table on France - Year-over-year growth 2023-2028 (%)
- Exhibits133: Chart on Brazil - Market size and forecast 2023-2028 ($ billion)
- Exhibits134: Data Table on Brazil - Market size and forecast 2023-2028 ($ billion)
- Exhibits135: Chart on Brazil - Year-over-year growth 2023-2028 (%)
- Exhibits136: Data Table on Brazil - Year-over-year growth 2023-2028 (%)
- Exhibits137: Chart on Italy - Market size and forecast 2023-2028 ($ billion)
- Exhibits138: Data Table on Italy - Market size and forecast 2023-2028 ($ billion)
- Exhibits139: Chart on Italy - Year-over-year growth 2023-2028 (%)
- Exhibits140: Data Table on Italy - Year-over-year growth 2023-2028 (%)
- Exhibits141: Market opportunity By Geographical Landscape ($ billion)
- Exhibits142: Data Tables on Market opportunity By Geographical Landscape ($ billion)
- Exhibits143: Impact of drivers and challenges in 2023 and 2028
- Exhibits144: Overview on criticality of inputs and factors of differentiation
- Exhibits145: Overview on factors of disruption
- Exhibits146: Impact of key risks on business
- Exhibits147: Companies covered
- Exhibits148: Company ranking index
- Exhibits149: Matrix on companies position and classification
- Exhibits150: Amar Bio-Organics India Pvt. Ltd. - Overview
- Exhibits151: Amar Bio-Organics India Pvt. Ltd. - Product / Service
- Exhibits152: Amar Bio-Organics India Pvt. Ltd. - Key offerings
- Exhibits153: SWOT
- Exhibits154: Barry Callebaut AG - Overview
- Exhibits155: Barry Callebaut AG - Business segments
- Exhibits156: Barry Callebaut AG - Key news
- Exhibits157: Barry Callebaut AG - Key offerings
- Exhibits158: Barry Callebaut AG - Segment focus
- Exhibits159: SWOT
- Exhibits160: Dhiman Foods Pvt. Ltd - Overview
- Exhibits161: Dhiman Foods Pvt. Ltd - Product / Service
- Exhibits162: Dhiman Foods Pvt. Ltd - Key offerings
- Exhibits163: SWOT
- Exhibits164: Ferrara Candy Co - Overview
- Exhibits165: Ferrara Candy Co - Product / Service
- Exhibits166: Ferrara Candy Co - Key offerings
- Exhibits167: SWOT
- Exhibits168: Gumlink Confectionery Company AS - Overview
- Exhibits169: Gumlink Confectionery Company AS - Product / Service
- Exhibits170: Gumlink Confectionery Company AS - Key offerings
- Exhibits171: SWOT
- Exhibits172: HARIBO GmbH and Co. KG - Overview
- Exhibits173: HARIBO GmbH and Co. KG - Product / Service
- Exhibits174: HARIBO GmbH and Co. KG - Key offerings
- Exhibits175: SWOT
- Exhibits176: Mars Inc. - Overview
- Exhibits177: Mars Inc. - Product / Service
- Exhibits178: Mars Inc. - Key news
- Exhibits179: Mars Inc. - Key offerings
- Exhibits180: SWOT
- Exhibits181: Melbas Australia Pty Ltd - Overview
- Exhibits182: Melbas Australia Pty Ltd - Product / Service
- Exhibits183: Melbas Australia Pty Ltd - Key offerings
- Exhibits184: SWOT
- Exhibits185: Mondelez International Inc. - Overview
- Exhibits186: Mondelez International Inc. - Business segments
- Exhibits187: Mondelez International Inc. - Key news
- Exhibits188: Mondelez International Inc. - Key offerings
- Exhibits189: Mondelez International Inc. - Segment focus
- Exhibits190: SWOT
- Exhibits191: Nestle SA - Overview
- Exhibits192: Nestle SA - Business segments
- Exhibits193: Nestle SA - Key news
- Exhibits194: Nestle SA - Key offerings
- Exhibits195: Nestle SA - Segment focus
- Exhibits196: SWOT
- Exhibits197: Perfetti Van Melle Group BV - Overview
- Exhibits198: Perfetti Van Melle Group BV - Product / Service
- Exhibits199: Perfetti Van Melle Group BV - Key offerings
- Exhibits200: SWOT
- Exhibits201: Prayagh Consumer Care P. Ltd. - Overview
- Exhibits202: Prayagh Consumer Care P. Ltd. - Product / Service
- Exhibits203: Prayagh Consumer Care P. Ltd. - Key offerings
- Exhibits204: SWOT
- Exhibits205: Swan Sweets Pvt Ltd. - Overview
- Exhibits206: Swan Sweets Pvt Ltd. - Product / Service
- Exhibits207: Swan Sweets Pvt Ltd. - Key offerings
- Exhibits208: SWOT
- Exhibits209: The Beechworth Sweet Co. - Overview
- Exhibits210: The Beechworth Sweet Co. - Product / Service
- Exhibits211: The Beechworth Sweet Co. - Key offerings
- Exhibits212: SWOT
- Exhibits213: The Hershey Co. - Overview
- Exhibits214: The Hershey Co. - Business segments
- Exhibits215: The Hershey Co. - Key offerings
- Exhibits216: The Hershey Co. - Segment focus
- Exhibits217: SWOT
- Exhibits218: Inclusions checklist
- Exhibits219: Exclusions checklist
- Exhibits220: Currency conversion rates for US$
- Exhibits221: Research methodology
- Exhibits222: Information sources
- Exhibits223: Data validation
- Exhibits224: Validation techniques employed for market sizing
- Exhibits225: Data synthesis
- Exhibits226: 360 degree market analysis
- Exhibits227: List of abbreviations
Sugar Confectionery Market 2024-2028
The sugar confectionery market is forecasted to grow by USD 24.8 bn during 2023-2028, accelerating at a CAGR of 5.5% during the forecast period. The report on the sugar confectionery market provides a holistic analysis, market size and forecast, trends, growth drivers, and challenges, as well as vendor analysis covering around 25 vendors.
The report offers an up-to-date analysis regarding the current market scenario, the latest trends and drivers, and the overall market environment. The market is driven by increasing product launches, increasing demand for low sugar confections, and increasing product innovation.
| Market Scope | |
|---|---|
| Base Year | 2024 |
| End Year | 2028 |
| Series Year | 2024-2028 |
| Growth Momentum | Accelerate |
| YOY 2024 | 4.8% |
| CAGR | 5.5% |
| Incremental Value | $24.8 bn |
Technavio's sugar confectionery market is segmented as below:
By Product Type
- Hard boiled sweets
- Caramel and toffees
- Gums and jellies
- Medicated confectionery
- Others
By Distribution Channel
- Offline
- Online
By Geographical Landscape
- APAC
- North America
- Europe
- Middle East and Africa
- South America
This study identifies the rising prominence of online retailing as one of the prime reasons driving the sugar confectionery market growth during the next few years. Also, increasing demand for sugar confectionery from developing economies and increasing inorganic strategies by vendors will lead to sizable demand in the market.
The report on the sugar confectionery market covers the following areas:
- Sugar Confectionery Market sizing
- Sugar Confectionery Market forecast
- Sugar Confectionery Market industry analysis
The robust vendor analysis is designed to help clients improve their market position, and in line with this, this report provides a detailed analysis of several leading sugar confectionery market vendors that include Amar Bio-Organics India Pvt. Ltd., Bah Humbugs, Barry Callebaut AG, Dhiman Foods Pvt. Ltd, Ferrara Candy Co, Gumlink Confectionery Company AS, HARIBO GmbH and Co. KG, Mars Inc., Melbas Australia Pty Ltd, Mondelez International Inc., Nestle SA, Perfetti Van Melle Group BV, Prayagh Consumer Care P. Ltd., Saltire Candy Ltd., SHR TRADECORP Pvt Ltd, Somods Bolcher, Suncrest Food Makers, Swan Sweets Pvt Ltd., The Beechworth Sweet Co., and The Hershey Co.. Also, the sugar confectionery market analysis report includes information on upcoming trends and challenges that will influence market growth. This is to help companies strategize and leverage all forthcoming growth opportunities.
The study was conducted using an objective combination of primary and secondary information including inputs from key participants in the industry. The report contains a comprehensive market and vendor landscape in addition to an analysis of the key vendors.
The publisher presents a detailed picture of the market by the way of study, synthesis, and summation of data from multiple sources by an analysis of key parameters such as profit, pricing, competition, and promotions. It presents various market facets by identifying the key industry influencers. The data presented is comprehensive, reliable, and a result of extensive primary and secondary research. The market research reports provide a complete competitive landscape and an in-depth vendor selection methodology and analysis using qualitative and quantitative research to forecast accurate market growth.
Table of Contents
1 Executive Summary
- 1.1 Market overview
- Executive Summary - Chart on Market Overview
- Executive Summary - Data Table on Market Overview
- Executive Summary - Chart on Global Market Characteristics
- Executive Summary - Chart on Market By Geographical Landscape
- Executive Summary - Chart on Market Segmentation by Product Type
- Executive Summary - Chart on Market Segmentation by Distribution Channel
- Executive Summary - Chart on Incremental Growth
- Executive Summary - Data Table on Incremental Growth
- Executive Summary - Chart on Company Market Positioning
2 Technavio Analysis
- 2.1 Analysis of price sensitivity, lifecycle, customer purchase basket, adoption rates, and purchase criteria
- Analysis of price sensitivity, lifecycle, customer purchase basket, adoption rates, and purchase criteria
- 2.2 Criticality of inputs and Factors of differentiation
- Overview on criticality of inputs and factors of differentiation
- 2.3 Factors of disruption
- Overview on factors of disruption
- 2.4 Impact of drivers and challenges
- Impact of drivers and challenges in 2023 and 2028
3 Market Landscape
- 3.1 Market ecosystem
- Parent Market
- Data Table on - Parent Market
- 3.2 Market characteristics
- Market characteristics analysis
- 3.3 Value chain analysis
- Value Chain Analysis
4 Market Sizing
- 4.1 Market definition
- Offerings of companies included in the market definition
- 4.2 Market segment analysis
- Market segments
- 4.3 Market size 2023
- 4.4 Market outlook: Forecast for 2023-2028
- Chart on Global - Market size and forecast 2023-2028 ($ billion)
- Data Table on Global - Market size and forecast 2023-2028 ($ billion)
- Chart on Global Market: Year-over-year growth 2023-2028 (%)
- Data Table on Global Market: Year-over-year growth 2023-2028 (%)
5 Historic Market Size
- 5.1 Global Sugar Confectionery Market 2018 - 2022
- Historic Market Size - Data Table on Global Sugar Confectionery Market 2018 - 2022 ($ billion)
- 5.2 Product Type segment analysis 2018 - 2022
- Historic Market Size - Product Type Segment 2018 - 2022 ($ billion)
- 5.3 Distribution Channel segment analysis 2018 - 2022
- Historic Market Size - Distribution Channel Segment 2018 - 2022 ($ billion)
- 5.4 Geography segment analysis 2018 - 2022
- Historic Market Size - Geography Segment 2018 - 2022 ($ billion)
- 5.5 Country segment analysis 2018 - 2022
- Historic Market Size - Country Segment 2018 - 2022 ($ billion)
6 Qualitative Analysis
- 6.1 Impact of AI on the Global Sugar Confectionery Market
7 Five Forces Analysis
- 7.1 Five forces summary
- Five forces analysis - Comparison between 2023 and 2028
- 7.2 Bargaining power of buyers
- Bargaining power of buyers - Impact of key factors 2023 and 2028
- 7.3 Bargaining power of suppliers
- Bargaining power of suppliers - Impact of key factors in 2023 and 2028
- 7.4 Threat of new entrants
- Threat of new entrants - Impact of key factors in 2023 and 2028
- 7.5 Threat of substitutes
- Threat of substitutes - Impact of key factors in 2023 and 2028
- 7.6 Threat of rivalry
- Threat of rivalry - Impact of key factors in 2023 and 2028
- 7.7 Market condition
- Chart on Market condition - Five forces 2023 and 2028
8 Market Segmentation by Product Type
- 8.1 Market segments
- Chart on Product Type - Market share 2023-2028 (%)
- Data Table on Product Type - Market share 2023-2028 (%)
- 8.2 Comparison by Product Type
- Chart on Comparison by Product Type
- Data Table on Comparison by Product Type
- 8.3 Hard boiled sweets - Market size and forecast 2023-2028
- Chart on Hard boiled sweets - Market size and forecast 2023-2028 ($ billion)
- Data Table on Hard boiled sweets - Market size and forecast 2023-2028 ($ billion)
- Chart on Hard boiled sweets - Year-over-year growth 2023-2028 (%)
- Data Table on Hard boiled sweets - Year-over-year growth 2023-2028 (%)
- 8.4 Caramel and toffees - Market size and forecast 2023-2028
- Chart on Caramel and toffees - Market size and forecast 2023-2028 ($ billion)
- Data Table on Caramel and toffees - Market size and forecast 2023-2028 ($ billion)
- Chart on Caramel and toffees - Year-over-year growth 2023-2028 (%)
- Data Table on Caramel and toffees - Year-over-year growth 2023-2028 (%)
- 8.5 Gums and jellies - Market size and forecast 2023-2028
- Chart on Gums and jellies - Market size and forecast 2023-2028 ($ billion)
- Data Table on Gums and jellies - Market size and forecast 2023-2028 ($ billion)
- Chart on Gums and jellies - Year-over-year growth 2023-2028 (%)
- Data Table on Gums and jellies - Year-over-year growth 2023-2028 (%)
- 8.6 Medicated confectionery - Market size and forecast 2023-2028
- Chart on Medicated confectionery - Market size and forecast 2023-2028 ($ billion)
- Data Table on Medicated confectionery - Market size and forecast 2023-2028 ($ billion)
- Chart on Medicated confectionery - Year-over-year growth 2023-2028 (%)
- Data Table on Medicated confectionery - Year-over-year growth 2023-2028 (%)
- 8.7 Others - Market size and forecast 2023-2028
- Chart on Others - Market size and forecast 2023-2028 ($ billion)
- Data Table on Others - Market size and forecast 2023-2028 ($ billion)
- Chart on Others - Year-over-year growth 2023-2028 (%)
- Data Table on Others - Year-over-year growth 2023-2028 (%)
- 8.8 Market opportunity by Product Type
- Market opportunity by Product Type ($ billion)
- Data Table on Market opportunity by Product Type ($ billion)
9 Market Segmentation by Distribution Channel
- 9.1 Market segments
- Chart on Distribution Channel - Market share 2023-2028 (%)
- Data Table on Distribution Channel - Market share 2023-2028 (%)
- 9.2 Comparison by Distribution Channel
- Chart on Comparison by Distribution Channel
- Data Table on Comparison by Distribution Channel
- 9.3 Offline - Market size and forecast 2023-2028
- Chart on Offline - Market size and forecast 2023-2028 ($ billion)
- Data Table on Offline - Market size and forecast 2023-2028 ($ billion)
- Chart on Offline - Year-over-year growth 2023-2028 (%)
- Data Table on Offline - Year-over-year growth 2023-2028 (%)
- 9.4 Online - Market size and forecast 2023-2028
- Chart on Online - Market size and forecast 2023-2028 ($ billion)
- Data Table on Online - Market size and forecast 2023-2028 ($ billion)
- Chart on Online - Year-over-year growth 2023-2028 (%)
- Data Table on Online - Year-over-year growth 2023-2028 (%)
- 9.5 Market opportunity by Distribution Channel
- Market opportunity by Distribution Channel ($ billion)
- Data Table on Market opportunity by Distribution Channel ($ billion)
10 Customer Landscape
- 10.1 Customer landscape overview
- Analysis of price sensitivity, lifecycle, customer purchase basket, adoption rates, and purchase criteria
11 Geographic Landscape
- 11.1 Geographic segmentation
- Chart on Market share By Geographical Landscape 2023-2028 (%)
- Data Table on Market share By Geographical Landscape 2023-2028 (%)
- 11.2 Geographic comparison
- Chart on Geographic comparison
- Data Table on Geographic comparison
- 11.3 APAC - Market size and forecast 2023-2028
- Chart on APAC - Market size and forecast 2023-2028 ($ billion)
- Data Table on APAC - Market size and forecast 2023-2028 ($ billion)
- Chart on APAC - Year-over-year growth 2023-2028 (%)
- Data Table on APAC - Year-over-year growth 2023-2028 (%)
- 11.4 North America - Market size and forecast 2023-2028
- Chart on North America - Market size and forecast 2023-2028 ($ billion)
- Data Table on North America - Market size and forecast 2023-2028 ($ billion)
- Chart on North America - Year-over-year growth 2023-2028 (%)
- Data Table on North America - Year-over-year growth 2023-2028 (%)
- 11.5 Europe - Market size and forecast 2023-2028
- Chart on Europe - Market size and forecast 2023-2028 ($ billion)
- Data Table on Europe - Market size and forecast 2023-2028 ($ billion)
- Chart on Europe - Year-over-year growth 2023-2028 (%)
- Data Table on Europe - Year-over-year growth 2023-2028 (%)
- 11.6 Middle East and Africa - Market size and forecast 2023-2028
- Chart on Middle East and Africa - Market size and forecast 2023-2028 ($ billion)
- Data Table on Middle East and Africa - Market size and forecast 2023-2028 ($ billion)
- Chart on Middle East and Africa - Year-over-year growth 2023-2028 (%)
- Data Table on Middle East and Africa - Year-over-year growth 2023-2028 (%)
- 11.7 South America - Market size and forecast 2023-2028
- Chart on South America - Market size and forecast 2023-2028 ($ billion)
- Data Table on South America - Market size and forecast 2023-2028 ($ billion)
- Chart on South America - Year-over-year growth 2023-2028 (%)
- Data Table on South America - Year-over-year growth 2023-2028 (%)
- 11.8 US - Market size and forecast 2023-2028
- Chart on US - Market size and forecast 2023-2028 ($ billion)
- Data Table on US - Market size and forecast 2023-2028 ($ billion)
- Chart on US - Year-over-year growth 2023-2028 (%)
- Data Table on US - Year-over-year growth 2023-2028 (%)
- 11.9 China - Market size and forecast 2023-2028
- Chart on China - Market size and forecast 2023-2028 ($ billion)
- Data Table on China - Market size and forecast 2023-2028 ($ billion)
- Chart on China - Year-over-year growth 2023-2028 (%)
- Data Table on China - Year-over-year growth 2023-2028 (%)
- 11.10 Japan - Market size and forecast 2023-2028
- Chart on Japan - Market size and forecast 2023-2028 ($ billion)
- Data Table on Japan - Market size and forecast 2023-2028 ($ billion)
- Chart on Japan - Year-over-year growth 2023-2028 (%)
- Data Table on Japan - Year-over-year growth 2023-2028 (%)
- 11.11 Germany - Market size and forecast 2023-2028
- Chart on Germany - Market size and forecast 2023-2028 ($ billion)
- Data Table on Germany - Market size and forecast 2023-2028 ($ billion)
- Chart on Germany - Year-over-year growth 2023-2028 (%)
- Data Table on Germany - Year-over-year growth 2023-2028 (%)
- 11.12 India - Market size and forecast 2023-2028
- Chart on India - Market size and forecast 2023-2028 ($ billion)
- Data Table on India - Market size and forecast 2023-2028 ($ billion)
- Chart on India - Year-over-year growth 2023-2028 (%)
- Data Table on India - Year-over-year growth 2023-2028 (%)
- 11.13 Mexico - Market size and forecast 2023-2028
- Chart on Mexico - Market size and forecast 2023-2028 ($ billion)
- Data Table on Mexico - Market size and forecast 2023-2028 ($ billion)
- Chart on Mexico - Year-over-year growth 2023-2028 (%)
- Data Table on Mexico - Year-over-year growth 2023-2028 (%)
- 11.14 UK - Market size and forecast 2023-2028
- Chart on UK - Market size and forecast 2023-2028 ($ billion)
- Data Table on UK - Market size and forecast 2023-2028 ($ billion)
- Chart on UK - Year-over-year growth 2023-2028 (%)
- Data Table on UK - Year-over-year growth 2023-2028 (%)
- 11.15 France - Market size and forecast 2023-2028
- Chart on France - Market size and forecast 2023-2028 ($ billion)
- Data Table on France - Market size and forecast 2023-2028 ($ billion)
- Chart on France - Year-over-year growth 2023-2028 (%)
- Data Table on France - Year-over-year growth 2023-2028 (%)
- 11.16 Brazil - Market size and forecast 2023-2028
- Chart on Brazil - Market size and forecast 2023-2028 ($ billion)
- Data Table on Brazil - Market size and forecast 2023-2028 ($ billion)
- Chart on Brazil - Year-over-year growth 2023-2028 (%)
- Data Table on Brazil - Year-over-year growth 2023-2028 (%)
- 11.17 Italy - Market size and forecast 2023-2028
- Chart on Italy - Market size and forecast 2023-2028 ($ billion)
- Data Table on Italy - Market size and forecast 2023-2028 ($ billion)
- Chart on Italy - Year-over-year growth 2023-2028 (%)
- Data Table on Italy - Year-over-year growth 2023-2028 (%)
- 11.18 Market opportunity By Geographical Landscape
- Market opportunity By Geographical Landscape ($ billion)
- Data Tables on Market opportunity By Geographical Landscape ($ billion)
12 Drivers, Challenges, and Opportunity/Restraints
- 12.1 Market drivers
- 12.2 Market challenges
- 12.3 Impact of drivers and challenges
- Impact of drivers and challenges in 2023 and 2028
- 12.4 Market opportunities/restraints
13 Competitive Landscape
- 13.1 Overview
- 13.2 Competitive Landscape
- Overview on criticality of inputs and factors of differentiation
- 13.3 Landscape disruption
- Overview on factors of disruption
- 13.4 Industry risks
- Impact of key risks on business
14 Competitive Analysis
- 14.1 Companies profiled
- Companies covered
- 14.2 Company ranking index
- Company ranking index
- 14.3 Market positioning of companies
- Matrix on companies position and classification
- 14.4 Amar Bio-Organics India Pvt. Ltd.
- Amar Bio-Organics India Pvt. Ltd. - Overview
- Amar Bio-Organics India Pvt. Ltd. - Product / Service
- Amar Bio-Organics India Pvt. Ltd. - Key offerings
- SWOT
- 14.5 Barry Callebaut AG
- Barry Callebaut AG - Overview
- Barry Callebaut AG - Business segments
- Barry Callebaut AG - Key news
- Barry Callebaut AG - Key offerings
- Barry Callebaut AG - Segment focus
- SWOT
- 14.6 Dhiman Foods Pvt. Ltd
- Dhiman Foods Pvt. Ltd - Overview
- Dhiman Foods Pvt. Ltd - Product / Service
- Dhiman Foods Pvt. Ltd - Key offerings
- SWOT
- 14.7 Ferrara Candy Co
- Ferrara Candy Co - Overview
- Ferrara Candy Co - Product / Service
- Ferrara Candy Co - Key offerings
- SWOT
- 14.8 Gumlink Confectionery Company AS
- Gumlink Confectionery Company AS - Overview
- Gumlink Confectionery Company AS - Product / Service
- Gumlink Confectionery Company AS - Key offerings
- SWOT
- 14.9 HARIBO GmbH and Co. KG
- HARIBO GmbH and Co. KG - Overview
- HARIBO GmbH and Co. KG - Product / Service
- HARIBO GmbH and Co. KG - Key offerings
- SWOT
- 14.10 Mars Inc.
- Mars Inc. - Overview
- Mars Inc. - Product / Service
- Mars Inc. - Key news
- Mars Inc. - Key offerings
- SWOT
- 14.11 Melbas Australia Pty Ltd
- Melbas Australia Pty Ltd - Overview
- Melbas Australia Pty Ltd - Product / Service
- Melbas Australia Pty Ltd - Key offerings
- SWOT
- 14.12 Mondelez International Inc.
- Mondelez International Inc. - Overview
- Mondelez International Inc. - Business segments
- Mondelez International Inc. - Key news
- Mondelez International Inc. - Key offerings
- Mondelez International Inc. - Segment focus
- SWOT
- 14.13 Nestle SA
- Nestle SA - Overview
- Nestle SA - Business segments
- Nestle SA - Key news
- Nestle SA - Key offerings
- Nestle SA - Segment focus
- SWOT
- 14.14 Perfetti Van Melle Group BV
- Perfetti Van Melle Group BV - Overview
- Perfetti Van Melle Group BV - Product / Service
- Perfetti Van Melle Group BV - Key offerings
- SWOT
- 14.15 Prayagh Consumer Care P. Ltd.
- Prayagh Consumer Care P. Ltd. - Overview
- Prayagh Consumer Care P. Ltd. - Product / Service
- Prayagh Consumer Care P. Ltd. - Key offerings
- SWOT
- 14.16 Swan Sweets Pvt Ltd.
- Swan Sweets Pvt Ltd. - Overview
- Swan Sweets Pvt Ltd. - Product / Service
- Swan Sweets Pvt Ltd. - Key offerings
- SWOT
- 14.17 The Beechworth Sweet Co.
- The Beechworth Sweet Co. - Overview
- The Beechworth Sweet Co. - Product / Service
- The Beechworth Sweet Co. - Key offerings
- SWOT
- 14.18 The Hershey Co.
- The Hershey Co. - Overview
- The Hershey Co. - Business segments
- The Hershey Co. - Key offerings
- The Hershey Co. - Segment focus
- SWOT
15 Appendix
- 15.1 Scope of the report
- 15.2 Inclusions and exclusions checklist
- Inclusions checklist
- Exclusions checklist
- 15.3 Currency conversion rates for US$
- Currency conversion rates for US$
- 15.4 Research methodology
- Research methodology
- 15.5 Data procurement
- Information sources
- 15.6 Data validation
- Data validation
- 15.7 Validation techniques employed for market sizing
- Validation techniques employed for market sizing
- 15.8 Data synthesis
- Data synthesis
- 15.9 360 degree market analysis
- 360 degree market analysis
- 15.10 List of abbreviations
- List of abbreviations
