
アジア太平洋地域の砂糖菓子:市場シェア分析、産業動向・統計、成長予測(2025年~2030年)
Asia Pacific Sugar Confectionery - Market Share Analysis, Industry Trends & Statistics, Growth Forecasts (2025 - 2030)- 発行日
- ページ情報
- 英文 191 Pages
- 納期
- 2~3営業日
- 商品コード
- 1684015
- カスタマイズ可能 お客様のご希望に応じて、既存データの加工や未掲載情報(例:国別セグメント)の追加などの対応が可能です。詳細はお問い合わせください。
- 適宜更新あり 本レポートは最新情報反映のため適宜更新し、内容構成変更を行う場合があります。ご検討の際はお問い合わせください。
- 翻訳ツール提供対象 PDF対応AI翻訳ツールの無料貸し出しサービスのご利用が可能です
概要
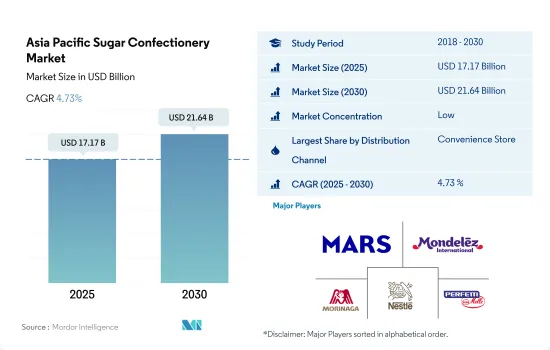
アジア太平洋地域の砂糖菓子の市場規模は2025年に171億7,000万米ドルと推定され、2030年には216億4,000万米ドルに達すると予測され、予測期間中(2025~2030年)のCAGRは4.73%で成長する見込みです。
アクセスが容易でさまざまなブランドの砂糖菓子が入手可能なことから、この地域ではスーパーマーケット/ハイパーマーケットとコンビニエンスストアが砂糖菓子の主要販売チャネルとなっています。
- コンビニエンスストアはアジア太平洋地域における砂糖菓子の主要な販売チャネルです。ハードキャンディ、ゼリー、グミ、ミント、ロリポップなどの砂糖菓子は、外出先での消費に最適であるため、コンビニエンスストアで主に販売されています。コンビニエンスストアを通じた砂糖菓子の販売額は、前年の2022年と比較して2023年には3.9%増加しました。
- コンビニエンスストアの数が増加していることも、予測期間中に砂糖菓子に有益な成長機会を提供すると予想される要因です。コンビニエンスストアは地域全体のほとんどの場所で利用できます。地域の中でコンビニエンスストアの数が最も多いのは中国です。2022年には25万5,000以上のコンビニエンスストアが存在しました。日本は58,000店以上で2位につけています。
- スーパーマーケットとハイパーマーケットは、コンビニエンスストアに次いで広く好まれている流通チャネルです。スーパーマーケットとハイパーマーケットを通じた砂糖菓子の販売額は、2021年から2023年にかけて7.1%の成長率を記録しました。これらの小売チャネルは、提供されるブランドの品揃えの豊富さ、棚面積の広さ、頻繁な価格プロモーションなどにより、強い地位を占めています。
- オンライン・チャネルは、同地域における砂糖菓子の販売で最も急成長している流通チャネルになると予想されます。オンライン・チャネルを通じた砂糖菓子の販売額は、2022年から2027年には14.22%成長すると予測されます。オンライン・チャネルは利便性が高く、割引価格が適用され、迅速な配送オプションが提供されるため、消費者はオンライン・チャネルを好む可能性が高いです。
砂糖菓子の主要消費者層である子供の人口が多いため、中国とインドが合計で市場シェアの50%以上を占めています。
- アジア太平洋地域の砂糖菓子市場は、2023年には前年の2022年比で3.99%の成長を記録しました。アジア太平洋地域の菓子類市場は、可処分所得の増加、都市化、消費者の嗜好の変化、嗜好品への欲求の高まりなど、いくつかの要因によって大きな成長を遂げました。
- 同地域の主要市場は中国とインドであり、次いで日本とインドネシアです。中国とインドは、2023年の砂糖菓子市場全体の67.84%(数量ベース)を占めています。2023年の中国における砂糖菓子の消費額は約136億3,900万米ドルに達し、2021年から7.29%の伸びを示しました。おいしくて便利な嗜好性間食に対する消費者の嗜好が、同国の主要な市場促進要因であることが確認されています。
- インドでは、砂糖菓子市場は2021年から2023年にかけて数量ベースで10.49%の成長を記録しました。一人当たりの砂糖消費量の多さが主要な市場促進要因です。2022年、インドの一人当たりの砂糖消費量は年間約20kgでした。また、同国は砂糖菓子の世界の主要消費者層である子供の人口が多いです。2023年現在、インドの人口の30%近くが子供(0~18歳)です。また、インドネシアでは、2023年時点で18歳未満の子どもが同国の人口の約29%を占めています。
- 日本では、パスティーユ、グミ、ゼリーが砂糖菓子で主に消費されており、2023年の砂糖菓子市場全体の27.62%を占めています。日本では、グミは子供と大人の両方の消費者に人気のある菓子です。カバヤ、明治、春日井、ノーベルなどの主要メーカーは、潜在的な消費者を惹きつけるためにさまざまなフレーバーのグミを提供しています。
アジア太平洋地域の砂糖菓子の市場動向
祝祭シーズンや休日には砂糖菓子の需要が急増します。
- アジア太平洋地域における砂糖菓子の消費は、伝統的な風習、文化的な祝い事、地域住民の間食などの要因によるものです。アジア太平洋地域では、約78%の消費者が仕事や旅行中にハードキャンディーを好んで消費している(2022-2023年)。
- 製品属性では、消費者はブランドイメージを重視しています。2023年には、総人口の約70%がブランドイメージ(良いブランドイメージとは何か)のある製品を好みます。;パッケージは菓子類にとって2番目に重要な製品属性であり、購入の可能性を決定すると考えられています。
- 2023年の砂糖菓子の売上高は、2022年と比較して4.5%増加しました。砂糖菓子のカテゴリーでは、ハード・キャンディが2022年に大きな人気を獲得しています。
- アジアでは、砂糖菓子は糖度が高く、さまざまな原材料を使用したユニークなフレーバーがあるため、甘党の消費者に好まれています。
アジア太平洋地域の砂糖菓子産業の概要
アジア太平洋地域の砂糖菓子市場は断片化されており、上位5社で17.87%を占めています。この市場の主要企業は以下の通りです。 Mars Incorporated, Mondelez International Inc., Morinaga &, Nestle SA and Perfetti Van Melle BV(sorted alphabetically).
その他の特典
- エクセル形式の市場予測(ME)シート
- 3ヶ月のアナリストサポート
目次
第1章 エグゼクティブサマリーと主な調査結果
第2章 レポートのオファー
第3章 イントロダクション
- 調査の前提条件と市場定義
- 調査範囲
- 調査手法
第4章 主要産業動向
- 規制の枠組み
- 消費者の購買行動
- 成分分析
- バリューチェーンと流通チャネル分析
第5章 市場セグメンテーション
- 菓子種類
- ハードキャンディ
- ロリポップ
- ミント
- パスティル、グミ、ゼリー
- トフィーとヌガー
- その他
- 流通チャネル
- コンビニエンスストア
- オンラインストア
- スーパーマーケット
- その他
- 国
- オーストラリア
- 中国
- インド
- インドネシア
- 日本
- マレーシア
- ニュージーランド
- 韓国
- その他アジア太平洋地域
第6章 競合情勢
- 主要な戦略動向
- 市場シェア分析
- 企業情勢
- 企業プロファイル
- Ferrero International SA
- Lotte Corporation
- Mars Incorporated
- Meiji Holdings Company Ltd
- Mondelez International Inc.
- Morinaga & Co. Ltd
- Nestle SA
- Orion Holdings Corporation
- Perfetti Van Melle BV
- The Bazooka Companies Inc.
- The Hershey Company
第7章 CEOへの主な戦略的質問
第8章 付録
- 世界概要
- 概要
- ファイブフォース分析フレームワーク
- 世界のバリューチェーン分析
- 市場力学(DROs)
- 情報源と参考文献
- 図表一覧
- 主要洞察
- データパック
- 用語集
目次
The Asia Pacific Sugar Confectionery Market size is estimated at 17.17 billion USD in 2025, and is expected to reach 21.64 billion USD by 2030, growing at a CAGR of 4.73% during the forecast period (2025-2030).
Ease access and the availability of various brands of sugar confections make supermarkets/hypermarkets and convenience stores the major channels for sales of sugar confectionery in the region
- Convenience stores are the major retail channels for the sales of sugar confectionery in the Asia-Pacific region. Sugar confectionery products such as hard candy, jellies, gummies, mints, lollipops, and others are majorly available in convenience stores as they are perfect for on-the-go consumption, which shoppers are looking for within the channel. The sales value of sugar confectionery through convenience stores increased by 3.9% in 2023 compared to the previous year, 2022.
- The growing number of convenience stores is another factor anticipated to offer profitable growth opportunities for sugar confectionery during the forecast period. Convenience stores are available in most locations across the region. Among the regions, China has the greatest number of convenience stores. In 2022, more than 255,000 convenience stores existed in the country. Japan stood in second place with more than 58,000 stores.
- Supermarkets and hypermarkets are the second most widely preferred distribution channels after convenience stores. The sales value of sugar confectionery products through supermarkets and hypermarkets registered a growth rate of 7.1% from 2021 to 2023. These retail channels have a strong position due to the wide selection of brands offered, considerable shelf space, and frequent price promotions.
- The online channel is expected to be the fastest-growing distribution channel for the sales of sugar confectionery products in the region. The sales value of sugar confectionery products through online channels is anticipated to grow by 14.22% in 2027 from 2022. Consumers are likely to prefer online channels as they offer convenience, discounted rates, and provide quick delivery options.
China and India collectively accounted for more than 50% of the market share due to the large population of children, which is the major consumer group of sugar confectionery
- The sugar confectionery market in the Asia-Pacific region registered a growth of 3.99% in 2023 compared to the previous year, 2022. The sugar confectionery market in Asia-Pacific witnessed significant growth due to several factors, including rising disposable incomes, urbanization, changes in consumer preferences, and an increasing appetite for indulgent treats.
- China and India are identified as the major markets in the region, followed by Japan and Indonesia. China and India collectively accounted for 67.84% of the region's overall sugar confectionery market in 2023 in terms of volume. In 2023, the consumption of sugar confectionery in China reached around USD 13,639 million, representing a 7.29% growth from 2021. Consumer preference for tasty and convenient indulgent snacking is identified as the key market driver in the country.
- In India, the sugar confectionery market recorded a growth of 10.49% in volume from 2021 to 2023. High per capita consumption of sugar is identified as the key market driver. In 2022, per capita sugar consumption in India was around 20 kg annually. Also, the country has a large population of children, which is the major global consumer group for sugar confectionery. As of 2023, nearly 30% of the population of India are children (0-18 Years). Also, in Indonesia, children under the age of 18 represented about 29% of the country's population in 2023.
- In Japan, pastilles, gummies, and jellies were largely consumed in sugar confections, with a 27.62% share of the total sugar confectionery market in 2023. In Japan, gummies are popular confections among both children and adult consumers. Key manufacturers, including Kabaya, Meiji, Kasugai, and Nobel, offer gummies in a variety of flavors to attract potential consumers.
Asia Pacific Sugar Confectionery Market Trends
Festive seasons and holidays often witness a surge in the demand for sugar confectionery, coupled with the presence of leading manufacturers across the region
- Sugar confectionery consumption in Asia-Pacific is attributed to factors like traditional customs, cultural celebrations, and regular snacking among the population in the region. In Asia-Pacific, about 78% of consumers prefer consuming hard candies during their work and traveling period (2022-2023).
- Under product attributes, consumers are significantly focusing on brand image. Around 70% of the total population preferred products with a brand image (what is a good brand Image) in 2023.; Packaging is considered as the second most important product attribute for confectionery products, which determines the likelihood of purchasing.
- In 2023, sugar confections witnessed a hike in their sales by 4.5% when compared to 2022. The sales growth is linked to the growing consumer density for sugar confectioneries with unique flavors.; Under the sugar confectionery category, hard candy has been gaining a significant volume of popularity in 2022 as consumers prefer them during traveling and also during their working hours.
- In Asia, the consumption of sugar confectionery is generally preferred by sweet tooth consumers as these confections are high in sugar content and also come in unique flavors with different ingredients in them.
Asia Pacific Sugar Confectionery Industry Overview
The Asia Pacific Sugar Confectionery Market is fragmented, with the top five companies occupying 17.87%. The major players in this market are Mars Incorporated, Mondelez International Inc., Morinaga & Co. Ltd, Nestle SA and Perfetti Van Melle BV (sorted alphabetically).
Additional Benefits:
- The market estimate (ME) sheet in Excel format
- 3 months of analyst support
TABLE OF CONTENTS
1 EXECUTIVE SUMMARY & KEY FINDINGS
2 REPORT OFFERS
3 INTRODUCTION
- 3.1 Study Assumptions & Market Definition
- 3.2 Scope of the Study
- 3.3 Research Methodology
4 KEY INDUSTRY TRENDS
- 4.1 Regulatory Framework
- 4.2 Consumer Buying Behavior
- 4.3 Ingredient Analysis
- 4.4 Value Chain & Distribution Channel Analysis
5 MARKET SEGMENTATION (includes market size in Value in USD and Volume, Forecasts up to 2030 and analysis of growth prospects)
- 5.1 Confectionery Variant
- 5.1.1 Hard Candy
- 5.1.2 Lollipops
- 5.1.3 Mints
- 5.1.4 Pastilles, Gummies, and Jellies
- 5.1.5 Toffees and Nougats
- 5.1.6 Others
- 5.2 Distribution Channel
- 5.2.1 Convenience Store
- 5.2.2 Online Retail Store
- 5.2.3 Supermarket/Hypermarket
- 5.2.4 Others
- 5.3 Country
- 5.3.1 Australia
- 5.3.2 China
- 5.3.3 India
- 5.3.4 Indonesia
- 5.3.5 Japan
- 5.3.6 Malaysia
- 5.3.7 New Zealand
- 5.3.8 South Korea
- 5.3.9 Rest of Asia-Pacific
6 COMPETITIVE LANDSCAPE
- 6.1 Key Strategic Moves
- 6.2 Market Share Analysis
- 6.3 Company Landscape
- 6.4 Company Profiles
- 6.4.1 Ferrero International SA
- 6.4.2 Lotte Corporation
- 6.4.3 Mars Incorporated
- 6.4.4 Meiji Holdings Company Ltd
- 6.4.5 Mondelez International Inc.
- 6.4.6 Morinaga & Co. Ltd
- 6.4.7 Nestle SA
- 6.4.8 Orion Holdings Corporation
- 6.4.9 Perfetti Van Melle BV
- 6.4.10 The Bazooka Companies Inc.
- 6.4.11 The Hershey Company
7 KEY STRATEGIC QUESTIONS FOR CONFECTIONERY CEOS
8 APPENDIX
- 8.1 Global Overview
- 8.1.1 Overview
- 8.1.2 Porter's Five Forces Framework
- 8.1.3 Global Value Chain Analysis
- 8.1.4 Market Dynamics (DROs)
- 8.2 Sources & References
- 8.3 List of Tables & Figures
- 8.4 Primary Insights
- 8.5 Data Pack
- 8.6 Glossary of Terms
- 発行日
- 発行
- Mordor Intelligence
- ページ情報
- 英文 191 Pages
- 納期
- 2~3営業日