
北米の砂糖菓子類:市場シェア分析、産業動向と統計、成長動向予測(2025年~2030年)
North America Sugar Confectionery - Market Share Analysis, Industry Trends & Statistics, Growth Forecasts (2025 - 2030)- 発行日
- ページ情報
- 英文 193 Pages
- 納期
- 2~3営業日
- 商品コード
- 1684013
- カスタマイズ可能 お客様のご希望に応じて、既存データの加工や未掲載情報(例:国別セグメント)の追加などの対応が可能です。詳細はお問い合わせください。
- 適宜更新あり 本レポートは最新情報反映のため適宜更新し、内容構成変更を行う場合があります。ご検討の際はお問い合わせください。
- 翻訳ツール提供対象 PDF対応AI翻訳ツールの無料貸し出しサービスのご利用が可能です
概要
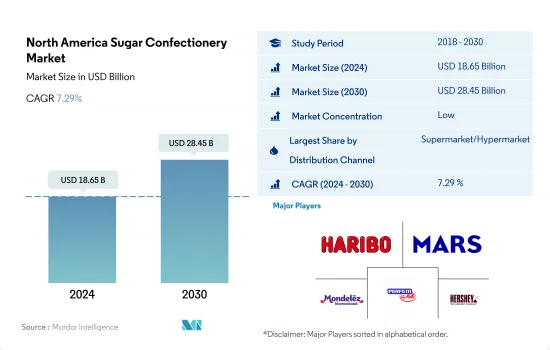
北米の砂糖菓子類市場規模は2024年に186億5,000万米ドルと推定・予測され、2030年には284億5,000万米ドルに達し、予測期間(2024年~2030年)のCAGRは7.29%で成長すると予測されます。
スーパーマーケットと従来型店舗が引き続きこのセグメントで大きな消費者基盤を獲得
- 流通チャネルを通じた砂糖菓子類の販売額は、2022年と比較して2023年には6.26%の成長率を記録し、2022年から2025年にかけてはCAGR 5.98%を記録すると予想されます。これは、スーパーマーケットやその他の伝統的な店舗形態の普及率が高く、百貨店やコンビニエンスストアなどの量販店がそれに続くためです。2021年に米国のオフライン小売店では、チューイーキャンディ、ノベルティ、リコリスボックス/バッグ、スペシャルティナッツ/ココナッツキャンディ、ハードシュガー、プレーンミントなどのチョコレート以外のキャンディが約15億1,100万個販売されました。eコマースと自動販売機の人気の高まりも市場セグメントを推進しています。
- オンライン小売店は、予測期間中にCAGR 7.57%を記録し、最も急成長するセグメントとなりそうです。eコマース分野は、他のどの伝統的な小売チャネルよりも速いペースで成長しています。主なオンライン小売業者は、Walmart、Amazon、Dell、Sears、Staples、Costco、Best Buyです。Walmart、Target、Aldiなどの伝統的な小売業者の多くも、より大きな市場を獲得するためにeコマースの選択肢を提供しています。
- スーパーマーケット/ハイパーマーケットは、商取引外の小売チャネルを通じて砂糖菓子類を最も消費する、最も成長著しいセグメントです。この地域の小売部門は巨大で、米国で最初に確立されたビジネスモデルを採用する国際企業を惹きつけています。スーパーマーケットは同市場で最も好まれる菓子類の購入チャネルであり、2023年には39.03%という大きな金額シェアを占める。スーパーマーケットはアメリカの街角でよく見かける光景であり、人口5,000人以上の町のほとんどにスーパーマーケットがあります。
米国は、この地域全体で甘党の消費者の存在感が強く、砂糖菓子をリードしています。
- 北米の菓子類市場は、2022年には2021年比で6.88%の成長を記録しました。この成長は、地域全体で甘党消費者の量が増加しているためです。より健康的な食事が増加しているにもかかわらず、キャンディーの売上高は長年にわたって好調に推移しています。この地域の消費者は、食後のおやつや間食としてキャンディーやお菓子を習慣的に食生活に取り入れる傾向があります。平均的なアメリカ人は1日に小さじ34杯の砂糖を食べ(飲み)、これは2022年には500キロカロリー以上に相当します。このうち、平均的な人の食事に含まれる砂糖の10%はキャンディーに由来します。
- 米国は最大の成長セグメントであり、2022年の北米砂糖菓子市場で84.76%という大きな金額シェアを占めています。人々がキャンディーを手放すのが難しいことは明らかです。そのルーツは、化学的魅力、習慣(いつもお菓子を食べている)、ノスタルジーにあるのかもしれないです。全米50州のうち、お菓子の消費量ではユタ州がトップで、2022年にはユタ州が米国の「甘いもの首都」となり、アイダホ州、アラスカ州がそれに続きます。アメリカ人の約82%がハロウィーンのお菓子購入の習慣に参加しています。
- 米国はまた、予測期間中にCAGR 5.37%を記録し、最も急成長するチャネルになると予測されています。バレンタインデー、イースター、ハロウィン、その他の祝祭日には、アメリカ人の大多数(80%から90%)が砂糖菓子を購入し、季節菓子の売上と消費を増加させています。そのため、消費者はソーシャルメディアや食料品売り場でインスピレーションを得ようとも、菓子類を一種のセルフケアや楽しみとして受け入れています。
北米の砂糖菓子類の市場動向
魅力的なパッケージと斬新なフレーバーの豊富さが市場の成長を支える
- 地位や年齢に関係なく、誰もがたまにはご馳走を食べたくなるものであるため、砂糖菓子類は社会のあらゆる階層の人々に消費されています。しかし、北米の菓子類は主に子供、ティーンエイジャー、若年層によって消費されています。2022年現在、カナダ人は1人当たり年間約1.3kgの砂糖菓子を消費しています。
- 消費者は、製品の原産地に対する関心の高まりから、全原料を使用したブランドを求めています。消費者は、キャンディー、ミント、グミなどの菓子類に使用されているクリーンなラベルや原材料に注目しています。また、砂糖菓子類の主な購入基準のひとつは、製品の食感です。
- 菓子類の中でも、キャンディーやロリポップなどの砂糖菓子製品はチョコレート製品よりも安価であると考えられています。2023年のキャンディの平均価格は2.23~5.64米ドルでした。2023年3月以降、原材料費は40%増加し、次いで製品の輸送と包装の費用が増加しました。
- 製品のマーケティングと広告は、製品の消費と販売において重要な役割を果たします。免疫力を高める」「ハーブのような」抗酸化作用を宣伝するラベルを貼った製品が頻繁に登場しています。
北米の砂糖菓子類産業の概要
北米の砂糖菓子類市場は細分化されており、上位5社で36.08%を占めています。この市場の主要企業は以下の通り。 HARIBO Holding GmbH & Co. KG, Mars Incorporated, Mondelez International Inc., Perfetti Van Melle BV and The Hershey Company.
その他の特典
- エクセル形式の市場予測(ME)シート
- アナリストによる3ヶ月間のサポート
目次
第1章 エグゼクティブサマリーと主な調査結果
第2章 レポートのオファー
第3章 イントロダクション
- 調査の前提条件と市場定義
- 調査範囲
- 調査手法
第4章 主要産業動向
- 規制の枠組み
- 消費者の購買行動
- 成分分析
- バリューチェーンと流通チャネル分析
第5章 市場セグメンテーション
- 菓子類
- ハードキャンディ
- ロリポップ
- ミント
- パスティル、グミ、ゼリー
- トフィーとヌガー
- その他
- 流通チャネル
- コンビニエンスストア
- オンラインストア
- スーパーマーケット
- その他
- 国名
- カナダ
- メキシコ
- 米国
- その他の北米地域
第6章 競争情勢
- 主要な戦略動向
- 市場シェア分析
- 企業情勢
- 企業プロファイル
- Arcor S.A.I.C
- August Storck KG
- Cloetta AB
- Ferrero International SA
- Frankford Candy LLC
- Ganong Bros. Limited
- HARIBO Holding GmbH & Co. KG
- Laura Secord SEC
- Mars Incorporated
- Mondelez International Inc.
- Nestle SA
- Perfetti Van Melle BV
- The Bazooka Companies Inc.
- The Hershey Company
- Tootsie Roll Industries Inc.
第7章 CEOへの主な戦略的質問CEOへの主な戦略的質問
第8章 付録
- 世界概要
- 概要
- ファイブフォース分析フレームワーク
- 世界・バリューチェーン分析
- 市場力学(DROs)
- 情報源と参考文献
- 図表一覧
- 主要洞察
- データパック
- 用語集
目次
The North America Sugar Confectionery Market size is estimated at 18.65 billion USD in 2024, and is expected to reach 28.45 billion USD by 2030, growing at a CAGR of 7.29% during the forecast period (2024-2030).
Supermarkets and traditional stores continue to capture a larger consumer base in the segment
- The sales value of sugar confectionery through distribution channels registered a growth rate of 6.26% in 2023 compared to 2022, and it is expected to register a CAGR of 5.98% from 2022 to 2025. This is due to the high penetration of supermarkets and other traditional store formats followed by mass merchandise stores such as department stores and convenience stores. Around 1,511 million units of non-chocolate candies like chewy candy, novelty, licorice box/bag, specialty nut/coconut candy, hard sugars, and plain mints were sold in offline retail stores in the United States in 2021. The rising popularity of e-commerce and vending machines also propel the market segment.
- Online retail stores are likely to be the fastest-growing segment by recording a CAGR of 7.57% during the forecast period. The e-commerce sector is growing at a faster pace than any other traditional retail channel. The main online retailers are Walmart, Amazon, Dell, Sears, Staples, Costco, and Best Buy. Many traditional retailers such as Walmart, Target, and Aldi also offer e-commerce alternatives to captivate a larger market.
- Supermarkets/hypermarkets are the largest-growing segment that consumes the most sugar confectionery through off-trade retail channels. The retail sector in the region is huge, attracting international companies to adopt business models that were first established in the United States. Supermarkets are the most preferred channels to purchase sugar confectionery in the market, accounting for a significant value share of 39.03% in 2023. Supermarkets are a common sight on American streets, and most towns with more than 5,000 people have one in their vicinity.
The United States led sugar confections with the strong presence of sweet tooth consumers across the region
- The North American sugar confectionery market observed a growth of 6.88% in 2022 compared to 2021. The growth was due to the rising volume of sweet tooth consumers across the region. Despite the rise in healthier eating, the rise in candies sales has been favorable over the years. Consumers across the region tend to habitually incorporate candy and sweets into their diet as post-meal treats or snacks. The average American ate (or drinks) 34 teaspoons of sugar a day, which was equal to 500+ calories in 2022. Of these, 10% of the sugar in the average person's diet comes from candy.
- The United States is the largest-growing segment, holding a significant value share of 84.76% in 2022 in the North American sugar confectionery market. It is evident that people find it difficult to give up candies. That may have its roots in chemical attraction, habit (always having sweets), and nostalgia. Out of all the 50 states in the United States, Utah leads the United States in the consumption of sweets, making Utah the "sweet tooth capital" of the United States in 2022, followed by Idaho and Alaska. Around 82% of Americans participate in the Halloween candy-buying tradition.
- The United States is also anticipated to be the fastest-growing channel, registering a CAGR of 5.37% during the forecast period. For Valentine's Day, Easter, Halloween, and other holidays, the majority of Americans (between 80% and 90%) purchase sugar confectionery, increasing the sales and consumption of seasonal candies. Hence, consumers embraced confectionery and candies as a kind of self-care and enjoyment, whether they found their inspiration on social media or in the grocery aisle.
North America Sugar Confectionery Market Trends
Attractive packaging formats and the wide availability of innovative flavors support the market's growth
- Since everyone appreciates a treat every so often, regardless of position or age, sugar confectionery is consumed by people from every section of society. However, sugar confectionery in North America is majorly consumed by children, teenagers, and young adults. As of 2022, Canadians consumed around 1.3 kg of sugar confectionery per capita yearly.
- Consumers are seeking out brands that are made with whole ingredients due to a growing interest in the origin of the product. Consumers pay attention to clean labels and ingredients used in confectionery products like candies, mints, and gummies. Also, one of the main purchase criteria for sugar confectionery is the texture of the product.
- Among confectionery, sugar confectionery products like candies and lollipops are considered cheaper than chocolate products. In 2023, the average price of candy ranged between USD 2.23 and USD 5.64. Since March 2023, raw material costs increased by 40%, followed by the costs of transport and packaging of the product.
- Product marketing and advertisement play an important role in the consumption and selling of a product. Products with labels that advertise the "immune-boosting" or "herbal" antioxidant benefits are popping up more frequently.
North America Sugar Confectionery Industry Overview
The North America Sugar Confectionery Market is fragmented, with the top five companies occupying 36.08%. The major players in this market are HARIBO Holding GmbH & Co. KG, Mars Incorporated, Mondelez International Inc., Perfetti Van Melle BV and The Hershey Company (sorted alphabetically).
Additional Benefits:
- The market estimate (ME) sheet in Excel format
- 3 months of analyst support
TABLE OF CONTENTS
1 EXECUTIVE SUMMARY & KEY FINDINGS
2 REPORT OFFERS
3 INTRODUCTION
- 3.1 Study Assumptions & Market Definition
- 3.2 Scope of the Study
- 3.3 Research Methodology
4 KEY INDUSTRY TRENDS
- 4.1 Regulatory Framework
- 4.2 Consumer Buying Behavior
- 4.3 Ingredient Analysis
- 4.4 Value Chain & Distribution Channel Analysis
5 MARKET SEGMENTATION (includes market size in Value in USD and Volume, Forecasts up to 2030 and analysis of growth prospects)
- 5.1 Confectionery Variant
- 5.1.1 Hard Candy
- 5.1.2 Lollipops
- 5.1.3 Mints
- 5.1.4 Pastilles, Gummies, and Jellies
- 5.1.5 Toffees and Nougats
- 5.1.6 Others
- 5.2 Distribution Channel
- 5.2.1 Convenience Store
- 5.2.2 Online Retail Store
- 5.2.3 Supermarket/Hypermarket
- 5.2.4 Others
- 5.3 Country
- 5.3.1 Canada
- 5.3.2 Mexico
- 5.3.3 United States
- 5.3.4 Rest of North America
6 COMPETITIVE LANDSCAPE
- 6.1 Key Strategic Moves
- 6.2 Market Share Analysis
- 6.3 Company Landscape
- 6.4 Company Profiles
- 6.4.1 Arcor S.A.I.C
- 6.4.2 August Storck KG
- 6.4.3 Cloetta AB
- 6.4.4 Ferrero International SA
- 6.4.5 Frankford Candy LLC
- 6.4.6 Ganong Bros. Limited
- 6.4.7 HARIBO Holding GmbH & Co. KG
- 6.4.8 Laura Secord SEC
- 6.4.9 Mars Incorporated
- 6.4.10 Mondelez International Inc.
- 6.4.11 Nestle SA
- 6.4.12 Perfetti Van Melle BV
- 6.4.13 The Bazooka Companies Inc.
- 6.4.14 The Hershey Company
- 6.4.15 Tootsie Roll Industries Inc.
7 KEY STRATEGIC QUESTIONS FOR CONFECTIONERY CEOS
8 APPENDIX
- 8.1 Global Overview
- 8.1.1 Overview
- 8.1.2 Porter's Five Forces Framework
- 8.1.3 Global Value Chain Analysis
- 8.1.4 Market Dynamics (DROs)
- 8.2 Sources & References
- 8.3 List of Tables & Figures
- 8.4 Primary Insights
- 8.5 Data Pack
- 8.6 Glossary of Terms
- 発行日
- 発行
- Mordor Intelligence
- ページ情報
- 英文 193 Pages
- 納期
- 2~3営業日


