
砂糖菓子:市場シェア分析、産業動向・統計、成長予測(2025年~2030年)
Sugar Confectionery - Market Share Analysis, Industry Trends & Statistics, Growth Forecasts (2025 - 2030)- 発行日
- ページ情報
- 英文 348 Pages
- 納期
- 2~3営業日
- 商品コード
- 1684019
- カスタマイズ可能 お客様のご希望に応じて、既存データの加工や未掲載情報(例:国別セグメント)の追加などの対応が可能です。詳細はお問い合わせください。
- 適宜更新あり 本レポートは最新情報反映のため適宜更新し、内容構成変更を行う場合があります。ご検討の際はお問い合わせください。
- 翻訳ツール提供対象 PDF対応AI翻訳ツールの無料貸し出しサービスのご利用が可能です
概要
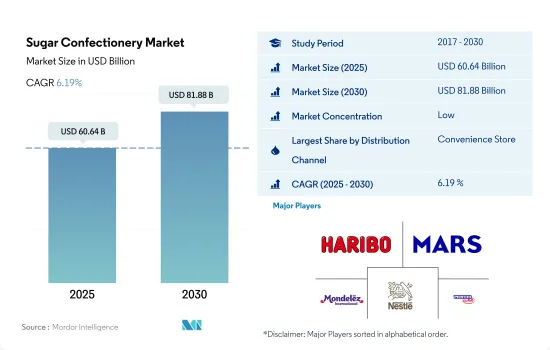
砂糖菓子の市場規模は2025年に606億4,000万米ドルと推定され、2030年には818億8,000万米ドルに達すると予測され、予測期間(2025-2030年)のCAGRは6.19%で成長する見込みです。
オンライン小売は、適時性、利便性、迅速な配達などの利点により、最も急成長しているチャネルとなる可能性が高く、2023~2024年の前年比成長率は6.10%を記録します。
- 砂糖菓子の世界市場における流通チャネルは、2023年には2022年比5.03%の金額成長率を維持しました。この成長は、市場における消費者の便利なショッピングオプションへの嗜好の高まりによってもたらされると予想されます。対面ショッピングへの嗜好の高まり、割引オファーへの需要の高まりなどの要因が、予測期間中に小売業界を大きく押し上げると予想されます。数量ベースでは、世界の小売件数は2023年に4.65%の成長が見込まれます。
- 金額ベースでは、オンライン小売チャネルが急成長する見込みです。このセグメントは、2022年と比較して2023年には37.76%の金額成長率を達成すると予測されました。オンラインストアでは、消費者はプライベートブランドや主流ブランドで販売されている豊富な商品群から商品を選ぶことができます。また、オンライン・チャネルは大量購入割引やクーポン・コードを提供し、潜在的な購入者を引きつけています。
- コンビニエンスストアは世界の砂糖菓子市場で最も成長しているセグメントです。コンビニエンスストアを通じた砂糖菓子の販売額は、前年の2022年と比較して2023年には4.93%の成長率を記録しました。この成長は主に、チョコレート、キャンディー、ガムなどの菓子がレジカウンターに置かれ、消費者の衝動買いを促進しているためです。
- スーパーマーケットは、砂糖菓子が消費されるチャネルの第2位を占めています。2023年には、このセグメントは2022年比で4.64%の金額成長率を記録しました。スーパーマーケットを通じた砂糖菓子の売上が増加しているのは、主に複数のブランドが一堂に揃っているためです。
北米は、甘党の消費者数が増加しており、最大の収益地域です。
- 世界の砂糖菓子市場は、2023年には金額ベースで2022年比4.7%の成長率を記録しました。この成長動向は主に、トフィー、ハードキャンディー、ゼリーのような砂糖菓子を介した便利な一口サイズの間食の採用が増加していること、ケーキ、ミルクセーキ、クロワッサン、ホットシュガーなど、多種多様な飲料・菓子製品の配合に砂糖菓子の使用が増加していることによるもので、これが世界の砂糖菓子市場の成長に寄与しています。
- 北米は最大の地域市場であり、2023年には2022年比5.76%の成長率を達成します。同地域の成長は、同地域全体で甘いものを好む消費者が増加していることに起因すると予想されます。健康志向の高まりにもかかわらず、キャンディーの売上高はここ数年好調に推移しています。この地域の消費者は、食後のおやつや間食としてキャンディーやお菓子を食事に取り入れる習慣があります。2022年、平均的なアメリカ人は1日に小さじ34杯の砂糖を食べ(飲み)、これは500キロカロリー以上に相当します。このうち、平均的な人の食事に含まれる砂糖の10%はキャンディーに由来します。
- アフリカは菓子市場全体で最も急成長している地域であり、予測期間中(2024~2030年)に31.06%の成長率を達成する見込みです。ヌルンジやハチミツ入りキャンディのようなユニークなフレーバーの砂糖菓子が入手可能であることが、アフリカの人々を魅了しています。グミとゼリーのバリエーションは、アフリカの砂糖菓子業界で最大のセグメントと考えられており、2023年のシェアは34%です。消費者は、これらの菓子がユニークな食感、風味、色で入手できることに魅力を感じています。このため、同分野の技術革新が予測期間中の同地域の売上を押し上げる可能性が高いです。
世界の砂糖菓子の動向
衝動買いと視覚的アピールが世界市場の成長に重要な役割を果たす
- 世界中で砂糖菓子が消費される背景には、伝統的な風習、文化的な祝い事、特定の地域の人々の間食などがあります。アジア太平洋では、2022年から2023年にかけて、約78%の消費者が仕事中や旅行中にハードキャンディーを好んで消費しています。
- 製品属性では、消費者はブランドイメージを重視しています。全人口の約70%が、ブランドイメージの良い製品を好みます。パッケージは菓子にとって2番目に重要な製品属性であり、購入の可能性を左右します。
- 2023年には、砂糖菓子の売上高が2022年比で4.5%増加しました。売上の伸びは、ユニークな風味を持つ砂糖菓子に対する消費者密度の高まりと関連しています。砂糖菓子では、消費者が旅行中や勤務時間中に好んで食べることから、2022年にはハード・キャンディがかなりの数量で人気を集めました。
- 製品のマーケティングと広告は、製品の消費と販売において重要な役割を果たしています。免疫力を高める」または「ハーブのような」抗酸化の効能を宣伝するラベルを貼った製品が頻繁に登場しています。砂糖不使用の表示も消費者の関心を集めており、世界市場で新製品を選ぶ際に低糖質の表示を求める消費者は40%を超えています。
砂糖菓子産業の概要
砂糖菓子市場は細分化されており、上位5社で21.49%を占めています。この市場の主要企業は以下の通りです。HARIBO Holding GmbH & Co. KG, Mars Incorporated, Mondelez International Inc., Nestle SA and Perfetti Van Melle BV(sorted alphabetically).
その他の特典
- エクセル形式の市場予測(ME)シート
- 3ヶ月のアナリストサポート
目次
第1章 エグゼクティブサマリーと主な調査結果
第2章 レポートのオファー
第3章 イントロダクション
- 調査の前提条件と市場定義
- 調査範囲
- 調査手法
第4章 主要産業動向
- 規制の枠組み
- 消費者の購買行動
- 成分分析
- バリューチェーンと流通チャネル分析
第5章 市場セグメンテーション
- 菓子種類
- ハードキャンディ
- ロリポップ
- ミント
- パスティル、グミ、ゼリー
- トフィーとヌガー
- その他
- 流通チャネル
- コンビニエンスストア
- オンラインストア
- スーパーマーケット
- その他
- 地域
- アフリカ
- 国別
- エジプト
- ナイジェリア
- 南アフリカ
- その他のアフリカ
- アジア太平洋
- 国別
- オーストラリア
- 中国
- インド
- インドネシア
- 日本
- マレーシア
- ニュージーランド
- 韓国
- その他アジア太平洋地域
- 欧州
- 国別
- ベルギー
- フランス
- ドイツ
- イタリア
- オランダ
- ロシア
- スペイン
- スイス
- トルコ
- 英国
- その他欧州
- 中東
- 国別
- バーレーン
- クウェート
- オマーン
- カタール
- サウジアラビア
- アラブ首長国連邦
- その他中東
- 北米
- 国別
- カナダ
- メキシコ
- 米国
- その他北米地域
- 南米
- 国別
- アルゼンチン
- ブラジル
- その他南米
- アフリカ
第6章 競合情勢
- 主要な戦略動向
- 市場シェア分析
- 企業情勢
- 企業プロファイル
- Arcor S.A.I.C
- August Storck KG
- Cloetta AB
- Ferrero International SA
- HARIBO Holding GmbH & Co. KG
- Mars Incorporated
- Meiji Holdings Company Ltd
- Mondelez International Inc.
- Mount Franklin Foods LLC
- Nestle SA
- Oy Karl Fazer Ab
- Perfetti Van Melle BV
- The Hershey Company
第7章 CEOへの主な戦略的質問
第8章 付録
- 世界概要
- 概要
- ファイブフォース分析フレームワーク
- 世界のバリューチェーン分析
- 市場力学(DROs)
- 情報源と参考文献
- 図表一覧
- 主要洞察
- データパック
- 用語集
目次
The Sugar Confectionery Market size is estimated at 60.64 billion USD in 2025, and is expected to reach 81.88 billion USD by 2030, growing at a CAGR of 6.19% during the forecast period (2025-2030).
Online retail is likely to be the fastest-growing channel owing to benefits like timeliness, convenience, and quick delivery, registering a Y-o-Y growth rate of 6.10% over 2023-2024
- Distribution channels in the global sugar confectionery market maintained a value growth rate of 5.03% in 2023 compared to 2022. The growth is expected to be driven by consumers' increasing preference for convenient shopping options in the market. Factors such as increasing preference for in-person shopping, increasing demand for discount offers, etc., are expected to significantly boost the retail industry during the forecast period. By volume, global retailing units were expected to grow by 4.65% in 2023.
- By value, online retail channels are likely to be the fastest-growing channels. The segment was anticipated to attain a value growth rate of 37.76% in 2023 compared to the year 2022. Online stores allow consumers to select from a large collection of product offerings marketed under private labels as well as mainstream brands. Also, online channels provide bulk purchase discounts and coupon codes to attract potential buyers, which, in turn, influences the online sales of confectionery.
- Convenience stores are the largest-growing segment in the global sugar confectionery market. The sales value of sugar confectionery products through convenience stores registered a growth rate of 4.93% in 2023 compared to the previous year, 2022. The growth is primarily because of the positioning of confectionery products such as chocolates, candies, and gums at the checkout counter, which fuels consumers' impulse buying.
- Supermarkets are the second-leading channel through which sugar confectionery is consumed. In 2023, the segment witnessed a value growth rate of 4.64% compared to 2022. The increasing sugar confectionery sales through supermarkets is primarily because of the extensive availability of several brands under one roof.
North America is the largest revenue-generating region, with its rising volume of consumers with a sweet tooth
- The global sugar confectionery market observed a growth rate of 4.7% by value in 2023 compared to 2022. The growing trend is mainly due to the rising adoption of convenient bite-size snacking via sugar confectionery like toffees, hard candies, and jellies, and the increasing use of sugar confectionery in the formulation of a wide variety of beverage and confectionery products, such as cakes, milkshakes, croissants, and hot sugar, which is contributing to the global sugar confectionery market's growth.
- North America is the largest regional market, attaining a value growth rate of 5.76% in 2023 from 2022. Its growth is anticipated due to the rising volume of consumers with a sweet tooth across the region. Despite the rise in healthier eating, the rise in candy sales has been favorable over the years. Consumers across the region tend to have a habit of incorporating candy and sweets into their diet as post-meal treats or snacks. In 2022, the average American ate (or drank) 34 teaspoons of sugar a day, equal to 500+ calories. Out of this, 10% of the sugar in the average person's diet comes from candy.
- Africa is the fastest-growing region in the overall sugar confectionery market and is likely to attain a value growth rate of 31.06% during the forecast period (2024-2030). The availability of sugar confections in unique flavors, such as Nurungji and Honey-Filled Candy, is attracting the African population. The gummies and jellies variant is considered the largest segment in the sugar-confectionery industry in Africa, with a 34% share in 2023. Consumers are attracted by the availability of these confections in unique textures, flavors, and colors. Thus, the innovations in the segment are likely to boost the region's sales during the forecast period.
Global Sugar Confectionery Market Trends
Impulse buying and visual appeal play a significant role in the growth of the market worldwide
- Sugar confectionery consumption around the globe is attributed to factors like traditional customs, cultural celebrations, and regular snacking among the population in particular regions. In Asia-Pacific, about 78% of consumers preferred consuming hard candies during their work and traveling period in 2022-2023.
- Under product attributes, consumers are significantly focusing on brand image. Around 70% of the total population prefers products that come with a good brand image. Packaging is considered the second most important product attribute for confectionery products, which determines the likelihood of their purchasing.
- In 2023, sugar confections witnessed a hike in their sales by 4.5% compared to 2022. The sales growth was linked to the growing consumer density for sugar confectionery with unique flavors. Under sugar confectionery, hard candy gained a significant volume of popularity in 2022 as consumers preferred them during traveling and working hours.
- Product marketing and advertisement play important roles in the consumption and selling of products. Products with labels that advertise the "immune-boosting" or "herbal" anti-oxidant benefits are being introduced more frequently. Sugar-free claims are also attracting consumer interest, with more than 40% of consumers looking for low-sugar claims when choosing new products in the global market.
Sugar Confectionery Industry Overview
The Sugar Confectionery Market is fragmented, with the top five companies occupying 21.49%. The major players in this market are HARIBO Holding GmbH & Co. KG, Mars Incorporated, Mondelez International Inc., Nestle SA and Perfetti Van Melle BV (sorted alphabetically).
Additional Benefits:
- The market estimate (ME) sheet in Excel format
- 3 months of analyst support
TABLE OF CONTENTS
1 EXECUTIVE SUMMARY & KEY FINDINGS
2 REPORT OFFERS
3 INTRODUCTION
- 3.1 Study Assumptions & Market Definition
- 3.2 Scope of the Study
- 3.3 Research Methodology
4 KEY INDUSTRY TRENDS
- 4.1 Regulatory Framework
- 4.2 Consumer Buying Behavior
- 4.3 Ingredient Analysis
- 4.4 Value Chain & Distribution Channel Analysis
5 MARKET SEGMENTATION (includes market size in Value in USD and Volume, Forecasts up to 2030 and analysis of growth prospects)
- 5.1 Confectionery Variant
- 5.1.1 Hard Candy
- 5.1.2 Lollipops
- 5.1.3 Mints
- 5.1.4 Pastilles, Gummies, and Jellies
- 5.1.5 Toffees and Nougats
- 5.1.6 Others
- 5.2 Distribution Channel
- 5.2.1 Convenience Store
- 5.2.2 Online Retail Store
- 5.2.3 Supermarket/Hypermarket
- 5.2.4 Others
- 5.3 Region
- 5.3.1 Africa
- 5.3.1.1 By Country
- 5.3.1.1.1 Egypt
- 5.3.1.1.2 Nigeria
- 5.3.1.1.3 South Africa
- 5.3.1.1.4 Rest of Africa
- 5.3.2 Asia-Pacific
- 5.3.2.1 By Country
- 5.3.2.1.1 Australia
- 5.3.2.1.2 China
- 5.3.2.1.3 India
- 5.3.2.1.4 Indonesia
- 5.3.2.1.5 Japan
- 5.3.2.1.6 Malaysia
- 5.3.2.1.7 New Zealand
- 5.3.2.1.8 South Korea
- 5.3.2.1.9 Rest of Asia-Pacific
- 5.3.3 Europe
- 5.3.3.1 By Country
- 5.3.3.1.1 Belgium
- 5.3.3.1.2 France
- 5.3.3.1.3 Germany
- 5.3.3.1.4 Italy
- 5.3.3.1.5 Netherlands
- 5.3.3.1.6 Russia
- 5.3.3.1.7 Spain
- 5.3.3.1.8 Switzerland
- 5.3.3.1.9 Turkey
- 5.3.3.1.10 United Kingdom
- 5.3.3.1.11 Rest of Europe
- 5.3.4 Middle East
- 5.3.4.1 By Country
- 5.3.4.1.1 Bahrain
- 5.3.4.1.2 Kuwait
- 5.3.4.1.3 Oman
- 5.3.4.1.4 Qatar
- 5.3.4.1.5 Saudi Arabia
- 5.3.4.1.6 United Arab Emirates
- 5.3.4.1.7 Rest of Middle East
- 5.3.5 North America
- 5.3.5.1 By Country
- 5.3.5.1.1 Canada
- 5.3.5.1.2 Mexico
- 5.3.5.1.3 United States
- 5.3.5.1.4 Rest of North America
- 5.3.6 South America
- 5.3.6.1 By Country
- 5.3.6.1.1 Argentina
- 5.3.6.1.2 Brazil
- 5.3.6.1.3 Rest of South America
- 5.3.1 Africa
6 COMPETITIVE LANDSCAPE
- 6.1 Key Strategic Moves
- 6.2 Market Share Analysis
- 6.3 Company Landscape
- 6.4 Company Profiles
- 6.4.1 Arcor S.A.I.C
- 6.4.2 August Storck KG
- 6.4.3 Cloetta AB
- 6.4.4 Ferrero International SA
- 6.4.5 HARIBO Holding GmbH & Co. KG
- 6.4.6 Mars Incorporated
- 6.4.7 Meiji Holdings Company Ltd
- 6.4.8 Mondelez International Inc.
- 6.4.9 Mount Franklin Foods LLC
- 6.4.10 Nestle SA
- 6.4.11 Oy Karl Fazer Ab
- 6.4.12 Perfetti Van Melle BV
- 6.4.13 The Hershey Company
7 KEY STRATEGIC QUESTIONS FOR CONFECTIONERY CEOS
8 APPENDIX
- 8.1 Global Overview
- 8.1.1 Overview
- 8.1.2 Porter's Five Forces Framework
- 8.1.3 Global Value Chain Analysis
- 8.1.4 Market Dynamics (DROs)
- 8.2 Sources & References
- 8.3 List of Tables & Figures
- 8.4 Primary Insights
- 8.5 Data Pack
- 8.6 Glossary of Terms
- 発行日
- 発行
- Mordor Intelligence
- ページ情報
- 英文 348 Pages
- 納期
- 2~3営業日


