|
|
市場調査レポート
商品コード
1557489
ポテトプロテインの世界市場 2024-2028Global Potato Protein Market 2024-2028 |
||||||

|
|||||||
カスタマイズ可能
|
|||||||

| ポテトプロテインの世界市場 2024-2028 |
|
出版日: 2024年08月15日
発行: TechNavio
ページ情報: 英文 158 Pages
納期: 即納可能
|

全表示
- 概要
- 図表
- 目次
ポテトプロテイン市場は2023-2028年に5,260万米ドル、予測期間中のCAGRは8.08%で成長すると予測されます。
当レポートでは、ポテトプロテイン市場の全体的な分析、市場規模・予測、動向、成長促進要因、課題、約25のベンダーを網羅したベンダー分析などを掲載しています。
現在の市場シナリオ、最新動向と促進要因、市場環境全体に関する最新分析を提供しています。市場は、プロテインパウダーの需要拡大、ポテトプロテインの健康効果に関する意識の高まり、スポーツやフィットネス活動への関心の高まりによって牽引されています。
| 市場範囲 | |
|---|---|
| 基準年 | 2024 |
| 終了年 | 2028 |
| 予測期間 | 2024-2028 |
| 成長モメンタム | 加速 |
| 前年比2024年 | 7.31% |
| CAGR | 8.08% |
| 増分額 | 5,260万米ドル |
本調査では、今後数年間のポテトプロテイン市場の成長を促進する主な要因の1つとして、販売におけるeコマースプラットフォームの人気の高まりを挙げています。また、パッケージングへの注力や栄養補助食品の動向の高まりも、市場の大きな需要につながると思われます。
目次
第1章 エグゼクティブサマリー
- 市場概要
第2章 市場情勢
- 市場エコシステム
- 市場の特徴
- バリューチェーン分析
第3章 市場規模の評価
- 市場の定義
- 市場セグメント分析
- 市場規模 2023
- 市場の見通し 2023-2028
第4章 市場規模実績
- ポテトプロテインの世界市場 2018-2022
- タイプ別セグメント分析 2018-2022
- 用途別セグメント分析 2018-2022
- 地域別セグメント分析 2018-2022
- 国別セグメント分析 2018-2022
第5章 ファイブフォース分析
- ファイブフォースの要約
- 買い手の交渉力
- 供給企業の交渉力
- 新規参入業者の脅威
- 代替品の脅威
- 競争の脅威
- 市況
第6章 市場セグメンテーション:タイプ別
- 市場セグメンテーション
- 比較:タイプ別
- 高純度:市場規模と予測 2023-2028
- 濃縮:市場規模と予測 2023-2028
- 加水分解:市場規模と予測 2023-2028
- 市場機会:タイプ別
第7章 市場セグメンテーション:用途別
- 市場セグメンテーション
- 比較:用途別
- 肉:市場規模と予測 2023-2028
- サプリメント:市場規模と予測 2023-2028
- 動物飼料:市場規模と予測 2023-2028
- その他:市場規模と予測 2023-2028
- 市場機会:用途別
第8章 顧客情勢
- 顧客情勢の概要
第9章 地域別情勢
- 地域別セグメンテーション
- 地域別比較
- 北米:市場規模と予測 2023-2028
- 欧州:市場規模と予測 2023-2028
- アジア太平洋:市場規模と予測 2023-2028
- 南米:市場規模と予測 2023-2028
- 中東・アフリカ:市場規模と予測 2023-2028
- 米国:市場規模と予測 2023-2028
- フランス:市場規模と予測 2023-2028
- 中国:市場規模と予測 2023-2028
- イタリア:市場規模と予測 2023-2028
- オーストラリア:市場規模と予測 2023-2028
- 市場機会:地域情勢別
第10章 促進要因・課題・機会・抑制要因
- 市場促進要因
- 市場の課題
- 促進要因と課題の影響
- 市場の機会・抑制要因
第11章 競合情勢
- 概要
- 競合情勢
- 混乱の状況
- 業界のリスク
第12章 競合分析
- 企業プロファイル
- 企業の市場ポジショニング
- AGRANA Beteiligungs AG
- AMINOLA BV
- Bioriginal Food and Science Corp.
- Royal Avebe
- Cooperatie Koninklijke Cosun UA
- Emsland Starke GmbH
- Food Innovation Online Corp.
- Kerry Group Plc
- KMC amba
- Lyckeby Starch AB
- Meelunie BV
- PEPEES SA
- PPZ SA
- Roquette Freres SA
- Tereos Participations
第13章 付録
Exhibits:
- Exhibits1: Executive Summary - Chart on Market Overview
- Exhibits2: Executive Summary - Data Table on Market Overview
- Exhibits3: Executive Summary - Chart on Global Market Characteristics
- Exhibits4: Executive Summary - Chart on Market By Geographical Landscape
- Exhibits5: Executive Summary - Chart on Market Segmentation by Type
- Exhibits6: Executive Summary - Chart on Market Segmentation by Application
- Exhibits7: Executive Summary - Chart on Incremental Growth
- Exhibits8: Executive Summary - Data Table on Incremental Growth
- Exhibits9: Executive Summary - Chart on Company Market Positioning
- Exhibits10: Parent Market
- Exhibits11: Data Table on - Parent Market
- Exhibits12: Market characteristics analysis
- Exhibits13: Value Chain Analysis
- Exhibits14: Offerings of companies included in the market definition
- Exhibits15: Market segments
- Exhibits16: Chart on Global - Market size and forecast 2023-2028 ($ million)
- Exhibits17: Data Table on Global - Market size and forecast 2023-2028 ($ million)
- Exhibits18: Chart on Global Market: Year-over-year growth 2023-2028 (%)
- Exhibits19: Data Table on Global Market: Year-over-year growth 2023-2028 (%)
- Exhibits20: Historic Market Size - Data Table on Global Potato Protein Market 2018 - 2022 ($ million)
- Exhibits21: Historic Market Size - Type Segment 2018 - 2022 ($ million)
- Exhibits22: Historic Market Size - Application Segment 2018 - 2022 ($ million)
- Exhibits23: Historic Market Size - Geography Segment 2018 - 2022 ($ million)
- Exhibits24: Historic Market Size - Country Segment 2018 - 2022 ($ million)
- Exhibits25: Five forces analysis - Comparison between 2023 and 2028
- Exhibits26: Bargaining power of buyers - Impact of key factors 2023 and 2028
- Exhibits27: Bargaining power of suppliers - Impact of key factors in 2023 and 2028
- Exhibits28: Threat of new entrants - Impact of key factors in 2023 and 2028
- Exhibits29: Threat of substitutes - Impact of key factors in 2023 and 2028
- Exhibits30: Threat of rivalry - Impact of key factors in 2023 and 2028
- Exhibits31: Chart on Market condition - Five forces 2023 and 2028
- Exhibits32: Chart on Type - Market share 2023-2028 (%)
- Exhibits33: Data Table on Type - Market share 2023-2028 (%)
- Exhibits34: Chart on Comparison by Type
- Exhibits35: Data Table on Comparison by Type
- Exhibits36: Chart on Isolate - Market size and forecast 2023-2028 ($ million)
- Exhibits37: Data Table on Isolate - Market size and forecast 2023-2028 ($ million)
- Exhibits38: Chart on Isolate - Year-over-year growth 2023-2028 (%)
- Exhibits39: Data Table on Isolate - Year-over-year growth 2023-2028 (%)
- Exhibits40: Chart on Concentrate - Market size and forecast 2023-2028 ($ million)
- Exhibits41: Data Table on Concentrate - Market size and forecast 2023-2028 ($ million)
- Exhibits42: Chart on Concentrate - Year-over-year growth 2023-2028 (%)
- Exhibits43: Data Table on Concentrate - Year-over-year growth 2023-2028 (%)
- Exhibits44: Chart on Hydrolyzed - Market size and forecast 2023-2028 ($ million)
- Exhibits45: Data Table on Hydrolyzed - Market size and forecast 2023-2028 ($ million)
- Exhibits46: Chart on Hydrolyzed - Year-over-year growth 2023-2028 (%)
- Exhibits47: Data Table on Hydrolyzed - Year-over-year growth 2023-2028 (%)
- Exhibits48: Market opportunity by Type ($ million)
- Exhibits49: Data Table on Market opportunity by Type ($ million)
- Exhibits50: Chart on Application - Market share 2023-2028 (%)
- Exhibits51: Data Table on Application - Market share 2023-2028 (%)
- Exhibits52: Chart on Comparison by Application
- Exhibits53: Data Table on Comparison by Application
- Exhibits54: Chart on Meat - Market size and forecast 2023-2028 ($ million)
- Exhibits55: Data Table on Meat - Market size and forecast 2023-2028 ($ million)
- Exhibits56: Chart on Meat - Year-over-year growth 2023-2028 (%)
- Exhibits57: Data Table on Meat - Year-over-year growth 2023-2028 (%)
- Exhibits58: Chart on Supplements - Market size and forecast 2023-2028 ($ million)
- Exhibits59: Data Table on Supplements - Market size and forecast 2023-2028 ($ million)
- Exhibits60: Chart on Supplements - Year-over-year growth 2023-2028 (%)
- Exhibits61: Data Table on Supplements - Year-over-year growth 2023-2028 (%)
- Exhibits62: Chart on Animal feed - Market size and forecast 2023-2028 ($ million)
- Exhibits63: Data Table on Animal feed - Market size and forecast 2023-2028 ($ million)
- Exhibits64: Chart on Animal feed - Year-over-year growth 2023-2028 (%)
- Exhibits65: Data Table on Animal feed - Year-over-year growth 2023-2028 (%)
- Exhibits66: Chart on Others - Market size and forecast 2023-2028 ($ million)
- Exhibits67: Data Table on Others - Market size and forecast 2023-2028 ($ million)
- Exhibits68: Chart on Others - Year-over-year growth 2023-2028 (%)
- Exhibits69: Data Table on Others - Year-over-year growth 2023-2028 (%)
- Exhibits70: Market opportunity by Application ($ million)
- Exhibits71: Data Table on Market opportunity by Application ($ million)
- Exhibits72: Analysis of price sensitivity, lifecycle, customer purchase basket, adoption rates, and purchase criteria
- Exhibits73: Chart on Market share By Geographical Landscape 2023-2028 (%)
- Exhibits74: Data Table on Market share By Geographical Landscape 2023-2028 (%)
- Exhibits75: Chart on Geographic comparison
- Exhibits76: Data Table on Geographic comparison
- Exhibits77: Chart on North America - Market size and forecast 2023-2028 ($ million)
- Exhibits78: Data Table on North America - Market size and forecast 2023-2028 ($ million)
- Exhibits79: Chart on North America - Year-over-year growth 2023-2028 (%)
- Exhibits80: Data Table on North America - Year-over-year growth 2023-2028 (%)
- Exhibits81: Chart on Europe - Market size and forecast 2023-2028 ($ million)
- Exhibits82: Data Table on Europe - Market size and forecast 2023-2028 ($ million)
- Exhibits83: Chart on Europe - Year-over-year growth 2023-2028 (%)
- Exhibits84: Data Table on Europe - Year-over-year growth 2023-2028 (%)
- Exhibits85: Chart on APAC - Market size and forecast 2023-2028 ($ million)
- Exhibits86: Data Table on APAC - Market size and forecast 2023-2028 ($ million)
- Exhibits87: Chart on APAC - Year-over-year growth 2023-2028 (%)
- Exhibits88: Data Table on APAC - Year-over-year growth 2023-2028 (%)
- Exhibits89: Chart on South America - Market size and forecast 2023-2028 ($ million)
- Exhibits90: Data Table on South America - Market size and forecast 2023-2028 ($ million)
- Exhibits91: Chart on South America - Year-over-year growth 2023-2028 (%)
- Exhibits92: Data Table on South America - Year-over-year growth 2023-2028 (%)
- Exhibits93: Chart on Middle East and Africa - Market size and forecast 2023-2028 ($ million)
- Exhibits94: Data Table on Middle East and Africa - Market size and forecast 2023-2028 ($ million)
- Exhibits95: Chart on Middle East and Africa - Year-over-year growth 2023-2028 (%)
- Exhibits96: Data Table on Middle East and Africa - Year-over-year growth 2023-2028 (%)
- Exhibits97: Chart on US - Market size and forecast 2023-2028 ($ million)
- Exhibits98: Data Table on US - Market size and forecast 2023-2028 ($ million)
- Exhibits99: Chart on US - Year-over-year growth 2023-2028 (%)
- Exhibits100: Data Table on US - Year-over-year growth 2023-2028 (%)
- Exhibits101: Chart on France - Market size and forecast 2023-2028 ($ million)
- Exhibits102: Data Table on France - Market size and forecast 2023-2028 ($ million)
- Exhibits103: Chart on France - Year-over-year growth 2023-2028 (%)
- Exhibits104: Data Table on France - Year-over-year growth 2023-2028 (%)
- Exhibits105: Chart on China - Market size and forecast 2023-2028 ($ million)
- Exhibits106: Data Table on China - Market size and forecast 2023-2028 ($ million)
- Exhibits107: Chart on China - Year-over-year growth 2023-2028 (%)
- Exhibits108: Data Table on China - Year-over-year growth 2023-2028 (%)
- Exhibits109: Chart on Italy - Market size and forecast 2023-2028 ($ million)
- Exhibits110: Data Table on Italy - Market size and forecast 2023-2028 ($ million)
- Exhibits111: Chart on Italy - Year-over-year growth 2023-2028 (%)
- Exhibits112: Data Table on Italy - Year-over-year growth 2023-2028 (%)
- Exhibits113: Chart on Australia - Market size and forecast 2023-2028 ($ million)
- Exhibits114: Data Table on Australia - Market size and forecast 2023-2028 ($ million)
- Exhibits115: Chart on Australia - Year-over-year growth 2023-2028 (%)
- Exhibits116: Data Table on Australia - Year-over-year growth 2023-2028 (%)
- Exhibits117: Market opportunity By Geographical Landscape ($ million)
- Exhibits118: Data Tables on Market opportunity By Geographical Landscape ($ million)
- Exhibits119: Impact of drivers and challenges in 2023 and 2028
- Exhibits120: Overview on criticality of inputs and factors of differentiation
- Exhibits121: Overview on factors of disruption
- Exhibits122: Impact of key risks on business
- Exhibits123: Companies covered
- Exhibits124: Matrix on companies position and classification
- Exhibits125: AGRANA Beteiligungs AG - Overview
- Exhibits126: AGRANA Beteiligungs AG - Business segments
- Exhibits127: AGRANA Beteiligungs AG - Key news
- Exhibits128: AGRANA Beteiligungs AG - Key offerings
- Exhibits129: AGRANA Beteiligungs AG - Segment focus
- Exhibits130: AMINOLA BV - Overview
- Exhibits131: AMINOLA BV - Product / Service
- Exhibits132: AMINOLA BV - Key offerings
- Exhibits133: Bioriginal Food and Science Corp. - Overview
- Exhibits134: Bioriginal Food and Science Corp. - Product / Service
- Exhibits135: Bioriginal Food and Science Corp. - Key offerings
- Exhibits136: Royal Avebe - Overview
- Exhibits137: Royal Avebe - Product / Service
- Exhibits138: Royal Avebe - Key news
- Exhibits139: Royal Avebe - Key offerings
- Exhibits140: Cooperatie Koninklijke Cosun UA - Overview
- Exhibits141: Cooperatie Koninklijke Cosun UA - Product / Service
- Exhibits142: Cooperatie Koninklijke Cosun UA - Key offerings
- Exhibits143: Emsland Starke GmbH - Overview
- Exhibits144: Emsland Starke GmbH - Product / Service
- Exhibits145: Emsland Starke GmbH - Key news
- Exhibits146: Emsland Starke GmbH - Key offerings
- Exhibits147: Food Innovation Online Corp. - Overview
- Exhibits148: Food Innovation Online Corp. - Product / Service
- Exhibits149: Food Innovation Online Corp. - Key offerings
- Exhibits150: Kerry Group Plc - Overview
- Exhibits151: Kerry Group Plc - Business segments
- Exhibits152: Kerry Group Plc - Key news
- Exhibits153: Kerry Group Plc - Key offerings
- Exhibits154: Kerry Group Plc - Segment focus
- Exhibits155: KMC amba - Overview
- Exhibits156: KMC amba - Product / Service
- Exhibits157: KMC amba - Key offerings
- Exhibits158: Lyckeby Starch AB - Overview
- Exhibits159: Lyckeby Starch AB - Product / Service
- Exhibits160: Lyckeby Starch AB - Key offerings
- Exhibits161: Meelunie BV - Overview
- Exhibits162: Meelunie BV - Product / Service
- Exhibits163: Meelunie BV - Key offerings
- Exhibits164: PEPEES SA - Overview
- Exhibits165: PEPEES SA - Business segments
- Exhibits166: PEPEES SA - Key offerings
- Exhibits167: PEPEES SA - Segment focus
- Exhibits168: PPZ SA - Overview
- Exhibits169: PPZ SA - Product / Service
- Exhibits170: PPZ SA - Key offerings
- Exhibits171: Roquette Freres SA - Overview
- Exhibits172: Roquette Freres SA - Product / Service
- Exhibits173: Roquette Freres SA - Key offerings
- Exhibits174: Tereos Participations - Overview
- Exhibits175: Tereos Participations - Product / Service
- Exhibits176: Tereos Participations - Key offerings
- Exhibits177: Inclusions checklist
- Exhibits178: Exclusions checklist
- Exhibits179: Currency conversion rates for US$
- Exhibits180: Research methodology
- Exhibits181: Information sources
- Exhibits182: Data validation
- Exhibits183: Validation techniques employed for market sizing
- Exhibits184: Data synthesis
- Exhibits185: 360 degree market analysis
- Exhibits186: List of abbreviations
The potato protein market is forecasted to grow by USD 52.6 mn during 2023-2028, accelerating at a CAGR of 8.08% during the forecast period. The report on the potato protein market provides a holistic analysis, market size and forecast, trends, growth drivers, and challenges, as well as vendor analysis covering around 25 vendors.
The report offers an up-to-date analysis regarding the current market scenario, the latest trends and drivers, and the overall market environment. The market is driven by growing demand for protein powders, increasing awareness about health benefits of potato protein, and growing interest in sports and fitness activities.
Technavio's potato protein market is segmented as below:
| Market Scope | |
|---|---|
| Base Year | 2024 |
| End Year | 2028 |
| Series Year | 2024-2028 |
| Growth Momentum | Accelerate |
| YOY 2024 | 7.31% |
| CAGR | 8.08% |
| Incremental Value | $52.6 mn |
By Type
- Isolate
- Concentrate
- Hydrolyzed
By Application
- Meat
- Supplements
- Animal feed
- Others
By Geographical Landscape
- North America
- Europe
- APAC
- South America
- Middle East and Africa
This study identifies the increasing popularity of e-commerce platforms for sales as one of the prime reasons driving the potato protein market growth during the next few years. Also, focus on packaging and rising trend of dietary supplements will lead to sizable demand in the market.
The report on the potato protein market covers the following areas:
- Potato protein market sizing
- Potato protein market forecast
- Potato protein market industry analysis
The robust vendor analysis is designed to help clients improve their market position, and in line with this, this report provides a detailed analysis of several leading potato protein market vendors that include AGRANA Beteiligungs AG, AMINOLA BV, Bioriginal Food and Science Corp., Royal Avebe, Cooperatie Koninklijke Cosun UA, Emsland Starke GmbH, Food Innovation Online Corp., Free From That, Kerry Group Plc, KMC amba, Lyckeby Starch AB, Meelunie BV, Omega Protein Corp., PEPEES SA, PPZ SA, Roquette Freres SA, SUDSTARKE GmbH, and Tereos Participations. Also, the potato protein market analysis report includes information on upcoming trends and challenges that will influence market growth. This is to help companies strategize and leverage all forthcoming growth opportunities.
The study was conducted using an objective combination of primary and secondary information including inputs from key participants in the industry. The report contains a comprehensive market and vendor landscape in addition to an analysis of the key vendors.
The publisher presents a detailed picture of the market by the way of study, synthesis, and summation of data from multiple sources by an analysis of key parameters such as profit, pricing, competition, and promotions. It presents various market facets by identifying the key industry influencers. The data presented is comprehensive, reliable, and a result of extensive research - both primary and secondary. The market research reports provide a complete competitive landscape and an in-depth vendor selection methodology and analysis using qualitative and quantitative research to forecast the accurate market growth.
Table of Contents
1 Executive Summary
- 1.1 Market overview
- Executive Summary - Chart on Market Overview
- Executive Summary - Data Table on Market Overview
- Executive Summary - Chart on Global Market Characteristics
- Executive Summary - Chart on Market By Geographical Landscape
- Executive Summary - Chart on Market Segmentation by Type
- Executive Summary - Chart on Market Segmentation by Application
- Executive Summary - Chart on Incremental Growth
- Executive Summary - Data Table on Incremental Growth
- Executive Summary - Chart on Company Market Positioning
2 Market Landscape
- 2.1 Market ecosystem
- Parent Market
- Data Table on - Parent Market
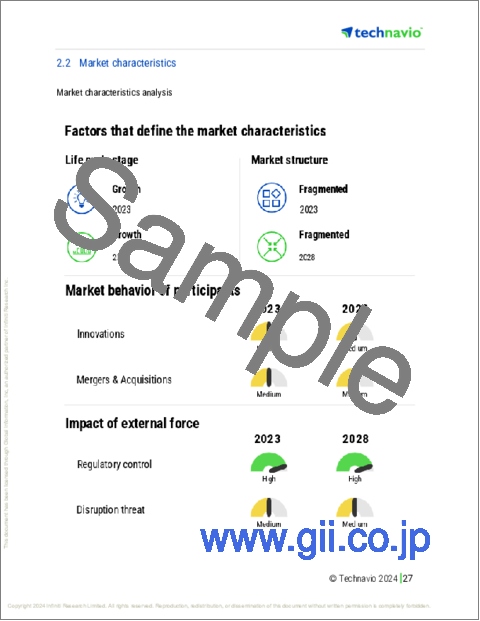
- 2.2 Market characteristics
- Market characteristics analysis
- 2.3 Value chain analysis
- Value Chain Analysis
3 Market Sizing
- 3.1 Market definition
- Offerings of companies included in the market definition
- 3.2 Market segment analysis
- Market segments
- 3.3 Market size 2023
- 3.4 Market outlook: Forecast for 2023-2028
- Chart on Global - Market size and forecast 2023-2028 ($ million)
- Data Table on Global - Market size and forecast 2023-2028 ($ million)
- Chart on Global Market: Year-over-year growth 2023-2028 (%)
- Data Table on Global Market: Year-over-year growth 2023-2028 (%)
4 Historic Market Size
- 4.1 Global Potato Protein Market 2018 - 2022
- Historic Market Size - Data Table on Global Potato Protein Market 2018 - 2022 ($ million)
- 4.2 Type segment analysis 2018 - 2022
- Historic Market Size - Type Segment 2018 - 2022 ($ million)
- 4.3 Application segment analysis 2018 - 2022
- Historic Market Size - Application Segment 2018 - 2022 ($ million)
- 4.4 Geography segment analysis 2018 - 2022
- Historic Market Size - Geography Segment 2018 - 2022 ($ million)
- 4.5 Country segment analysis 2018 - 2022
- Historic Market Size - Country Segment 2018 - 2022 ($ million)
5 Five Forces Analysis
- 5.1 Five forces summary
- Five forces analysis - Comparison between 2023 and 2028
- 5.2 Bargaining power of buyers
- Bargaining power of buyers - Impact of key factors 2023 and 2028
- 5.3 Bargaining power of suppliers
- Bargaining power of suppliers - Impact of key factors in 2023 and 2028
- 5.4 Threat of new entrants
- Threat of new entrants - Impact of key factors in 2023 and 2028
- 5.5 Threat of substitutes
- Threat of substitutes - Impact of key factors in 2023 and 2028
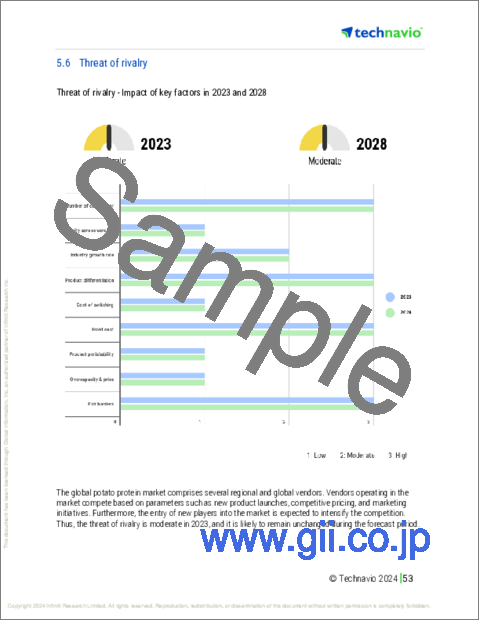
- 5.6 Threat of rivalry
- Threat of rivalry - Impact of key factors in 2023 and 2028
- 5.7 Market condition
- Chart on Market condition - Five forces 2023 and 2028
6 Market Segmentation by Type
- 6.1 Market segments
- Chart on Type - Market share 2023-2028 (%)
- Data Table on Type - Market share 2023-2028 (%)
- 6.2 Comparison by Type
- Chart on Comparison by Type
- Data Table on Comparison by Type
- 6.3 Isolate - Market size and forecast 2023-2028
- Chart on Isolate - Market size and forecast 2023-2028 ($ million)
- Data Table on Isolate - Market size and forecast 2023-2028 ($ million)
- Chart on Isolate - Year-over-year growth 2023-2028 (%)
- Data Table on Isolate - Year-over-year growth 2023-2028 (%)
- 6.4 Concentrate - Market size and forecast 2023-2028
- Chart on Concentrate - Market size and forecast 2023-2028 ($ million)
- Data Table on Concentrate - Market size and forecast 2023-2028 ($ million)
- Chart on Concentrate - Year-over-year growth 2023-2028 (%)
- Data Table on Concentrate - Year-over-year growth 2023-2028 (%)
- 6.5 Hydrolyzed - Market size and forecast 2023-2028
- Chart on Hydrolyzed - Market size and forecast 2023-2028 ($ million)
- Data Table on Hydrolyzed - Market size and forecast 2023-2028 ($ million)
- Chart on Hydrolyzed - Year-over-year growth 2023-2028 (%)
- Data Table on Hydrolyzed - Year-over-year growth 2023-2028 (%)
- 6.6 Market opportunity by Type
- Market opportunity by Type ($ million)
- Data Table on Market opportunity by Type ($ million)
7 Market Segmentation by Application
- 7.1 Market segments
- Chart on Application - Market share 2023-2028 (%)
- Data Table on Application - Market share 2023-2028 (%)
- 7.2 Comparison by Application
- Chart on Comparison by Application
- Data Table on Comparison by Application
- 7.3 Meat - Market size and forecast 2023-2028
- Chart on Meat - Market size and forecast 2023-2028 ($ million)
- Data Table on Meat - Market size and forecast 2023-2028 ($ million)
- Chart on Meat - Year-over-year growth 2023-2028 (%)
- Data Table on Meat - Year-over-year growth 2023-2028 (%)
- 7.4 Supplements - Market size and forecast 2023-2028
- Chart on Supplements - Market size and forecast 2023-2028 ($ million)
- Data Table on Supplements - Market size and forecast 2023-2028 ($ million)
- Chart on Supplements - Year-over-year growth 2023-2028 (%)
- Data Table on Supplements - Year-over-year growth 2023-2028 (%)
- 7.5 Animal feed - Market size and forecast 2023-2028
- Chart on Animal feed - Market size and forecast 2023-2028 ($ million)
- Data Table on Animal feed - Market size and forecast 2023-2028 ($ million)
- Chart on Animal feed - Year-over-year growth 2023-2028 (%)
- Data Table on Animal feed - Year-over-year growth 2023-2028 (%)
- 7.6 Others - Market size and forecast 2023-2028
- Chart on Others - Market size and forecast 2023-2028 ($ million)
- Data Table on Others - Market size and forecast 2023-2028 ($ million)
- Chart on Others - Year-over-year growth 2023-2028 (%)
- Data Table on Others - Year-over-year growth 2023-2028 (%)
- 7.7 Market opportunity by Application
- Market opportunity by Application ($ million)
- Data Table on Market opportunity by Application ($ million)
8 Customer Landscape
- 8.1 Customer landscape overview
- Analysis of price sensitivity, lifecycle, customer purchase basket, adoption rates, and purchase criteria
9 Geographic Landscape
- 9.1 Geographic segmentation
- Chart on Market share By Geographical Landscape 2023-2028 (%)
- Data Table on Market share By Geographical Landscape 2023-2028 (%)
- 9.2 Geographic comparison
- Chart on Geographic comparison
- Data Table on Geographic comparison
- 9.3 North America - Market size and forecast 2023-2028
- Chart on North America - Market size and forecast 2023-2028 ($ million)
- Data Table on North America - Market size and forecast 2023-2028 ($ million)
- Chart on North America - Year-over-year growth 2023-2028 (%)
- Data Table on North America - Year-over-year growth 2023-2028 (%)
- 9.4 Europe - Market size and forecast 2023-2028
- Chart on Europe - Market size and forecast 2023-2028 ($ million)
- Data Table on Europe - Market size and forecast 2023-2028 ($ million)
- Chart on Europe - Year-over-year growth 2023-2028 (%)
- Data Table on Europe - Year-over-year growth 2023-2028 (%)
- 9.5 APAC - Market size and forecast 2023-2028
- Chart on APAC - Market size and forecast 2023-2028 ($ million)
- Data Table on APAC - Market size and forecast 2023-2028 ($ million)
- Chart on APAC - Year-over-year growth 2023-2028 (%)
- Data Table on APAC - Year-over-year growth 2023-2028 (%)
- 9.6 South America - Market size and forecast 2023-2028
- Chart on South America - Market size and forecast 2023-2028 ($ million)
- Data Table on South America - Market size and forecast 2023-2028 ($ million)
- Chart on South America - Year-over-year growth 2023-2028 (%)
- Data Table on South America - Year-over-year growth 2023-2028 (%)
- 9.7 Middle East and Africa - Market size and forecast 2023-2028
- Chart on Middle East and Africa - Market size and forecast 2023-2028 ($ million)
- Data Table on Middle East and Africa - Market size and forecast 2023-2028 ($ million)
- Chart on Middle East and Africa - Year-over-year growth 2023-2028 (%)
- Data Table on Middle East and Africa - Year-over-year growth 2023-2028 (%)
- 9.8 US - Market size and forecast 2023-2028
- Chart on US - Market size and forecast 2023-2028 ($ million)
- Data Table on US - Market size and forecast 2023-2028 ($ million)
- Chart on US - Year-over-year growth 2023-2028 (%)
- Data Table on US - Year-over-year growth 2023-2028 (%)
- 9.9 France - Market size and forecast 2023-2028
- Chart on France - Market size and forecast 2023-2028 ($ million)
- Data Table on France - Market size and forecast 2023-2028 ($ million)
- Chart on France - Year-over-year growth 2023-2028 (%)
- Data Table on France - Year-over-year growth 2023-2028 (%)
- 9.10 China - Market size and forecast 2023-2028
- Chart on China - Market size and forecast 2023-2028 ($ million)
- Data Table on China - Market size and forecast 2023-2028 ($ million)
- Chart on China - Year-over-year growth 2023-2028 (%)
- Data Table on China - Year-over-year growth 2023-2028 (%)
- 9.11 Italy - Market size and forecast 2023-2028
- Chart on Italy - Market size and forecast 2023-2028 ($ million)
- Data Table on Italy - Market size and forecast 2023-2028 ($ million)
- Chart on Italy - Year-over-year growth 2023-2028 (%)
- Data Table on Italy - Year-over-year growth 2023-2028 (%)
- 9.12 Australia - Market size and forecast 2023-2028
- Chart on Australia - Market size and forecast 2023-2028 ($ million)
- Data Table on Australia - Market size and forecast 2023-2028 ($ million)
- Chart on Australia - Year-over-year growth 2023-2028 (%)
- Data Table on Australia - Year-over-year growth 2023-2028 (%)
- 9.13 Market opportunity By Geographical Landscape
- Market opportunity By Geographical Landscape ($ million)
- Data Tables on Market opportunity By Geographical Landscape ($ million)
10 Drivers, Challenges, and Opportunity/Restraints
- 10.1 Market drivers
- 10.2 Market challenges
- 10.3 Impact of drivers and challenges
- Impact of drivers and challenges in 2023 and 2028
- 10.4 Market opportunities/restraints
11 Competitive Landscape
- 11.1 Overview
- 11.2 Competitive Landscape
- Overview on criticality of inputs and factors of differentiation
- 11.3 Landscape disruption
- Overview on factors of disruption
- 11.4 Industry risks
- Impact of key risks on business
12 Competitive Analysis
- 12.1 Companies profiled
- Companies covered
- 12.2 Market positioning of companies
- Matrix on companies position and classification
- 12.3 AGRANA Beteiligungs AG
- AGRANA Beteiligungs AG - Overview
- AGRANA Beteiligungs AG - Business segments
- AGRANA Beteiligungs AG - Key news
- AGRANA Beteiligungs AG - Key offerings
- AGRANA Beteiligungs AG - Segment focus
- 12.4 AMINOLA BV
- AMINOLA BV - Overview
- AMINOLA BV - Product / Service
- AMINOLA BV - Key offerings
- 12.5 Bioriginal Food and Science Corp.
- Bioriginal Food and Science Corp. - Overview
- Bioriginal Food and Science Corp. - Product / Service
- Bioriginal Food and Science Corp. - Key offerings
- 12.6 Royal Avebe
- Royal Avebe - Overview
- Royal Avebe - Product / Service
- Royal Avebe - Key news
- Royal Avebe - Key offerings
- 12.7 Cooperatie Koninklijke Cosun UA
- Cooperatie Koninklijke Cosun UA - Overview
- Cooperatie Koninklijke Cosun UA - Product / Service
- Cooperatie Koninklijke Cosun UA - Key offerings
- 12.8 Emsland Starke GmbH
- Emsland Starke GmbH - Overview
- Emsland Starke GmbH - Product / Service
- Emsland Starke GmbH - Key news
- Emsland Starke GmbH - Key offerings
- 12.9 Food Innovation Online Corp.
- Food Innovation Online Corp. - Overview
- Food Innovation Online Corp. - Product / Service
- Food Innovation Online Corp. - Key offerings
- 12.10 Kerry Group Plc
- Kerry Group Plc - Overview
- Kerry Group Plc - Business segments
- Kerry Group Plc - Key news
- Kerry Group Plc - Key offerings
- Kerry Group Plc - Segment focus
- 12.11 KMC amba
- KMC amba - Overview
- KMC amba - Product / Service
- KMC amba - Key offerings
- 12.12 Lyckeby Starch AB
- Lyckeby Starch AB - Overview
- Lyckeby Starch AB - Product / Service
- Lyckeby Starch AB - Key offerings
- 12.13 Meelunie BV
- Meelunie BV - Overview
- Meelunie BV - Product / Service
- Meelunie BV - Key offerings
- 12.14 PEPEES SA
- PEPEES SA - Overview
- PEPEES SA - Business segments
- PEPEES SA - Key offerings
- PEPEES SA - Segment focus
- 12.15 PPZ SA
- PPZ SA - Overview
- PPZ SA - Product / Service
- PPZ SA - Key offerings
- 12.16 Roquette Freres SA
- Roquette Freres SA - Overview
- Roquette Freres SA - Product / Service
- Roquette Freres SA - Key offerings
- 12.17 Tereos Participations
- Tereos Participations - Overview
- Tereos Participations - Product / Service
- Tereos Participations - Key offerings
13 Appendix
- 13.1 Scope of the report
- 13.2 Inclusions and exclusions checklist
- Inclusions checklist
- Exclusions checklist
- 13.3 Currency conversion rates for US$
- Currency conversion rates for US$
- 13.4 Research methodology
- Research methodology
- 13.5 Data procurement
- Information sources
- 13.6 Data validation
- Data validation
- 13.7 Validation techniques employed for market sizing
- Validation techniques employed for market sizing
- 13.8 Data synthesis
- Data synthesis
- 13.9 360 degree market analysis
- 360 degree market analysis
- 13.10 List of abbreviations
- List of abbreviations
