|
|
市場調査レポート
商品コード
1524817
エンドウタンパク加工機器の世界市場 2024-2028Global pea protein processing equipment market 2024-2028 |
||||||
|
|||||||
カスタマイズ可能
|
|||||||


| エンドウタンパク加工機器の世界市場 2024-2028 |
|
出版日: 2024年07月03日
発行: TechNavio
ページ情報: 英文 171 Pages
納期: 即納可能
|

全表示
- 概要
- 図表
- 目次
エンドウタンパク加工機器市場は2023-2028年に4,620万米ドル、予測期間中のCAGRは3.2%で成長すると予測されます。
当レポートでは、エンドウタンパク加工機器市場の全体的な分析、市場規模・予測、動向、成長促進要因、課題、約25のベンダーを網羅したベンダー分析などを掲載しています。
現在の市場シナリオ、最新動向と促進要因、市場環境全体に関する最新分析を提供しています。同市場は、エンドウ豆タンパク質がもたらす健康と栄養面での利点、様々な食品の原材料としてのエンドウ豆タンパク質の使用、従来のタンパク質源の価格上昇によって牽引されています。
| 市場範囲 | |
|---|---|
| 基準年 | 2024 |
| 終了年 | 2028 |
| 予測期間 | 2024-2028 |
| 成長モメンタム | 加速 |
| 前年比2024年 | 3.06% |
| CAGR | 3.2% |
| 増分額 | 4,620万米ドル |
本調査では、今後数年間のエンドウタンパク加工機器市場成長を促進する主な理由の1つとして、エンドウタンパク加工工場の拡張を挙げています。また、エネルギーと電力消費の削減に対するベンダーの関心の高まりと菜食主義への嗜好の高まりは、市場の大きな需要につながります。
目次
第1章 エグゼクティブサマリー
- 市場概要
第2章 市場情勢
- 市場エコシステム
- 市場の特徴
- バリューチェーン分析
第3章 市場規模の評価
- 市場の定義
- 市場セグメント分析
- 市場規模 2023
- 市場の見通し 2023-2028
第4章 市場規模実績
- 世界エンドウタンパク加工機器市場 2018-2022
- 方法別セグメント分析 2018-2022
- 用途別セグメント分析 2018-2022
- 地域別セグメント分析 2018-2022
- 国別セグメント分析 2018-2022
第5章 ファイブフォース分析
- ファイブフォースの要約
- 買い手の交渉力
- 供給企業の交渉力
- 新規参入業者の脅威
- 代替品の脅威
- 競争の脅威
- 市況
第6章 市場セグメンテーション:方法別
- 市場セグメンテーション
- 比較:方法別
- 湿式分別:市場規模と予測 2023-2028
- 乾式分別:市場規模と予測 2023-2028
- 市場機会:方法別
第7章 市場セグメンテーション:用途別
- 市場セグメンテーション
- 比較:用途別
- 食品:市場規模と予測 2023-2028
- ヘルスケア製品:市場規模と予測 2023-2028
- その他:市場規模と予測 2023-2028
- 市場機会:用途別
第8章 顧客情勢
- 顧客情勢の概要
第9章 地域別情勢
- 地域別セグメンテーション
- 地域別比較
- 北米:市場規模と予測 2023-2028
- 欧州:市場規模と予測 2023-2028
- アジア太平洋:市場規模と予測 2023-2028
- 中東・アフリカ:市場規模と予測 2023-2028
- 南米:市場規模と予測 2023-2028
- 米国:市場規模と予測 2023-2028
- 中国:市場規模と予測 2023-2028
- 英国:市場規模と予測 2023-2028
- ドイツ:市場規模と予測 2023-2028
- 日本:市場規模と予測 2023-2028
- 市場機会:地域情勢別
第10章 促進要因・課題・機会・抑制要因
- 市場促進要因
- 市場の課題
- 促進要因と課題の影響
- 市場の機会・抑制要因
第11章 競合情勢
- 概要
- 競合情勢
- 混乱の状況
- 業界のリスク
第12章 競合分析
- 企業プロファイル
- 企業の市場ポジショニング
- AKYUREK TECHNOLOGY
- Alfa Laval AB
- Alvan Blanch Development Co.
- Andritz AG
- Buhler AG
- Flottweg SE
- GEA Group AG
- Hillenbrand Inc.
- Hosokawa Micron Corp.
- JK Machinery Sro
- John Bean Technologies Corp.
- Jwala Techno Engineering Pvt. Ltd.
- Pollak Sala Sro
- Prater Industries Inc.
- Satake Corp.
第13章 付録
Exhibits:
- Exhibits1: Executive Summary - Chart on Market Overview
- Exhibits2: Executive Summary - Data Table on Market Overview
- Exhibits3: Executive Summary - Chart on Global Market Characteristics
- Exhibits4: Executive Summary - Chart on Market By Geographical Landscape
- Exhibits5: Executive Summary - Chart on Market Segmentation by Method
- Exhibits6: Executive Summary - Chart on Market Segmentation by Application
- Exhibits7: Executive Summary - Chart on Incremental Growth
- Exhibits8: Executive Summary - Data Table on Incremental Growth
- Exhibits9: Executive Summary - Chart on Company Market Positioning
- Exhibits10: Parent Market
- Exhibits11: Data Table on - Parent Market
- Exhibits12: Market characteristics analysis
- Exhibits13: Value Chain Analysis
- Exhibits14: Offerings of companies included in the market definition
- Exhibits15: Market segments
- Exhibits16: Chart on Global - Market size and forecast 2023-2028 ($ million)
- Exhibits17: Data Table on Global - Market size and forecast 2023-2028 ($ million)
- Exhibits18: Chart on Global Market: Year-over-year growth 2023-2028 (%)
- Exhibits19: Data Table on Global Market: Year-over-year growth 2023-2028 (%)
- Exhibits20: Historic Market Size - Data Table on Global Pea Protein Processing Equipment Market 2018 - 2022 ($ million)
- Exhibits21: Historic Market Size - Method Segment 2018 - 2022 ($ million)
- Exhibits22: Historic Market Size - Application Segment 2018 - 2022 ($ million)
- Exhibits23: Historic Market Size - Geography Segment 2018 - 2022 ($ million)
- Exhibits24: Historic Market Size - Country Segment 2018 - 2022 ($ million)
- Exhibits25: Five forces analysis - Comparison between 2023 and 2028
- Exhibits26: Bargaining power of buyers - Impact of key factors 2023 and 2028
- Exhibits27: Bargaining power of suppliers - Impact of key factors in 2023 and 2028
- Exhibits28: Threat of new entrants - Impact of key factors in 2023 and 2028
- Exhibits29: Threat of substitutes - Impact of key factors in 2023 and 2028
- Exhibits30: Threat of rivalry - Impact of key factors in 2023 and 2028
- Exhibits31: Chart on Market condition - Five forces 2023 and 2028
- Exhibits32: Chart on Method - Market share 2023-2028 (%)
- Exhibits33: Data Table on Method - Market share 2023-2028 (%)
- Exhibits34: Chart on Comparison by Method
- Exhibits35: Data Table on Comparison by Method
- Exhibits36: Chart on Wet fractionation - Market size and forecast 2023-2028 ($ million)
- Exhibits37: Data Table on Wet fractionation - Market size and forecast 2023-2028 ($ million)
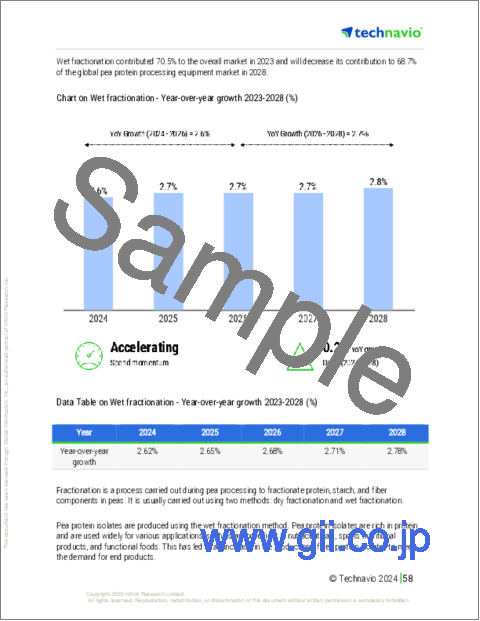
- Exhibits38: Chart on Wet fractionation - Year-over-year growth 2023-2028 (%)
- Exhibits39: Data Table on Wet fractionation - Year-over-year growth 2023-2028 (%)
- Exhibits40: Chart on Dry fractionation - Market size and forecast 2023-2028 ($ million)
- Exhibits41: Data Table on Dry fractionation - Market size and forecast 2023-2028 ($ million)
- Exhibits42: Chart on Dry fractionation - Year-over-year growth 2023-2028 (%)
- Exhibits43: Data Table on Dry fractionation - Year-over-year growth 2023-2028 (%)
- Exhibits44: Market opportunity by Method ($ million)
- Exhibits45: Data Table on Market opportunity by Method ($ million)
- Exhibits46: Chart on Application - Market share 2023-2028 (%)
- Exhibits47: Data Table on Application - Market share 2023-2028 (%)
- Exhibits48: Chart on Comparison by Application
- Exhibits49: Data Table on Comparison by Application
- Exhibits50: Chart on Food - Market size and forecast 2023-2028 ($ million)
- Exhibits51: Data Table on Food - Market size and forecast 2023-2028 ($ million)
- Exhibits52: Chart on Food - Year-over-year growth 2023-2028 (%)
- Exhibits53: Data Table on Food - Year-over-year growth 2023-2028 (%)
- Exhibits54: Chart on Healthcare products - Market size and forecast 2023-2028 ($ million)
- Exhibits55: Data Table on Healthcare products - Market size and forecast 2023-2028 ($ million)
- Exhibits56: Chart on Healthcare products - Year-over-year growth 2023-2028 (%)
- Exhibits57: Data Table on Healthcare products - Year-over-year growth 2023-2028 (%)
- Exhibits58: Chart on Others - Market size and forecast 2023-2028 ($ million)
- Exhibits59: Data Table on Others - Market size and forecast 2023-2028 ($ million)
- Exhibits60: Chart on Others - Year-over-year growth 2023-2028 (%)
- Exhibits61: Data Table on Others - Year-over-year growth 2023-2028 (%)
- Exhibits62: Market opportunity by Application ($ million)
- Exhibits63: Data Table on Market opportunity by Application ($ million)
- Exhibits64: Analysis of price sensitivity, lifecycle, customer purchase basket, adoption rates, and purchase criteria
- Exhibits65: Chart on Market share By Geographical Landscape 2023-2028 (%)
- Exhibits66: Data Table on Market share By Geographical Landscape 2023-2028 (%)
- Exhibits67: Chart on Geographic comparison
- Exhibits68: Data Table on Geographic comparison
- Exhibits69: Chart on North America - Market size and forecast 2023-2028 ($ million)
- Exhibits70: Data Table on North America - Market size and forecast 2023-2028 ($ million)
- Exhibits71: Chart on North America - Year-over-year growth 2023-2028 (%)
- Exhibits72: Data Table on North America - Year-over-year growth 2023-2028 (%)
- Exhibits73: Chart on Europe - Market size and forecast 2023-2028 ($ million)
- Exhibits74: Data Table on Europe - Market size and forecast 2023-2028 ($ million)
- Exhibits75: Chart on Europe - Year-over-year growth 2023-2028 (%)
- Exhibits76: Data Table on Europe - Year-over-year growth 2023-2028 (%)
- Exhibits77: Chart on APAC - Market size and forecast 2023-2028 ($ million)
- Exhibits78: Data Table on APAC - Market size and forecast 2023-2028 ($ million)
- Exhibits79: Chart on APAC - Year-over-year growth 2023-2028 (%)
- Exhibits80: Data Table on APAC - Year-over-year growth 2023-2028 (%)
- Exhibits81: Chart on Middle East and Africa - Market size and forecast 2023-2028 ($ million)
- Exhibits82: Data Table on Middle East and Africa - Market size and forecast 2023-2028 ($ million)
- Exhibits83: Chart on Middle East and Africa - Year-over-year growth 2023-2028 (%)
- Exhibits84: Data Table on Middle East and Africa - Year-over-year growth 2023-2028 (%)
- Exhibits85: Chart on South America - Market size and forecast 2023-2028 ($ million)
- Exhibits86: Data Table on South America - Market size and forecast 2023-2028 ($ million)
- Exhibits87: Chart on South America - Year-over-year growth 2023-2028 (%)
- Exhibits88: Data Table on South America - Year-over-year growth 2023-2028 (%)
- Exhibits89: Chart on US - Market size and forecast 2023-2028 ($ million)
- Exhibits90: Data Table on US - Market size and forecast 2023-2028 ($ million)
- Exhibits91: Chart on US - Year-over-year growth 2023-2028 (%)
- Exhibits92: Data Table on US - Year-over-year growth 2023-2028 (%)
- Exhibits93: Chart on China - Market size and forecast 2023-2028 ($ million)
- Exhibits94: Data Table on China - Market size and forecast 2023-2028 ($ million)
- Exhibits95: Chart on China - Year-over-year growth 2023-2028 (%)
- Exhibits96: Data Table on China - Year-over-year growth 2023-2028 (%)
- Exhibits97: Chart on UK - Market size and forecast 2023-2028 ($ million)
- Exhibits98: Data Table on UK - Market size and forecast 2023-2028 ($ million)
- Exhibits99: Chart on UK - Year-over-year growth 2023-2028 (%)
- Exhibits100: Data Table on UK - Year-over-year growth 2023-2028 (%)
- Exhibits101: Chart on Germany - Market size and forecast 2023-2028 ($ million)
- Exhibits102: Data Table on Germany - Market size and forecast 2023-2028 ($ million)
- Exhibits103: Chart on Germany - Year-over-year growth 2023-2028 (%)
- Exhibits104: Data Table on Germany - Year-over-year growth 2023-2028 (%)
- Exhibits105: Chart on Japan - Market size and forecast 2023-2028 ($ million)
- Exhibits106: Data Table on Japan - Market size and forecast 2023-2028 ($ million)
- Exhibits107: Chart on Japan - Year-over-year growth 2023-2028 (%)
- Exhibits108: Data Table on Japan - Year-over-year growth 2023-2028 (%)
- Exhibits109: Market opportunity By Geographical Landscape ($ million)
- Exhibits110: Data Tables on Market opportunity By Geographical Landscape ($ million)
- Exhibits111: Impact of drivers and challenges in 2023 and 2028
- Exhibits112: Overview on criticality of inputs and factors of differentiation
- Exhibits113: Overview on factors of disruption
- Exhibits114: Impact of key risks on business
- Exhibits115: Companies covered
- Exhibits116: Matrix on companies position and classification
- Exhibits117: AKYUREK TECHNOLOGY - Overview
- Exhibits118: AKYUREK TECHNOLOGY - Product / Service
- Exhibits119: AKYUREK TECHNOLOGY - Key offerings
- Exhibits120: Alfa Laval AB - Overview
- Exhibits121: Alfa Laval AB - Business segments
- Exhibits122: Alfa Laval AB - Key news
- Exhibits123: Alfa Laval AB - Key offerings
- Exhibits124: Alfa Laval AB - Segment focus
- Exhibits125: Alvan Blanch Development Co. - Overview
- Exhibits126: Alvan Blanch Development Co. - Product / Service
- Exhibits127: Alvan Blanch Development Co. - Key offerings
- Exhibits128: Andritz AG - Overview
- Exhibits129: Andritz AG - Business segments
- Exhibits130: Andritz AG - Key news
- Exhibits131: Andritz AG - Key offerings
- Exhibits132: Andritz AG - Segment focus
- Exhibits133: Buhler AG - Overview
- Exhibits134: Buhler AG - Business segments
- Exhibits135: Buhler AG - Key news
- Exhibits136: Buhler AG - Key offerings
- Exhibits137: Buhler AG - Segment focus
- Exhibits138: Flottweg SE - Overview
- Exhibits139: Flottweg SE - Product / Service
- Exhibits140: Flottweg SE - Key offerings
- Exhibits141: GEA Group AG - Overview
- Exhibits142: GEA Group AG - Business segments
- Exhibits143: GEA Group AG - Key news
- Exhibits144: GEA Group AG - Key offerings
- Exhibits145: GEA Group AG - Segment focus
- Exhibits146: Hillenbrand Inc. - Overview
- Exhibits147: Hillenbrand Inc. - Business segments
- Exhibits148: Hillenbrand Inc. - Key news
- Exhibits149: Hillenbrand Inc. - Key offerings
- Exhibits150: Hillenbrand Inc. - Segment focus
- Exhibits151: Hosokawa Micron Corp. - Overview
- Exhibits152: Hosokawa Micron Corp. - Business segments
- Exhibits153: Hosokawa Micron Corp. - Key offerings
- Exhibits154: Hosokawa Micron Corp. - Segment focus
- Exhibits155: JK Machinery Sro - Overview
- Exhibits156: JK Machinery Sro - Product / Service
- Exhibits157: JK Machinery Sro - Key offerings
- Exhibits158: John Bean Technologies Corp. - Overview
- Exhibits159: John Bean Technologies Corp. - Business segments
- Exhibits160: John Bean Technologies Corp. - Key news
- Exhibits161: John Bean Technologies Corp. - Key offerings
- Exhibits162: John Bean Technologies Corp. - Segment focus
- Exhibits163: Jwala Techno Engineering Pvt. Ltd. - Overview
- Exhibits164: Jwala Techno Engineering Pvt. Ltd. - Product / Service
- Exhibits165: Jwala Techno Engineering Pvt. Ltd. - Key offerings
- Exhibits166: Pollak Sala Sro - Overview
- Exhibits167: Pollak Sala Sro - Product / Service
- Exhibits168: Pollak Sala Sro - Key offerings
- Exhibits169: Prater Industries Inc. - Overview
- Exhibits170: Prater Industries Inc. - Product / Service
- Exhibits171: Prater Industries Inc. - Key offerings
- Exhibits172: Satake Corp. - Overview
- Exhibits173: Satake Corp. - Product / Service
- Exhibits174: Satake Corp. - Key offerings
- Exhibits175: Inclusions checklist
- Exhibits176: Exclusions checklist
- Exhibits177: Currency conversion rates for US$
- Exhibits178: Research methodology
- Exhibits179: Information sources
- Exhibits180: Data validation
- Exhibits181: Validation techniques employed for market sizing
- Exhibits182: Data synthesis
- Exhibits183: 360 degree market analysis
- Exhibits184: List of abbreviations
The pea protein processing equipment market is forecasted to grow by USD 46.2 mn during 2023-2028, accelerating at a CAGR of 3.2% during the forecast period. The report on the pea protein processing equipment market provides a holistic analysis, market size and forecast, trends, growth drivers, and challenges, as well as vendor analysis covering around 25 vendors.
The report offers an up-to-date analysis regarding the current market scenario, the latest trends and drivers, and the overall market environment. The market is driven by health and nutritional benefits provided by pea protein, use of pea protein as an ingredient in various food products, and rising prices of conventional protein sources.
Technavio's pea protein processing equipment market is segmented as below:
| Market Scope | |
|---|---|
| Base Year | 2024 |
| End Year | 2028 |
| Series Year | 2024-2028 |
| Growth Momentum | Accelerate |
| YOY 2024 | 3.06% |
| CAGR | 3.2% |
| Incremental Value | $46.2mn |
By Method
- Wet fractionation
- Dry fractionation
By Application
- Food
- Healthcare products
- Others
By Geographical Landscape
- North America
- Europe
- APAC
- Middle East and Africa
- South America
This study identifies the expansions of pea protein processing plants as one of the prime reasons driving the pea protein processing equipment market growth during the next few years. Also, rising vendor focus on reducing energy and power consumption and growing preference for veganism will lead to sizable demand in the market.
The report on the pea protein processing equipment market covers the following areas:
- Pea protein processing equipment market sizing
- Pea protein processing equipment market forecast
- Pea protein processing equipment market industry analysis
The robust vendor analysis is designed to help clients improve their market position, and in line with this, this report provides a detailed analysis of several leading pea protein processing equipment market vendors that include AKYUREK TECHNOLOGY, Alfa Laval AB, Alvan Blanch Development Co., Andritz AG, Buhler AG, Erich NETZSCH GmbH and Co. Holding KG, Flottweg SE, GEA Group AG, Hillenbrand Inc., Hosokawa Micron Corp., JK Machinery Sro, John Bean Technologies Corp., Jwala Techno Engineering Pvt. Ltd., Koch Industries Inc., Pollak Sala Sro, Prater Industries Inc., ProEx Food LLC, Satake Corp., SiccaDania, Sturtevant Inc., and Zanichelli Meccanica Spa. Also, the pea protein processing equipment market analysis report includes information on upcoming trends and challenges that will influence market growth. This is to help companies strategize and leverage all forthcoming growth opportunities.
The study was conducted using an objective combination of primary and secondary information including inputs from key participants in the industry. The report contains a comprehensive market and vendor landscape in addition to an analysis of the key vendors.
The publisher presents a detailed picture of the market by the way of study, synthesis, and summation of data from multiple sources by an analysis of key parameters such as profit, pricing, competition, and promotions. IT presents various market facets by identifying the key industry influencers. The data presented is comprehensive, reliable, and a result of extensive research - both primary and secondary. The market research reports provide a complete competitive landscape and an in-depth vendor selection methodology and analysis using qualitative and quantitative research to forecast the accurate market growth.
Table of Contents
1 Executive Summary
- 1.1 Market overview
- Executive Summary - Chart on Market Overview
- Executive Summary - Data Table on Market Overview
- Executive Summary - Chart on Global Market Characteristics
- Executive Summary - Chart on Market By Geographical Landscape
- Executive Summary - Chart on Market Segmentation by Method
- Executive Summary - Chart on Market Segmentation by Application
- Executive Summary - Chart on Incremental Growth
- Executive Summary - Data Table on Incremental Growth
- Executive Summary - Chart on Company Market Positioning
2 Market Landscape
- 2.1 Market ecosystem
- Parent Market
- Data Table on - Parent Market
- 2.2 Market characteristics
- Market characteristics analysis
- 2.3 Value chain analysis
- Value Chain Analysis
3 Market Sizing
- 3.1 Market definition
- Offerings of companies included in the market definition
- 3.2 Market segment analysis
- Market segments
- 3.3 Market size 2023
- 3.4 Market outlook: Forecast for 2023-2028
- Chart on Global - Market size and forecast 2023-2028 ($ million)
- Data Table on Global - Market size and forecast 2023-2028 ($ million)
- Chart on Global Market: Year-over-year growth 2023-2028 (%)
- Data Table on Global Market: Year-over-year growth 2023-2028 (%)
4 Historic Market Size
- 4.1 Global Pea Protein Processing Equipment Market 2018 - 2022
- Historic Market Size - Data Table on Global Pea Protein Processing Equipment Market 2018 - 2022 ($ million)
- 4.2 Method segment analysis 2018 - 2022
- Historic Market Size - Method Segment 2018 - 2022 ($ million)
- 4.3 Application segment analysis 2018 - 2022
- Historic Market Size - Application Segment 2018 - 2022 ($ million)
- 4.4 Geography segment analysis 2018 - 2022
- Historic Market Size - Geography Segment 2018 - 2022 ($ million)
- 4.5 Country segment analysis 2018 - 2022
- Historic Market Size - Country Segment 2018 - 2022 ($ million)
5 Five Forces Analysis
- 5.1 Five forces summary
- Five forces analysis - Comparison between 2023 and 2028
- 5.2 Bargaining power of buyers
- Bargaining power of buyers - Impact of key factors 2023 and 2028
- 5.3 Bargaining power of suppliers
- Bargaining power of suppliers - Impact of key factors in 2023 and 2028
- 5.4 Threat of new entrants
- Threat of new entrants - Impact of key factors in 2023 and 2028
- 5.5 Threat of substitutes
- Threat of substitutes - Impact of key factors in 2023 and 2028
- 5.6 Threat of rivalry
- Threat of rivalry - Impact of key factors in 2023 and 2028
- 5.7 Market condition
- Chart on Market condition - Five forces 2023 and 2028
6 Market Segmentation by Method
- 6.1 Market segments
- Chart on Method - Market share 2023-2028 (%)
- Data Table on Method - Market share 2023-2028 (%)
- 6.2 Comparison by Method
- Chart on Comparison by Method
- Data Table on Comparison by Method
- 6.3 Wet fractionation - Market size and forecast 2023-2028
- Chart on Wet fractionation - Market size and forecast 2023-2028 ($ million)
- Data Table on Wet fractionation - Market size and forecast 2023-2028 ($ million)
- Chart on Wet fractionation - Year-over-year growth 2023-2028 (%)
- Data Table on Wet fractionation - Year-over-year growth 2023-2028 (%)
- 6.4 Dry fractionation - Market size and forecast 2023-2028
- Chart on Dry fractionation - Market size and forecast 2023-2028 ($ million)
- Data Table on Dry fractionation - Market size and forecast 2023-2028 ($ million)
- Chart on Dry fractionation - Year-over-year growth 2023-2028 (%)
- Data Table on Dry fractionation - Year-over-year growth 2023-2028 (%)
- 6.5 Market opportunity by Method
- Market opportunity by Method ($ million)
- Data Table on Market opportunity by Method ($ million)
7 Market Segmentation by Application
- 7.1 Market segments
- Chart on Application - Market share 2023-2028 (%)
- Data Table on Application - Market share 2023-2028 (%)
- 7.2 Comparison by Application
- Chart on Comparison by Application
- Data Table on Comparison by Application
- 7.3 Food - Market size and forecast 2023-2028
- Chart on Food - Market size and forecast 2023-2028 ($ million)
- Data Table on Food - Market size and forecast 2023-2028 ($ million)
- Chart on Food - Year-over-year growth 2023-2028 (%)
- Data Table on Food - Year-over-year growth 2023-2028 (%)
- 7.4 Healthcare products - Market size and forecast 2023-2028
- Chart on Healthcare products - Market size and forecast 2023-2028 ($ million)
- Data Table on Healthcare products - Market size and forecast 2023-2028 ($ million)
- Chart on Healthcare products - Year-over-year growth 2023-2028 (%)
- Data Table on Healthcare products - Year-over-year growth 2023-2028 (%)
- 7.5 Others - Market size and forecast 2023-2028
- Chart on Others - Market size and forecast 2023-2028 ($ million)
- Data Table on Others - Market size and forecast 2023-2028 ($ million)
- Chart on Others - Year-over-year growth 2023-2028 (%)
- Data Table on Others - Year-over-year growth 2023-2028 (%)
- 7.6 Market opportunity by Application
- Market opportunity by Application ($ million)
- Data Table on Market opportunity by Application ($ million)
8 Customer Landscape
- 8.1 Customer landscape overview
- Analysis of price sensitivity, lifecycle, customer purchase basket, adoption rates, and purchase criteria
9 Geographic Landscape
- 9.1 Geographic segmentation
- Chart on Market share By Geographical Landscape 2023-2028 (%)
- Data Table on Market share By Geographical Landscape 2023-2028 (%)
- 9.2 Geographic comparison
- Chart on Geographic comparison
- Data Table on Geographic comparison
- 9.3 North America - Market size and forecast 2023-2028
- Chart on North America - Market size and forecast 2023-2028 ($ million)
- Data Table on North America - Market size and forecast 2023-2028 ($ million)
- Chart on North America - Year-over-year growth 2023-2028 (%)
- Data Table on North America - Year-over-year growth 2023-2028 (%)
- 9.4 Europe - Market size and forecast 2023-2028
- Chart on Europe - Market size and forecast 2023-2028 ($ million)
- Data Table on Europe - Market size and forecast 2023-2028 ($ million)
- Chart on Europe - Year-over-year growth 2023-2028 (%)
- Data Table on Europe - Year-over-year growth 2023-2028 (%)
- 9.5 APAC - Market size and forecast 2023-2028
- Chart on APAC - Market size and forecast 2023-2028 ($ million)
- Data Table on APAC - Market size and forecast 2023-2028 ($ million)
- Chart on APAC - Year-over-year growth 2023-2028 (%)
- Data Table on APAC - Year-over-year growth 2023-2028 (%)
- 9.6 Middle East and Africa - Market size and forecast 2023-2028
- Chart on Middle East and Africa - Market size and forecast 2023-2028 ($ million)
- Data Table on Middle East and Africa - Market size and forecast 2023-2028 ($ million)
- Chart on Middle East and Africa - Year-over-year growth 2023-2028 (%)
- Data Table on Middle East and Africa - Year-over-year growth 2023-2028 (%)
- 9.7 South America - Market size and forecast 2023-2028
- Chart on South America - Market size and forecast 2023-2028 ($ million)
- Data Table on South America - Market size and forecast 2023-2028 ($ million)
- Chart on South America - Year-over-year growth 2023-2028 (%)
- Data Table on South America - Year-over-year growth 2023-2028 (%)
- 9.8 US - Market size and forecast 2023-2028
- Chart on US - Market size and forecast 2023-2028 ($ million)
- Data Table on US - Market size and forecast 2023-2028 ($ million)
- Chart on US - Year-over-year growth 2023-2028 (%)
- Data Table on US - Year-over-year growth 2023-2028 (%)
- 9.9 China - Market size and forecast 2023-2028
- Chart on China - Market size and forecast 2023-2028 ($ million)
- Data Table on China - Market size and forecast 2023-2028 ($ million)
- Chart on China - Year-over-year growth 2023-2028 (%)
- Data Table on China - Year-over-year growth 2023-2028 (%)
- 9.10 UK - Market size and forecast 2023-2028
- Chart on UK - Market size and forecast 2023-2028 ($ million)
- Data Table on UK - Market size and forecast 2023-2028 ($ million)
- Chart on UK - Year-over-year growth 2023-2028 (%)
- Data Table on UK - Year-over-year growth 2023-2028 (%)
- 9.11 Germany - Market size and forecast 2023-2028
- Chart on Germany - Market size and forecast 2023-2028 ($ million)
- Data Table on Germany - Market size and forecast 2023-2028 ($ million)
- Chart on Germany - Year-over-year growth 2023-2028 (%)
- Data Table on Germany - Year-over-year growth 2023-2028 (%)
- 9.12 Japan - Market size and forecast 2023-2028
- Chart on Japan - Market size and forecast 2023-2028 ($ million)
- Data Table on Japan - Market size and forecast 2023-2028 ($ million)
- Chart on Japan - Year-over-year growth 2023-2028 (%)
- Data Table on Japan - Year-over-year growth 2023-2028 (%)
- 9.13 Market opportunity By Geographical Landscape
- Market opportunity By Geographical Landscape ($ million)
- Data Tables on Market opportunity By Geographical Landscape ($ million)
10 Drivers, Challenges, and Opportunity/Restraints
- 10.1 Market drivers
- 10.2 Market challenges
- 10.3 Impact of drivers and challenges
- Impact of drivers and challenges in 2023 and 2028
- 10.4 Market opportunities/restraints
11 Competitive Landscape
- 11.1 Overview
- 11.2 Competitive Landscape
- Overview on criticality of inputs and factors of differentiation
- 11.3 Landscape disruption
- Overview on factors of disruption
- 11.4 Industry risks
- Impact of key risks on business
12 Competitive Analysis
- 12.1 Companies profiled
- Companies covered
- 12.2 Market positioning of companies
- Matrix on companies position and classification
- 12.3 AKYUREK TECHNOLOGY
- AKYUREK TECHNOLOGY - Overview
- AKYUREK TECHNOLOGY - Product / Service
- AKYUREK TECHNOLOGY - Key offerings
- 12.4 Alfa Laval AB
- Alfa Laval AB - Overview
- Alfa Laval AB - Business segments
- Alfa Laval AB - Key news
- Alfa Laval AB - Key offerings
- Alfa Laval AB - Segment focus
- 12.5 Alvan Blanch Development Co.
- Alvan Blanch Development Co. - Overview
- Alvan Blanch Development Co. - Product / Service
- Alvan Blanch Development Co. - Key offerings
- 12.6 Andritz AG
- Andritz AG - Overview
- Andritz AG - Business segments
- Andritz AG - Key news
- Andritz AG - Key offerings
- Andritz AG - Segment focus
- 12.7 Buhler AG
- Buhler AG - Overview
- Buhler AG - Business segments
- Buhler AG - Key news
- Buhler AG - Key offerings
- Buhler AG - Segment focus
- 12.8 Flottweg SE
- Flottweg SE - Overview
- Flottweg SE - Product / Service
- Flottweg SE - Key offerings
- 12.9 GEA Group AG
- GEA Group AG - Overview
- GEA Group AG - Business segments
- GEA Group AG - Key news
- GEA Group AG - Key offerings
- GEA Group AG - Segment focus
- 12.10 Hillenbrand Inc.
- Hillenbrand Inc. - Overview
- Hillenbrand Inc. - Business segments
- Hillenbrand Inc. - Key news
- Hillenbrand Inc. - Key offerings
- Hillenbrand Inc. - Segment focus
- 12.11 Hosokawa Micron Corp.
- Hosokawa Micron Corp. - Overview
- Hosokawa Micron Corp. - Business segments
- Hosokawa Micron Corp. - Key offerings
- Hosokawa Micron Corp. - Segment focus
- 12.12 JK Machinery Sro
- JK Machinery Sro - Overview
- JK Machinery Sro - Product / Service
- JK Machinery Sro - Key offerings
- 12.13 John Bean Technologies Corp.
- John Bean Technologies Corp. - Overview
- John Bean Technologies Corp. - Business segments
- John Bean Technologies Corp. - Key news
- John Bean Technologies Corp. - Key offerings
- John Bean Technologies Corp. - Segment focus
- 12.14 Jwala Techno Engineering Pvt. Ltd.
- Jwala Techno Engineering Pvt. Ltd. - Overview
- Jwala Techno Engineering Pvt. Ltd. - Product / Service
- Jwala Techno Engineering Pvt. Ltd. - Key offerings
- 12.15 Pollak Sala Sro
- Pollak Sala Sro - Overview
- Pollak Sala Sro - Product / Service
- Pollak Sala Sro - Key offerings
- 12.16 Prater Industries Inc.
- Prater Industries Inc. - Overview
- Prater Industries Inc. - Product / Service
- Prater Industries Inc. - Key offerings
- 12.17 Satake Corp.
- Satake Corp. - Overview
- Satake Corp. - Product / Service
- Satake Corp. - Key offerings
13 Appendix
- 13.1 Scope of the report
- 13.2 Inclusions and exclusions checklist
- Inclusions checklist
- Exclusions checklist
- 13.3 Currency conversion rates for US$
- Currency conversion rates for US$
- 13.4 Research methodology
- Research methodology
- 13.5 Data procurement
- Information sources
- 13.6 Data validation
- Data validation
- 13.7 Validation techniques employed for market sizing
- Validation techniques employed for market sizing
- 13.8 Data synthesis
- Data synthesis
- 13.9 360 degree market analysis
- 360 degree market analysis
- 13.10 List of abbreviations
- List of abbreviations
