|
|
市場調査レポート
商品コード
1645649
コーヒー生豆の世界市場 2025~2029年Global Raw Coffee Beans Market 2025-2029 |
||||||

|
|||||||
カスタマイズ可能
|
|||||||

| コーヒー生豆の世界市場 2025~2029年 |
|
出版日: 2025年01月17日
発行: TechNavio
ページ情報: 英文 197 Pages
納期: 即納可能
|

全表示
- 概要
- 図表
- 目次
コーヒー生豆市場は2024~2029年に80億6,370万米ドル、予測期間中のCAGRは3.7%で成長すると予測されています。
この調査レポートは、コーヒー生豆市場の全体分析、市場規模・予測、動向、成長促進要因、課題、約25のベンダーを網羅したベンダー分析などを掲載しています。
現在の市場シナリオ、最新動向と促進要因、市場環境全体に関する最新分析を提供しています。世界のカフェの増加、ミレニアル世代におけるコーヒー人気の高まり、プレミアムコーヒー需要の増加などが市場を牽引しています。
| 市場範囲 | |
|---|---|
| 基準年 | 2025年 |
| 終了年 | 2029年 |
| 予測期間 | 2025~2029年 |
| 成長モメンタム | 加速 |
| 前年比[2025年] | 3.7% |
| CAGR | 3.7% |
| 増分額 | 80億6,370万米ドル |
本調査では、今後数年間のコーヒー生豆市場の成長を促進する主要理由の1つとして、持続可能で倫理的に調達されたコーヒー豆に対する需要の高まりを挙げています。また、コーヒー栽培における精密農業技術の採用の増加や、コーヒーのサブスクリプションモデルの人気の高まりは、市場の大きな需要につながります。
目次
第1章 エグゼクティブサマリー
- 市場概要
第2章 Technavio分析
- 価格・ライフサイクル・顧客購入バスケット・採用率・購入基準の分析
- インプットの重要性と差別化の要因
- 混乱の要因
- 促進要因と課題の影響
第3章 市場情勢
- 市場エコシステム
- 市場の特徴
- バリューチェーン分析
第4章 市場規模
- 市場の定義
- 市場セグメント分析
- 市場規模 2024年
- 市場の展望 2024~2029年
第5章 市場規模実績
- コーヒー生豆の世界市場 2019~2023年
- タイプ別セグメント分析 2019~2023年
- 方法別セグメント分析 2019~2023年
- 地域別セグメント分析 2019~2023年
- 国別セグメント分析 2019~2023年
第6章 定性分析
- AIの影響:コーヒー生豆の世界市場
第7章 ファイブフォース分析
- ファイブフォースの要約
- 買い手の交渉力
- 供給企業の交渉力
- 新規参入業者の脅威
- 代替品の脅威
- 競争の脅威
- 市況
第8章 市場セグメンテーション:タイプ別
- 市場セグメント
- 比較:タイプ別
- アラビカ:市場規模と予測 2024~2029年
- ロブスタ:市場規模と予測 2024~2029年
- 市場機会:タイプ別
第9章 市場セグメンテーション:方法別
- 市場セグメント
- 比較:方法別
- ウェット/ウォッシュプロセス:市場規模と予測 2024~2029年
- ドライ/天然プロセス:市場規模と予測 2024~2029年
- ハニープロセス:市場規模と予測 2024~2029年
- 市場機会:方法別
第10章 顧客情勢
- 顧客情勢概要
第11章 地域別情勢
- 地域別セグメンテーション
- 比較:地域別
- 南米:市場規模と予測 2024~2029年
- アジア太平洋:市場規模と予測 2024~2029年
- 中東・アフリカ:市場規模と予測 2024~2029年
- 北米:市場規模と予測 2024~2029年
- 欧州:市場規模と予測 2024~2029年
- ブラジル:市場規模と予測 2024~2029年
- ベトナム:市場規模と予測 2024~2029年
- コロンビア:市場規模と予測 2024~2029年
- エクアドル:市場規模と予測 2024~2029年
- インドネシア:市場規模と予測 2024~2029年
- エチオピア:市場規模と予測 2024~2029年
- コートジボワール:市場規模と予測 2024~2029年
- ペルー:市場規模と予測 2024~2029年
- ナイジェリア:市場規模と予測 2024~2029年
- カメルーン:市場規模と予測 2024~2029年
- 地域情勢による市場機会
第12章 促進要因・課題・機会・抑制要因
- 市場促進要因
- 市場課題
- 促進要因と課題の影響
- 市場機会・抑制要因
第13章 競合情勢
- 概要
- 競合情勢
- 混乱の状況
- 産業のリスク
第14章 競合分析
- 企業プロファイル
- 企業ランキング指数
- 企業の市場ポジショニング
- Belco SA
- Dongsuh Companies Inc.
- Illycaffe Spa
- jacobs DOUWE EGBERTS B.V.
- La Colombe Torrefaction Inc.
- LUIGI LAVAZZA SpA
- Mayorga Coffee
- Neumann Gruppe GmbH
- RAW Coffee Company LLC
- Strauss Group Ltd.
- Sweet Marias
- The Green Coffee Co.
- Vuno Coffee
- WS Cafe
第15章 付録
Exhibits:
- Exhibits1: Executive Summary - Chart on Market Overview
- Exhibits2: Executive Summary - Data Table on Market Overview
- Exhibits3: Executive Summary - Chart on Global Market Characteristics
- Exhibits4: Executive Summary - Chart on Market By Geographical Landscape
- Exhibits5: Executive Summary - Chart on Market Segmentation by Type
- Exhibits6: Executive Summary - Chart on Market Segmentation by Method
- Exhibits7: Executive Summary - Chart on Incremental Growth
- Exhibits8: Executive Summary - Data Table on Incremental Growth
- Exhibits9: Executive Summary - Chart on Company Market Positioning
- Exhibits10: Analysis of price sensitivity, lifecycle, customer purchase basket, adoption rates, and purchase criteria
- Exhibits11: Overview on criticality of inputs and factors of differentiation
- Exhibits12: Overview on factors of disruption
- Exhibits13: Impact of drivers and challenges in 2024 and 2029
- Exhibits14: Parent Market
- Exhibits15: Data Table on - Parent Market
- Exhibits16: Market characteristics analysis
- Exhibits17: Value chain analysis
- Exhibits18: Offerings of companies included in the market definition
- Exhibits19: Market segments
- Exhibits20: Chart on Global - Market size and forecast 2024-2029 ($ million)
- Exhibits21: Data Table on Global - Market size and forecast 2024-2029 ($ million)
- Exhibits22: Chart on Global Market: Year-over-year growth 2024-2029 (%)
- Exhibits23: Data Table on Global Market: Year-over-year growth 2024-2029 (%)
- Exhibits24: Historic Market Size - Data Table on Global Raw Coffee Beans Market 2019 - 2023 ($ million)
- Exhibits25: Historic Market Size - Type Segment 2019 - 2023 ($ million)
- Exhibits26: Historic Market Size - Method Segment 2019 - 2023 ($ million)
- Exhibits27: Historic Market Size - Geography Segment 2019 - 2023 ($ million)
- Exhibits28: Historic Market Size - Country Segment 2019 - 2023 ($ million)
- Exhibits29: Five forces analysis - Comparison between 2024 and 2029
- Exhibits30: Bargaining power of buyers - Impact of key factors 2024 and 2029
- Exhibits31: Bargaining power of suppliers - Impact of key factors in 2024 and 2029
- Exhibits32: Threat of new entrants - Impact of key factors in 2024 and 2029
- Exhibits33: Threat of substitutes - Impact of key factors in 2024 and 2029
- Exhibits34: Threat of rivalry - Impact of key factors in 2024 and 2029
- Exhibits35: Chart on Market condition - Five forces 2024 and 2029
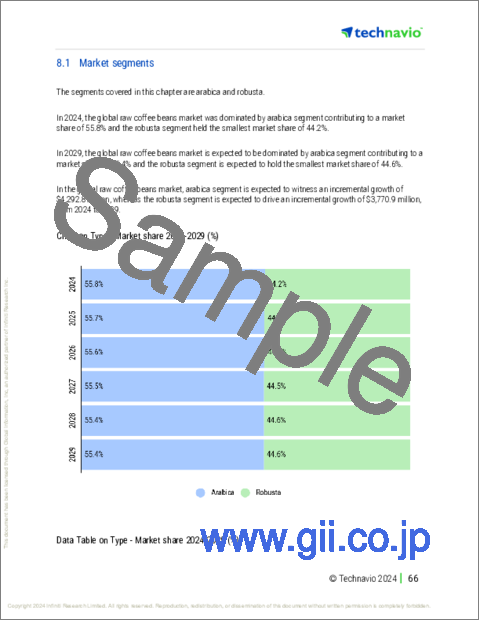
- Exhibits36: Chart on Type - Market share 2024-2029 (%)
- Exhibits37: Data Table on Type - Market share 2024-2029 (%)
- Exhibits38: Chart on Comparison by Type
- Exhibits39: Data Table on Comparison by Type
- Exhibits40: Chart on Arabica - Market size and forecast 2024-2029 ($ million)
- Exhibits41: Data Table on Arabica - Market size and forecast 2024-2029 ($ million)
- Exhibits42: Chart on Arabica - Year-over-year growth 2024-2029 (%)
- Exhibits43: Data Table on Arabica - Year-over-year growth 2024-2029 (%)
- Exhibits44: Chart on Robusta - Market size and forecast 2024-2029 ($ million)
- Exhibits45: Data Table on Robusta - Market size and forecast 2024-2029 ($ million)
- Exhibits46: Chart on Robusta - Year-over-year growth 2024-2029 (%)
- Exhibits47: Data Table on Robusta - Year-over-year growth 2024-2029 (%)
- Exhibits48: Market opportunity by Type ($ million)
- Exhibits49: Data Table on Market opportunity by Type ($ million)
- Exhibits50: Chart on Method - Market share 2024-2029 (%)
- Exhibits51: Data Table on Method - Market share 2024-2029 (%)
- Exhibits52: Chart on Comparison by Method
- Exhibits53: Data Table on Comparison by Method
- Exhibits54: Chart on Wet/Washed process - Market size and forecast 2024-2029 ($ million)
- Exhibits55: Data Table on Wet/Washed process - Market size and forecast 2024-2029 ($ million)
- Exhibits56: Chart on Wet/Washed process - Year-over-year growth 2024-2029 (%)
- Exhibits57: Data Table on Wet/Washed process - Year-over-year growth 2024-2029 (%)
- Exhibits58: Chart on Dry/Natural process - Market size and forecast 2024-2029 ($ million)
- Exhibits59: Data Table on Dry/Natural process - Market size and forecast 2024-2029 ($ million)
- Exhibits60: Chart on Dry/Natural process - Year-over-year growth 2024-2029 (%)
- Exhibits61: Data Table on Dry/Natural process - Year-over-year growth 2024-2029 (%)
- Exhibits62: Chart on Honey process - Market size and forecast 2024-2029 ($ million)
- Exhibits63: Data Table on Honey process - Market size and forecast 2024-2029 ($ million)
- Exhibits64: Chart on Honey process - Year-over-year growth 2024-2029 (%)
- Exhibits65: Data Table on Honey process - Year-over-year growth 2024-2029 (%)
- Exhibits66: Market opportunity by Method ($ million)
- Exhibits67: Data Table on Market opportunity by Method ($ million)
- Exhibits68: Analysis of price sensitivity, lifecycle, customer purchase basket, adoption rates, and purchase criteria
- Exhibits69: Chart on Market share By Geographical Landscape 2024-2029 (%)
- Exhibits70: Data Table on Market share By Geographical Landscape 2024-2029 (%)
- Exhibits71: Chart on Geographic comparison
- Exhibits72: Data Table on Geographic comparison
- Exhibits73: Chart on South America - Market size and forecast 2024-2029 ($ million)
- Exhibits74: Data Table on South America - Market size and forecast 2024-2029 ($ million)
- Exhibits75: Chart on South America - Year-over-year growth 2024-2029 (%)
- Exhibits76: Data Table on South America - Year-over-year growth 2024-2029 (%)
- Exhibits77: Chart on APAC - Market size and forecast 2024-2029 ($ million)
- Exhibits78: Data Table on APAC - Market size and forecast 2024-2029 ($ million)
- Exhibits79: Chart on APAC - Year-over-year growth 2024-2029 (%)
- Exhibits80: Data Table on APAC - Year-over-year growth 2024-2029 (%)
- Exhibits81: Chart on Middle East and Africa - Market size and forecast 2024-2029 ($ million)
- Exhibits82: Data Table on Middle East and Africa - Market size and forecast 2024-2029 ($ million)
- Exhibits83: Chart on Middle East and Africa - Year-over-year growth 2024-2029 (%)
- Exhibits84: Data Table on Middle East and Africa - Year-over-year growth 2024-2029 (%)
- Exhibits85: Chart on North America - Market size and forecast 2024-2029 ($ million)
- Exhibits86: Data Table on North America - Market size and forecast 2024-2029 ($ million)
- Exhibits87: Chart on North America - Year-over-year growth 2024-2029 (%)
- Exhibits88: Data Table on North America - Year-over-year growth 2024-2029 (%)
- Exhibits89: Chart on Europe - Market size and forecast 2024-2029 ($ million)
- Exhibits90: Data Table on Europe - Market size and forecast 2024-2029 ($ million)
- Exhibits91: Chart on Europe - Year-over-year growth 2024-2029 (%)
- Exhibits92: Data Table on Europe - Year-over-year growth 2024-2029 (%)
- Exhibits93: Chart on Brazil - Market size and forecast 2024-2029 ($ million)
- Exhibits94: Data Table on Brazil - Market size and forecast 2024-2029 ($ million)
- Exhibits95: Chart on Brazil - Year-over-year growth 2024-2029 (%)
- Exhibits96: Data Table on Brazil - Year-over-year growth 2024-2029 (%)
- Exhibits97: Chart on Vietnam - Market size and forecast 2024-2029 ($ million)
- Exhibits98: Data Table on Vietnam - Market size and forecast 2024-2029 ($ million)
- Exhibits99: Chart on Vietnam - Year-over-year growth 2024-2029 (%)
- Exhibits100: Data Table on Vietnam - Year-over-year growth 2024-2029 (%)
- Exhibits101: Chart on Colombia - Market size and forecast 2024-2029 ($ million)
- Exhibits102: Data Table on Colombia - Market size and forecast 2024-2029 ($ million)
- Exhibits103: Chart on Colombia - Year-over-year growth 2024-2029 (%)
- Exhibits104: Data Table on Colombia - Year-over-year growth 2024-2029 (%)
- Exhibits105: Chart on Ecuador - Market size and forecast 2024-2029 ($ million)
- Exhibits106: Data Table on Ecuador - Market size and forecast 2024-2029 ($ million)
- Exhibits107: Chart on Ecuador - Year-over-year growth 2024-2029 (%)
- Exhibits108: Data Table on Ecuador - Year-over-year growth 2024-2029 (%)
- Exhibits109: Chart on Indonesia - Market size and forecast 2024-2029 ($ million)
- Exhibits110: Data Table on Indonesia - Market size and forecast 2024-2029 ($ million)
- Exhibits111: Chart on Indonesia - Year-over-year growth 2024-2029 (%)
- Exhibits112: Data Table on Indonesia - Year-over-year growth 2024-2029 (%)
- Exhibits113: Chart on Ethiopia - Market size and forecast 2024-2029 ($ million)
- Exhibits114: Data Table on Ethiopia - Market size and forecast 2024-2029 ($ million)
- Exhibits115: Chart on Ethiopia - Year-over-year growth 2024-2029 (%)
- Exhibits116: Data Table on Ethiopia - Year-over-year growth 2024-2029 (%)
- Exhibits117: Chart on Cote dIvoire - Market size and forecast 2024-2029 ($ million)
- Exhibits118: Data Table on Cote dIvoire - Market size and forecast 2024-2029 ($ million)
- Exhibits119: Chart on Cote dIvoire - Year-over-year growth 2024-2029 (%)
- Exhibits120: Data Table on Cote dIvoire - Year-over-year growth 2024-2029 (%)
- Exhibits121: Chart on Peru - Market size and forecast 2024-2029 ($ million)
- Exhibits122: Data Table on Peru - Market size and forecast 2024-2029 ($ million)
- Exhibits123: Chart on Peru - Year-over-year growth 2024-2029 (%)
- Exhibits124: Data Table on Peru - Year-over-year growth 2024-2029 (%)
- Exhibits125: Chart on Nigeria - Market size and forecast 2024-2029 ($ million)
- Exhibits126: Data Table on Nigeria - Market size and forecast 2024-2029 ($ million)
- Exhibits127: Chart on Nigeria - Year-over-year growth 2024-2029 (%)
- Exhibits128: Data Table on Nigeria - Year-over-year growth 2024-2029 (%)
- Exhibits129: Chart on Cameroon - Market size and forecast 2024-2029 ($ million)
- Exhibits130: Data Table on Cameroon - Market size and forecast 2024-2029 ($ million)
- Exhibits131: Chart on Cameroon - Year-over-year growth 2024-2029 (%)
- Exhibits132: Data Table on Cameroon - Year-over-year growth 2024-2029 (%)
- Exhibits133: Market opportunity By Geographical Landscape ($ million)
- Exhibits134: Data Tables on Market opportunity By Geographical Landscape ($ million)
- Exhibits135: Impact of drivers and challenges in 2024 and 2029
- Exhibits136: Overview on criticality of inputs and factors of differentiation
- Exhibits137: Overview on factors of disruption
- Exhibits138: Impact of key risks on business
- Exhibits139: Companies covered
- Exhibits140: Company ranking index
- Exhibits141: Matrix on companies position and classification
- Exhibits142: Belco SA - Overview
- Exhibits143: Belco SA - Product / Service
- Exhibits144: Belco SA - Key offerings
- Exhibits145: SWOT
- Exhibits146: Dongsuh Companies Inc. - Overview
- Exhibits147: Dongsuh Companies Inc. - Product / Service
- Exhibits148: Dongsuh Companies Inc. - Key offerings
- Exhibits149: SWOT
- Exhibits150: Illycaffe Spa - Overview
- Exhibits151: Illycaffe Spa - Product / Service
- Exhibits152: Illycaffe Spa - Key offerings
- Exhibits153: SWOT
- Exhibits154: jacobs DOUWE EGBERTS B.V. - Overview
- Exhibits155: jacobs DOUWE EGBERTS B.V. - Product / Service
- Exhibits156: jacobs DOUWE EGBERTS B.V. - Key offerings
- Exhibits157: SWOT
- Exhibits158: La Colombe Torrefaction Inc. - Overview
- Exhibits159: La Colombe Torrefaction Inc. - Product / Service
- Exhibits160: La Colombe Torrefaction Inc. - Key offerings
- Exhibits161: SWOT
- Exhibits162: LUIGI LAVAZZA SpA - Overview
- Exhibits163: LUIGI LAVAZZA SpA - Product / Service
- Exhibits164: LUIGI LAVAZZA SpA - Key offerings
- Exhibits165: SWOT
- Exhibits166: Mayorga Coffee - Overview
- Exhibits167: Mayorga Coffee - Product / Service
- Exhibits168: Mayorga Coffee - Key offerings
- Exhibits169: SWOT
- Exhibits170: Neumann Gruppe GmbH - Overview
- Exhibits171: Neumann Gruppe GmbH - Product / Service
- Exhibits172: Neumann Gruppe GmbH - Key offerings
- Exhibits173: SWOT
- Exhibits174: RAW Coffee Company LLC - Overview
- Exhibits175: RAW Coffee Company LLC - Product / Service
- Exhibits176: RAW Coffee Company LLC - Key offerings
- Exhibits177: SWOT
- Exhibits178: Strauss Group Ltd. - Overview
- Exhibits179: Strauss Group Ltd. - Business segments
- Exhibits180: Strauss Group Ltd. - Key offerings
- Exhibits181: Strauss Group Ltd. - Segment focus
- Exhibits182: SWOT
- Exhibits183: Sweet Marias - Overview
- Exhibits184: Sweet Marias - Product / Service
- Exhibits185: Sweet Marias - Key offerings
- Exhibits186: SWOT
- Exhibits187: The Green Coffee Co. - Overview
- Exhibits188: The Green Coffee Co. - Product / Service
- Exhibits189: The Green Coffee Co. - Key offerings
- Exhibits190: SWOT
- Exhibits191: Vuno Coffee - Overview
- Exhibits192: Vuno Coffee - Product / Service
- Exhibits193: Vuno Coffee - Key offerings
- Exhibits194: SWOT
- Exhibits195: WS Cafe - Overview
- Exhibits196: WS Cafe - Product / Service
- Exhibits197: WS Cafe - Key offerings
- Exhibits198: SWOT
- Exhibits199: Inclusions checklist
- Exhibits200: Exclusions checklist
- Exhibits201: Currency conversion rates for US$
- Exhibits202: Research methodology
- Exhibits203: Information sources
- Exhibits204: Data validation
- Exhibits205: Validation techniques employed for market sizing
- Exhibits206: Data synthesis
- Exhibits207: 360 degree market analysis
- Exhibits208: List of abbreviations
The raw coffee beans market is forecasted to grow by USD 8063.7 mn during 2024-2029, accelerating at a CAGR of 3.7% during the forecast period. The report on the raw coffee beans market provides a holistic analysis, market size and forecast, trends, growth drivers, and challenges, as well as vendor analysis covering around 25 vendors.
The report offers an up-to-date analysis regarding the current market scenario, the latest trends and drivers, and the overall market environment. The market is driven by growing number of cafes worldwide, rising popularity of coffee among millennials, and increasing demand for premium coffee.
| Market Scope | |
|---|---|
| Base Year | 2025 |
| End Year | 2029 |
| Series Year | 2025-2029 |
| Growth Momentum | Accelerate |
| YOY 2025 | 3.7% |
| CAGR | 3.7% |
| Incremental Value | $8063.7 mn |
Technavio's raw coffee beans market is segmented as below:
By Type
- Arabica
- Robusta
By Method
- Wet/Washed process
- Dry/Natural process
- Honey process
By Geographical Landscape
- South America
- APAC
- Middle East and Africa
- North America
- Europe
This study identifies the growing demand for sustainable and ethically sourced coffee beans as one of the prime reasons driving the raw coffee beans market growth during the next few years. Also, increasing adoption of precision agriculture techniques for coffee cultivation and rising popularity of coffee subscription model will lead to sizable demand in the market.
The report on the raw coffee beans market covers the following areas:
- Raw Coffee Beans Market sizing
- Raw Coffee Beans Market forecast
- Raw Coffee Beans Market industry analysis
The robust vendor analysis is designed to help clients improve their market position, and in line with this, this report provides a detailed analysis of several leading raw coffee beans market vendors that include Belco SA, Coffee Bean Corral, Dongsuh Companies Inc., FRINJ Coffee, GMT GREEN, Illycaffe Spa, jacobs DOUWE EGBERTS B.V., La Colombe Torrefaction Inc., LUIGI LAVAZZA SpA, Mayorga Coffee, Naivo Cafe, Neumann Gruppe GmbH, RAW Coffee Company LLC, Sangameshwar Coffee Estates Ltd., Strauss Group Ltd., Sweet Marias, The Green Coffee Co., Vuno Coffee, and WS Cafe. Also, the raw coffee beans market analysis report includes information on upcoming trends and challenges that will influence market growth. This is to help companies strategize and leverage all forthcoming growth opportunities.
The study was conducted using an objective combination of primary and secondary information including inputs from key participants in the industry. The report contains a comprehensive market and vendor landscape in addition to an analysis of the key vendors.
The publisher presents a detailed picture of the market by the way of study, synthesis, and summation of data from multiple sources by an analysis of key parameters such as profit, pricing, competition, and promotions. It presents various market facets by identifying the key industry influencers. The data presented is comprehensive, reliable, and a result of extensive primary and secondary research. The market research reports provide a complete competitive landscape and an in-depth vendor selection methodology and analysis using qualitative and quantitative research to forecast accurate market growth.
Table of Contents
1 Executive Summary
- 1.1 Market overview
- Executive Summary - Chart on Market Overview
- Executive Summary - Data Table on Market Overview
- Executive Summary - Chart on Global Market Characteristics
- Executive Summary - Chart on Market By Geographical Landscape
- Executive Summary - Chart on Market Segmentation by Type
- Executive Summary - Chart on Market Segmentation by Method
- Executive Summary - Chart on Incremental Growth
- Executive Summary - Data Table on Incremental Growth
- Executive Summary - Chart on Company Market Positioning
2 Technavio Analysis
- 2.1 Analysis of price sensitivity, lifecycle, customer purchase basket, adoption rates, and purchase criteria
- Analysis of price sensitivity, lifecycle, customer purchase basket, adoption rates, and purchase criteria
- 2.2 Criticality of inputs and Factors of differentiation
- Overview on criticality of inputs and factors of differentiation
- 2.3 Factors of disruption
- Overview on factors of disruption
- 2.4 Impact of drivers and challenges
- Impact of drivers and challenges in 2024 and 2029
3 Market Landscape
- 3.1 Market ecosystem
- Parent Market
- Data Table on - Parent Market
- 3.2 Market characteristics
- Market characteristics analysis
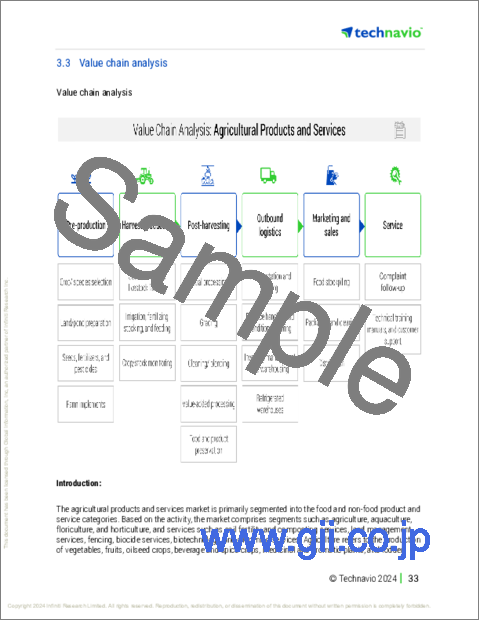
- 3.3 Value chain analysis
- Value chain analysis
4 Market Sizing
- 4.1 Market definition
- Offerings of companies included in the market definition
- 4.2 Market segment analysis
- Market segments
- 4.3 Market size 2024
- 4.4 Market outlook: Forecast for 2024-2029
- Chart on Global - Market size and forecast 2024-2029 ($ million)
- Data Table on Global - Market size and forecast 2024-2029 ($ million)
- Chart on Global Market: Year-over-year growth 2024-2029 (%)
- Data Table on Global Market: Year-over-year growth 2024-2029 (%)
5 Historic Market Size
- 5.1 Global Raw Coffee Beans Market 2019 - 2023
- Historic Market Size - Data Table on Global Raw Coffee Beans Market 2019 - 2023 ($ million)
- 5.2 Type segment analysis 2019 - 2023
- Historic Market Size - Type Segment 2019 - 2023 ($ million)
- 5.3 Method segment analysis 2019 - 2023
- Historic Market Size - Method Segment 2019 - 2023 ($ million)
- 5.4 Geography segment analysis 2019 - 2023
- Historic Market Size - Geography Segment 2019 - 2023 ($ million)
- 5.5 Country segment analysis 2019 - 2023
- Historic Market Size - Country Segment 2019 - 2023 ($ million)
6 Qualitative Analysis
- 6.1 The AI impact on global raw coffee beans market
7 Five Forces Analysis
- 7.1 Five forces summary
- Five forces analysis - Comparison between 2024 and 2029
- 7.2 Bargaining power of buyers
- Bargaining power of buyers - Impact of key factors 2024 and 2029
- 7.3 Bargaining power of suppliers
- Bargaining power of suppliers - Impact of key factors in 2024 and 2029
- 7.4 Threat of new entrants
- Threat of new entrants - Impact of key factors in 2024 and 2029
- 7.5 Threat of substitutes
- Threat of substitutes - Impact of key factors in 2024 and 2029
- 7.6 Threat of rivalry
- Threat of rivalry - Impact of key factors in 2024 and 2029
- 7.7 Market condition
- Chart on Market condition - Five forces 2024 and 2029
8 Market Segmentation by Type
- 8.1 Market segments
- Chart on Type - Market share 2024-2029 (%)
- Data Table on Type - Market share 2024-2029 (%)
- 8.2 Comparison by Type
- Chart on Comparison by Type
- Data Table on Comparison by Type
- 8.3 Arabica - Market size and forecast 2024-2029
- Chart on Arabica - Market size and forecast 2024-2029 ($ million)
- Data Table on Arabica - Market size and forecast 2024-2029 ($ million)
- Chart on Arabica - Year-over-year growth 2024-2029 (%)
- Data Table on Arabica - Year-over-year growth 2024-2029 (%)
- 8.4 Robusta - Market size and forecast 2024-2029
- Chart on Robusta - Market size and forecast 2024-2029 ($ million)
- Data Table on Robusta - Market size and forecast 2024-2029 ($ million)
- Chart on Robusta - Year-over-year growth 2024-2029 (%)
- Data Table on Robusta - Year-over-year growth 2024-2029 (%)
- 8.5 Market opportunity by Type
- Market opportunity by Type ($ million)
- Data Table on Market opportunity by Type ($ million)
9 Market Segmentation by Method
- 9.1 Market segments
- Chart on Method - Market share 2024-2029 (%)
- Data Table on Method - Market share 2024-2029 (%)
- 9.2 Comparison by Method
- Chart on Comparison by Method
- Data Table on Comparison by Method
- 9.3 Wet/Washed process - Market size and forecast 2024-2029
- Chart on Wet/Washed process - Market size and forecast 2024-2029 ($ million)
- Data Table on Wet/Washed process - Market size and forecast 2024-2029 ($ million)
- Chart on Wet/Washed process - Year-over-year growth 2024-2029 (%)
- Data Table on Wet/Washed process - Year-over-year growth 2024-2029 (%)
- 9.4 Dry/Natural process - Market size and forecast 2024-2029
- Chart on Dry/Natural process - Market size and forecast 2024-2029 ($ million)
- Data Table on Dry/Natural process - Market size and forecast 2024-2029 ($ million)
- Chart on Dry/Natural process - Year-over-year growth 2024-2029 (%)
- Data Table on Dry/Natural process - Year-over-year growth 2024-2029 (%)
- 9.5 Honey process - Market size and forecast 2024-2029
- Chart on Honey process - Market size and forecast 2024-2029 ($ million)
- Data Table on Honey process - Market size and forecast 2024-2029 ($ million)
- Chart on Honey process - Year-over-year growth 2024-2029 (%)
- Data Table on Honey process - Year-over-year growth 2024-2029 (%)
- 9.6 Market opportunity by Method
- Market opportunity by Method ($ million)
- Data Table on Market opportunity by Method ($ million)
10 Customer Landscape
- 10.1 Customer landscape overview
- Analysis of price sensitivity, lifecycle, customer purchase basket, adoption rates, and purchase criteria
11 Geographic Landscape
- 11.1 Geographic segmentation
- Chart on Market share By Geographical Landscape 2024-2029 (%)
- Data Table on Market share By Geographical Landscape 2024-2029 (%)
- 11.2 Geographic comparison
- Chart on Geographic comparison
- Data Table on Geographic comparison
- 11.3 South America - Market size and forecast 2024-2029
- Chart on South America - Market size and forecast 2024-2029 ($ million)
- Data Table on South America - Market size and forecast 2024-2029 ($ million)
- Chart on South America - Year-over-year growth 2024-2029 (%)
- Data Table on South America - Year-over-year growth 2024-2029 (%)
- 11.4 APAC - Market size and forecast 2024-2029
- Chart on APAC - Market size and forecast 2024-2029 ($ million)
- Data Table on APAC - Market size and forecast 2024-2029 ($ million)
- Chart on APAC - Year-over-year growth 2024-2029 (%)
- Data Table on APAC - Year-over-year growth 2024-2029 (%)
- 11.5 Middle East and Africa - Market size and forecast 2024-2029
- Chart on Middle East and Africa - Market size and forecast 2024-2029 ($ million)
- Data Table on Middle East and Africa - Market size and forecast 2024-2029 ($ million)
- Chart on Middle East and Africa - Year-over-year growth 2024-2029 (%)
- Data Table on Middle East and Africa - Year-over-year growth 2024-2029 (%)
- 11.6 North America - Market size and forecast 2024-2029
- Chart on North America - Market size and forecast 2024-2029 ($ million)
- Data Table on North America - Market size and forecast 2024-2029 ($ million)
- Chart on North America - Year-over-year growth 2024-2029 (%)
- Data Table on North America - Year-over-year growth 2024-2029 (%)
- 11.7 Europe - Market size and forecast 2024-2029
- Chart on Europe - Market size and forecast 2024-2029 ($ million)
- Data Table on Europe - Market size and forecast 2024-2029 ($ million)
- Chart on Europe - Year-over-year growth 2024-2029 (%)
- Data Table on Europe - Year-over-year growth 2024-2029 (%)
- 11.8 Brazil - Market size and forecast 2024-2029
- Chart on Brazil - Market size and forecast 2024-2029 ($ million)
- Data Table on Brazil - Market size and forecast 2024-2029 ($ million)
- Chart on Brazil - Year-over-year growth 2024-2029 (%)
- Data Table on Brazil - Year-over-year growth 2024-2029 (%)
- 11.9 Vietnam - Market size and forecast 2024-2029
- Chart on Vietnam - Market size and forecast 2024-2029 ($ million)
- Data Table on Vietnam - Market size and forecast 2024-2029 ($ million)
- Chart on Vietnam - Year-over-year growth 2024-2029 (%)
- Data Table on Vietnam - Year-over-year growth 2024-2029 (%)
- 11.10 Colombia - Market size and forecast 2024-2029
- Chart on Colombia - Market size and forecast 2024-2029 ($ million)
- Data Table on Colombia - Market size and forecast 2024-2029 ($ million)
- Chart on Colombia - Year-over-year growth 2024-2029 (%)
- Data Table on Colombia - Year-over-year growth 2024-2029 (%)
- 11.11 Ecuador - Market size and forecast 2024-2029
- Chart on Ecuador - Market size and forecast 2024-2029 ($ million)
- Data Table on Ecuador - Market size and forecast 2024-2029 ($ million)
- Chart on Ecuador - Year-over-year growth 2024-2029 (%)
- Data Table on Ecuador - Year-over-year growth 2024-2029 (%)
- 11.12 Indonesia - Market size and forecast 2024-2029
- Chart on Indonesia - Market size and forecast 2024-2029 ($ million)
- Data Table on Indonesia - Market size and forecast 2024-2029 ($ million)
- Chart on Indonesia - Year-over-year growth 2024-2029 (%)
- Data Table on Indonesia - Year-over-year growth 2024-2029 (%)
- 11.13 Ethiopia - Market size and forecast 2024-2029
- Chart on Ethiopia - Market size and forecast 2024-2029 ($ million)
- Data Table on Ethiopia - Market size and forecast 2024-2029 ($ million)
- Chart on Ethiopia - Year-over-year growth 2024-2029 (%)
- Data Table on Ethiopia - Year-over-year growth 2024-2029 (%)
- 11.14 Cote dIvoire - Market size and forecast 2024-2029
- Chart on Cote dIvoire - Market size and forecast 2024-2029 ($ million)
- Data Table on Cote dIvoire - Market size and forecast 2024-2029 ($ million)
- Chart on Cote dIvoire - Year-over-year growth 2024-2029 (%)
- Data Table on Cote dIvoire - Year-over-year growth 2024-2029 (%)
- 11.15 Peru - Market size and forecast 2024-2029
- Chart on Peru - Market size and forecast 2024-2029 ($ million)
- Data Table on Peru - Market size and forecast 2024-2029 ($ million)
- Chart on Peru - Year-over-year growth 2024-2029 (%)
- Data Table on Peru - Year-over-year growth 2024-2029 (%)
- 11.16 Nigeria - Market size and forecast 2024-2029
- Chart on Nigeria - Market size and forecast 2024-2029 ($ million)
- Data Table on Nigeria - Market size and forecast 2024-2029 ($ million)
- Chart on Nigeria - Year-over-year growth 2024-2029 (%)
- Data Table on Nigeria - Year-over-year growth 2024-2029 (%)
- 11.17 Cameroon - Market size and forecast 2024-2029
- Chart on Cameroon - Market size and forecast 2024-2029 ($ million)
- Data Table on Cameroon - Market size and forecast 2024-2029 ($ million)
- Chart on Cameroon - Year-over-year growth 2024-2029 (%)
- Data Table on Cameroon - Year-over-year growth 2024-2029 (%)
- 11.18 Market opportunity By Geographical Landscape
- Market opportunity By Geographical Landscape ($ million)
- Data Tables on Market opportunity By Geographical Landscape ($ million)
12 Drivers, Challenges, and Opportunity/Restraints
- 12.1 Market drivers
- 12.2 Market challenges
- 12.3 Impact of drivers and challenges
- Impact of drivers and challenges in 2024 and 2029
- 12.4 Market opportunities/restraints
13 Competitive Landscape
- 13.1 Overview
- 13.2 Competitive Landscape
- Overview on criticality of inputs and factors of differentiation
- 13.3 Landscape disruption
- Overview on factors of disruption
- 13.4 Industry risks
- Impact of key risks on business
14 Competitive Analysis
- 14.1 Companies profiled
- Companies covered
- 14.2 Company ranking index
- Company ranking index
- 14.3 Market positioning of companies
- Matrix on companies position and classification
- 14.4 Belco SA
- Belco SA - Overview
- Belco SA - Product / Service
- Belco SA - Key offerings
- SWOT
- 14.5 Dongsuh Companies Inc.
- Dongsuh Companies Inc. - Overview
- Dongsuh Companies Inc. - Product / Service
- Dongsuh Companies Inc. - Key offerings
- SWOT
- 14.6 Illycaffe Spa
- Illycaffe Spa - Overview
- Illycaffe Spa - Product / Service
- Illycaffe Spa - Key offerings
- SWOT
- 14.7 jacobs DOUWE EGBERTS B.V.
- jacobs DOUWE EGBERTS B.V. - Overview
- jacobs DOUWE EGBERTS B.V. - Product / Service
- jacobs DOUWE EGBERTS B.V. - Key offerings
- SWOT
- 14.8 La Colombe Torrefaction Inc.
- La Colombe Torrefaction Inc. - Overview
- La Colombe Torrefaction Inc. - Product / Service
- La Colombe Torrefaction Inc. - Key offerings
- SWOT
- 14.9 LUIGI LAVAZZA SpA
- LUIGI LAVAZZA SpA - Overview
- LUIGI LAVAZZA SpA - Product / Service
- LUIGI LAVAZZA SpA - Key offerings
- SWOT
- 14.10 Mayorga Coffee
- Mayorga Coffee - Overview
- Mayorga Coffee - Product / Service
- Mayorga Coffee - Key offerings
- SWOT
- 14.11 Neumann Gruppe GmbH
- Neumann Gruppe GmbH - Overview
- Neumann Gruppe GmbH - Product / Service
- Neumann Gruppe GmbH - Key offerings
- SWOT
- 14.12 RAW Coffee Company LLC
- RAW Coffee Company LLC - Overview
- RAW Coffee Company LLC - Product / Service
- RAW Coffee Company LLC - Key offerings
- SWOT
- 14.13 Strauss Group Ltd.
- Strauss Group Ltd. - Overview
- Strauss Group Ltd. - Business segments
- Strauss Group Ltd. - Key offerings
- Strauss Group Ltd. - Segment focus
- SWOT
- 14.14 Sweet Marias
- Sweet Marias - Overview
- Sweet Marias - Product / Service
- Sweet Marias - Key offerings
- SWOT
- 14.15 The Green Coffee Co.
- The Green Coffee Co. - Overview
- The Green Coffee Co. - Product / Service
- The Green Coffee Co. - Key offerings
- SWOT
- 14.16 Vuno Coffee
- Vuno Coffee - Overview
- Vuno Coffee - Product / Service
- Vuno Coffee - Key offerings
- SWOT
- 14.17 WS Cafe
- WS Cafe - Overview
- WS Cafe - Product / Service
- WS Cafe - Key offerings
- SWOT
15 Appendix
- 15.1 Scope of the report
- 15.2 Inclusions and exclusions checklist
- Inclusions checklist
- Exclusions checklist
- 15.3 Currency conversion rates for US$
- Currency conversion rates for US$
- 15.4 Research methodology
- Research methodology
- 15.5 Data procurement
- Information sources
- 15.6 Data validation
- Data validation
- 15.7 Validation techniques employed for market sizing
- Validation techniques employed for market sizing
- 15.8 Data synthesis
- Data synthesis
- 15.9 360 degree market analysis
- 360 degree market analysis
- 15.10 List of abbreviations
- List of abbreviations

