|
|
市場調査レポート
商品コード
1444836
生コーヒー豆:市場シェア分析、業界動向と統計、成長予測(2024~2029年)Raw Coffee Beans - Market Share Analysis, Industry Trends & Statistics, Growth Forecasts (2024 - 2029) |
||||||
|
|||||||
カスタマイズ可能
適宜更新あり
|
|||||||

| 生コーヒー豆:市場シェア分析、業界動向と統計、成長予測(2024~2029年) |
|
出版日: 2024年02月15日
発行: Mordor Intelligence
ページ情報: 英文 130 Pages
納期: 2~3営業日
|

全表示
- 概要
- 目次
概要
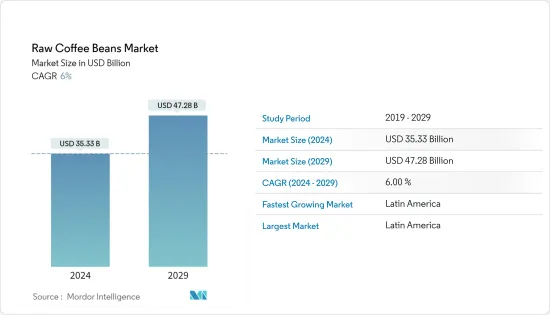
生コーヒー豆市場規模は2024年に353億3,000万米ドルと推定され、2029年までに472億8,000万米ドルに達すると予測されており、予測期間(2024年から2029年)中に6%のCAGRで成長します。
主なハイライト
- コーヒー豆は世界中に出荷される世界の農産物であり、何百万ものコーヒー栽培者や生産者の生計を支えています。コーヒーの生産は新興諸国に集中していますが、その消費は主に先進国と新興国で行われています。コロナウイルスによる制限により出荷の遅延と運賃の値上がりが発生し、農産物を低価格で受け取ることが多い小規模農家にとって陸送が困難になった。
- インドネシアのコーヒー農業コミュニティは、市場の不安定性、気候変動、ジェンダー不平等が農村コミュニティと農業企業に重大な課題をもたらしているため、重複する危機に直面しています。そのため、2022年に米国政府は米国国際開発庁(USAID)を通じて、キューリグ・ドクター・ペッパーおよび米国NGOのルート・キャピタルとの新たなパートナーシップであるインドネシア・コーヒー・エンタープライズ・レジリエンス・イニシアチブ(レジリエント・コーヒー)の立ち上げを発表しました。、農村地域の農業企業に信用を提供すること。レジリエントコーヒーは、経済的ニーズと環境の持続可能性のバランスをとった持続可能な成長を促進するため、アチェ、東ジャワ、北スマトラの14社のコーヒー企業を支援し、14,000の小規模農家にリーチします。これにより、今後数年間でコーヒー豆市場の生産が増加すると予想されます。
- 世界的に見て、欧州は生コーヒー豆の世界最大の消費国および輸出国であり、世界消費量の28%以上を占めています。コーヒー豆の世界市場の成長は、飲料として消費されたときの味によって促進されます。さらに、コーヒーに伴う健康上の利点と小売市場の拡大により、消費者が購入しやすくなり、世界のコーヒー豆市場が押し上げられます。長年にわたり、欧州は生のコーヒー豆の世界最大の消費国でした。アジア太平洋におけるコーヒー豆の需要は、消費量の増加によりここ数年で大幅に増加しています。日本、インド、フィリピンがその成長に大きく貢献しています。
生コーヒー豆市場動向
認証コーヒーの需要の増加
- コーヒーの調達と品質に対する消費者の関心の高まりにより、認証コーヒーの需要が世界的に増加しています。認証されたコーヒーは、製品の信頼性を消費者に保証します。これらの認証は、環境に優しい農業慣行とコーヒー生産時の品質に関して、消費者にさまざまな第三者保証を提供します。
- その結果、フェアトレード認証、レインフォレスト・アライアンス認証、UTZ認証、USDAオーガニック認証などの一部のコーヒー認証団体は、コーヒーの生産手順やサプライチェーンの監視に取り組んでいます。これらの認証は、労働者の生活の質を向上させ、認証コーヒーの取引の増加を通じて労働者が適切な市場アクセスを獲得するのに役立ちます。
- フェアトレードコーヒー生産者の多くは、環境的に持続可能な生産を保証するオーガニック認証も取得しています。インドネシアにはフェアトレード認証を受けたコーヒー協同組合が約25あり、そのうち98%がオーガニック認証を取得しています。オーガニック認証とフェアトレード認証を取得することで、コーヒー生産者にとって市場機会が増加し、持続可能なコーヒーにプレミアムを支払う消費者からより高い価格で取引できるようになります。
- すべての認証の中でも、UTZ認証または熱帯雨林同盟は、農家が地域社会と環境に配慮しながら専門的にコーヒーを栽培できるようにする重要な認証です。 UTZ認証プログラムの最も重要な側面はトレーサビリティです。これは、消費者が自分のコーヒーがどこから来たのか、どのように生産されたのかを正確に知ることができることを意味します。これにより、消費者は認証コーヒーを購入する傾向が高まり、それによって予測期間中の市場の成長が促進されます。
南米が輸出市場を独占
- 南米では、ブラジルは世界最大のコーヒー生産国および輸出国であり、2021年には6,990万袋で世界総生産量の40%を占めています。世界のコーヒー市場における主要な生産および輸出の役割により、ブラジルはまた、認知されています。自主持続可能性基準(VSS)と地理的識別(GI)に基づいた品質と社会的持続可能性パラメータへの取り組みが評価されています。 2021年、ブラジルは世界のコーヒー生産量の30.2%を占め、次いでベトナムとインドネシアがそれぞれ18.6%と7.7%となった。
- 食糧農業機関(FAO)によると、2021年のブラジルのコーヒー農園の面積は約11.3ヘクタールでした。ミナスジェライス州、エスピリトサント、サンパウロ、パラナ州が主なコーヒー生産地です。これらの地域では2021年に300万トンのコーヒーが生産され、そのうち230万トンが輸出されました。 2021年現在、ブラジルから生コーヒー豆を輸入している主な国は、米国(112万米ドル)、ドイツ(110万米ドル)、ベルギー(490万米ドル)、イタリア(480万米ドル)などです。ブラジルはコーヒーの第2位の消費国でもあります。
- ブラジルの主な輸出先には、ドイツ、米国、イタリア、ベルギー、日本が含まれます。コーヒー豆の他の主要な輸出国には、ベトナム、コロンビア、ドイツ、インドネシア、ホンジュラスなどがあります。しかし、経済的および社会的障壁の存在は、ブラジルのコーヒー農家が高品質で持続可能な戦略を採用するために生じる正しい価値の課題に加えて、他の市場コンプライアンスツールの中でも特に品質基準や地理的表示プロトコルを満たす農家にとって、顕著な課題となっています。
その他の特典
- エクセル形式の市場予測(ME)シート
- 3か月のアナリストサポート
目次
第1章 イントロダクション
- 調査の前提条件と市場の定義
- 調査範囲
第2章 調査手法
第3章 エグゼクティブサマリー
第4章 市場力学
- 市場概要
- 市場促進要因
- 市場抑制要因
- バリューチェーン/サプライチェーン分析
第5章 市場セグメンテーション
- 地域(数量による生産分析・消費分析・輸入分析・輸出分析、価格動向分析)
- 北米
- 米国
- カナダ
- メキシコ
- 欧州
- ドイツ
- 英国
- スペイン
- フランス
- イタリア
- ベルギー
- ロシア
- アジア太平洋
- 中国
- ベトナム
- インドネシア
- インド
- 日本
- 南米
- ブラジル
- コロンビア
- 中東とアフリカ
- ウガンダ
- エチオピア
- 北米
第6章 市場機会と将来の動向
目次
Product Code: 61597
The Raw Coffee Beans Market size is estimated at USD 35.33 billion in 2024, and is expected to reach USD 47.28 billion by 2029, growing at a CAGR of 6% during the forecast period (2024-2029).
Key Highlights
- Coffee beans are a global agricultural product shipped worldwide, providing livelihood for millions of coffee growers and producers. While coffee production is concentrated in developing countries, its consumption mainly occurs in developed and emerging economies. The coronavirus restrictions led to shipment delays and increased freight prices, and overland transportation became difficult for smallholder farmers who often receive low prices for their produce.
- Coffee farming communities in Indonesia face overlapping crises as market volatility, climate change, and gender inequity pose critical challenges to rural communities and agricultural enterprises. Therefore, in 2022, the US Government, through the US Agency for International Development (USAID), announced the launch of the Indonesia Coffee Enterprise Resilience Initiative (Resilient coffee), a new partnership with Keurig Dr. Pepper and Root Capital, a US NGO, to provide credit to agricultural enterprises in rural communities. Resilient coffee will support 14 coffee enterprises across Aceh, East Java, and North Sumatra, reaching 14,000 smallholder farmers as it promotes sustainable growth that balances economic needs with environmental sustainability. This is expected to boost the production of the coffee beans market in the coming years.
- Globally, Europe is the world's largest consumer and exporter of raw coffee beans, accounting for more than 28% of global consumption. The growth of the global market for coffee beans is driven by their taste when consumed as a beverage. Moreover, health benefits associated with coffee and retail market expansion make purchasing easy for consumers, boosting the global coffee bean market. For many years, Europe has been the world's largest consumer of raw coffee beans. The demand for coffee beans in Asia-Pacific has grown significantly over the years due to the increase in its consumption. Japan, India, and the Philippines are the major contributors to its growth.
Raw Coffee Beans Market Trends
Increasing Demand for Certified Coffee
- Due to rising consumer concerns regarding the sourcing and quality of coffee, the demand for certified coffee is increasing globally. Certified coffee is an assurance to the consumer about the reliability of the product. These certifications offer various third-party assurances to the consumer regarding environment-friendly farming practices and the quality involved during the production of coffee.
- As a result, some of the coffee certification organizations, such as Fair Trade Certification, Rainforest Alliance Certification, UTZ Certification, and USDA Organic Certification, are engaged in keeping a check on the production procedures and supply chain of coffee. These certifications help improve the quality of life of workers and help them gain adequate market access through increased trade of certified coffee.
- Many Fairtrade coffee growers also have organic certifications that ensure environmentally sustainable production. In Indonesia, around 25 Fairtrade-certified coffee cooperatives, and 98 percent of them have organic certifications. Having organic and Fairtrade certifications increase market opportunities for coffee growers and enable them to fetch higher prices from consumers willing to pay a premium for sustainable coffee.
- Among all the certifications, UTZ Certification or the rainforest alliance is an important certification that allows farmers to grow coffee professionally with care for local communities and the environment. The most important aspect of the UTZ certification program is traceability, which means that consumers can know exactly where their coffee comes from and how it was produced. This makes the consumers more inclined towards purchasing certified coffee, thereby fueling the growth of the market during the forecast period.
South America Dominates the Export Market
- In South America, Brazil is the world's largest coffee producer and exporter, responsible for 40% of the world's total production, with 69.9 million bags in 2021. Due to its major production and exportation role in the global coffee market, Brazil has also been recognized for its commitment to quality and social sustainability parameters based on voluntary sustainability standards (VSS) and geographic identification (GI). In 2021, Brazil held a share of 30.2% of the coffee production worldwide, followed by Vietnam and Indonesia, with 18.6% and 7.7%, respectively.
- According to Food and Agriculture Organization (FAO), coffee plantations in Brazil covered about 11.3 hectares in 2021. Minas Gerais, Espirito Santo, Sao Paulo, and Parana are the main coffee-producing regions. These regions produced 3 million metric tons of coffee in 2021, of which 2.3 million metric tons were exported. The major countries that imported raw coffee beans from Brazil as of 2021 were the United States (USD 1.12 million), Germany (USD 1.1 million), Belgium (USD 4.9 million), and Italy (USD 4.8 million), among others. Brazil is also the second-largest consumer of coffee.
- Brazil's major green bean export destinations include Germany, the United States, Italy, Belgium, and Japan. Other key exporters of coffee beans include Vietnam, Colombia, Germany, Indonesia, and Honduras. However, the existence of economic and social barriers plays salient challenges for farmers to meet the quality standards as well as GI protocols among other market compliance tools, in addition to the correct value appropriation arising for quality sustainable adopted strategies by coffee farmers in Brazil.
Additional Benefits:
- The market estimate (ME) sheet in Excel format
- 3 months of analyst support
TABLE OF CONTENTS
1 INTRODUCTION
- 1.1 Study Assumptions and Market Definition
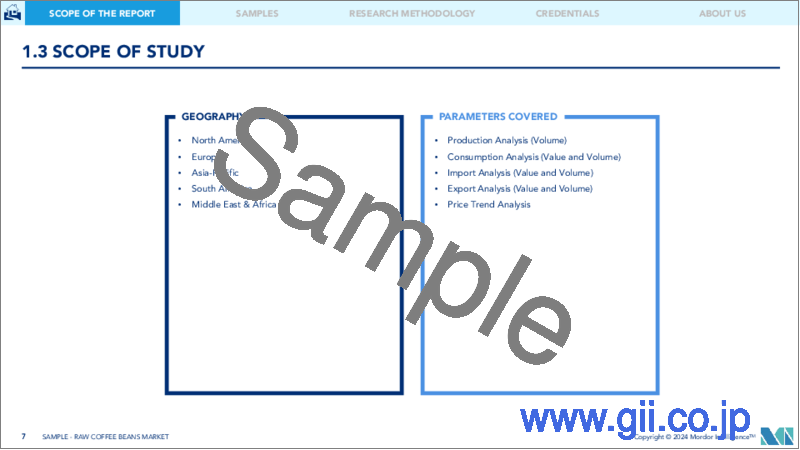
- 1.2 Scope of the Study
2 RESEARCH METHODOLOGY
3 EXECUTIVE SUMMARY
4 MARKET DYNAMICS
- 4.1 Market Overview
- 4.2 Market Drivers
- 4.3 Market Restraints
- 4.4 Value Chain/Supply Chain Analysis
5 MARKET SEGMENTATION
- 5.1 Geography (Production Analysis by Volume, Consumption Analysis by Value and Volume, Import Analysis by Value and Volume, Export Analysis by Value and Volume, and Price Trend Analysis)
- 5.1.1 North America
- 5.1.1.1 United States
- 5.1.1.2 Canada
- 5.1.1.3 Mexico
- 5.1.2 Europe
- 5.1.2.1 Germany
- 5.1.2.2 United Kingdom
- 5.1.2.3 Spain
- 5.1.2.4 France
- 5.1.2.5 Italy
- 5.1.2.6 Belgium
- 5.1.2.7 Russia
- 5.1.3 Asia-Pacific
- 5.1.3.1 China
- 5.1.3.2 Vietnam
- 5.1.3.3 Indonesia
- 5.1.3.4 India
- 5.1.3.5 Japan
- 5.1.4 South America
- 5.1.4.1 Brazil
- 5.1.4.2 Colombia
- 5.1.5 Middle-East and Africa
- 5.1.5.1 Uganda
- 5.1.5.2 Ethiopia
- 5.1.1 North America

