|
|
市場調査レポート
商品コード
1297838
植物性タンパク質の世界市場- 2023年~2030年Global Plant Protein Market - 2023-2030 |
||||||
|
|
|||||||
カスタマイズ可能
適宜更新あり
|
|||||||


| 植物性タンパク質の世界市場- 2023年~2030年 |
|
出版日: 2023年06月15日
発行: DataM Intelligence
ページ情報: 英文 195 Pages
納期: 即日から翌営業日
|

- 全表示
- 概要
- 目次
市場概要
世界の植物性タンパク質市場は、2022年に170億米ドルに達し、2030年には340億米ドルに達し、有利な成長を示すと予測されています。予測期間2023-2030年のCAGRは9.3%です。
植物性タンパク質は、心臓の健康状態の改善、体重管理、糖尿病、がん、高血圧などの慢性疾患のリスク低減など、多くの健康上の利点を提供します。また、動物性タンパク質よりも手頃な価格で入手できることが多いため、多くの消費者にとって身近な選択肢となっており、植物性タンパク質市場で大規模な売上を生み出しています。
大豆プロテイン、エンドウ豆プロテイン、小麦プロテイン、米プロテイン、ジャガイモプロテイン、麻プロテイン、ひよこ豆プロテイン、そら豆プロテインなどが主な植物性プロテインの一部です。ひよこ豆はガルバンゾ豆とも呼ばれ、タンパク質、食物繊維、各種必須ビタミン、ミネラルが豊富なマメ科の植物です。調理したひよこ豆1カップ(164グラム)からは、15グラムのタンパク質、12グラムの食物繊維、鉄、リン、マンガンを含む複数のビタミンとミネラルが摂取でき、これが植物性タンパク質市場規模を牽引しています。
市場力学
新たなタンパク質源としての水生植物への注目
水生植物は、植物性タンパク質やその他の必須栄養素の優れた供給源です。例えば、スピルリナは藍藻類の一種で、粉末や錠剤の形で販売されていることが多いです。スピルリナは、9種類の必須アミノ酸をすべて含む完全タンパク質です。大さじ1杯(7グラム)の乾燥スピルリナは、4グラムのタンパク質、1グラムの食物繊維、ビタミンB12、鉄、カルシウムを含む様々な必須ビタミンやミネラルを提供し、植物性タンパク質市場規模を牽引しています。
一方、クロレラも緑藻類の一種で、粉末や錠剤で販売されています。それは、ビタミンA、B12とC、鉄、葉緑素を含むタンパク質や他の必須栄養素の良い供給源です。大さじ1杯(7グラム)の乾燥クロレラは、3グラムのタンパク質、1グラムの食物繊維、および様々なビタミンやミネラルを提供し、予測期間における植物性タンパク質市場を推進しています。
植物性タンパク質源に対するアレルギーが市場を阻害します
大豆は一般的なアレルゲンであり、多くの人が大豆、大豆製品、大豆ベースのタンパク質サプリメントにアレルギーを持っています。大豆アレルギーの症状には、じんましん、かゆみ、唇、舌、喉の腫れ、腹痛、呼吸困難などがあります。
ピーナッツも一般的なアレルゲンで、人によっては重篤なアレルギー反応を引き起こすことがあります。ピーナッツアレルギーの症状には、じんましん、唇、舌、のどの腫れ、腹痛、呼吸困難などがあり、市場拡大を阻害します。
人工知能による分析
植物性タンパク質の品質を正確に予測するために、AIが利用されています。Journal of Agricultural and Food Chemistry誌に掲載されたある研究では、AIを使って様々な植物性タンパク質のアミノ酸プロファイルを分析し、タンパク質の品質スコアを予測しました。この研究では、AIモデルが87~93%の精度でタンパク質の品質スコアを予測できることがわかっています。
AIはまた、植物性タンパク質の抽出プロセスの最適化にも使用されています。Journal of Food Engineering誌に掲載された別の研究では、AIを使ってエンドウ豆タンパク質の抽出プロセスを最適化しました。この研究では、AIモデルが最適な抽出条件を特定することができ、その結果、従来の抽出方法と比較してタンパク質収量が15%増加しました。
目次
第1章 調査手法と範囲
第2章 定義と概要
第3章 エグゼクティブサマリー
第4章 市場力学
- 影響を与える要因
- 促進要因
- 新たなタンパク質源として水生植物に焦点を当てる
- 抑制要因
- 大豆や小麦などの植物由来のタンパク質源に対するアレルギーが市場の妨げとなっている
- 機会
- タンパク質生産のための工場への新たな投資
- 影響分析
- 促進要因
第5章 業界分析
- ポーターのファイブフォース分析
- サプライチェーン分析
- 価格分析
- 規制分析
第6章 COVID-19の分析
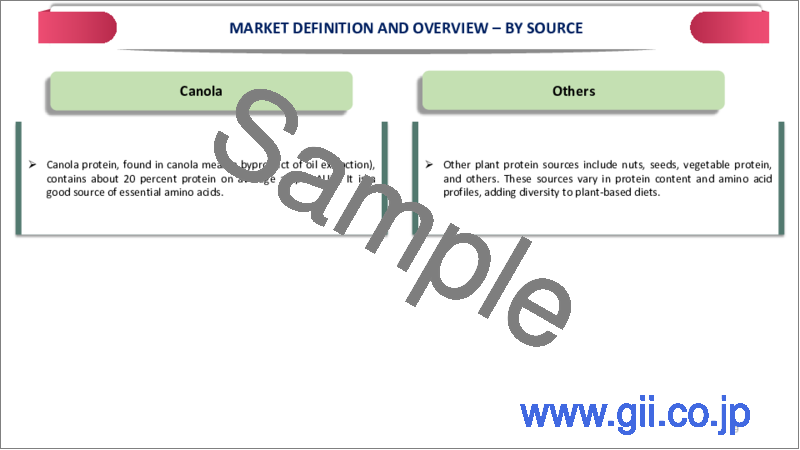
第7章 ソース別
- 小麦たんぱく質
- 大豆たんぱく質
- エンドウ豆プロテイン
- その他の植物性たんぱく質
- ナッツと種
第8章 タイプ別
- タンパク質分離物
- タンパク質濃縮物
- テクスチャードプロテイン
第9章 アプリケーション別
- 食品成分
- エネルギー・スポーツドリンクその他
- 肉類似品
- 飲料
- ベーカリー・菓子類
- RTE
- 医薬品
- 動物の飼料
第10章 地域別
- 北米
- 米国
- カナダ
- メキシコ
- 欧州
- ドイツ
- 英国
- フランス
- イタリア
- スペイン
- その他欧州
- 南米
- ブラジル
- アルゼンチン
- その他南米
- アジア太平洋
- 中国
- インド
- 日本
- オーストラリア
- その他アジア太平洋地域
- 中東とアフリカ
第11章 競合情勢
- 競合シナリオ
- 市場ポジショニング/シェア分析
- 合併と買収の分析
第12章 企業プロファイル
- Archer Daniels Midland Company
- 会社概要
- グレードのポートフォリオと説明
- 財務概要
- 主な発展
- Kerry Group
- Cargill Incorporated
- EI Du Pont de company
- Omega Protein Corporation
- Amco Proteins
- Scoular Company's Food Ingredient
- Reliance Private label supplements
- Axiom's Foods
- Roquette Foods
第13章 付録
Market Overview
The Global Plant Protein Market reached US$ 17 billion in 2022 and is projected to witness lucrative growth by reaching up to US$ 34 billion by 2030. The market is growing at a CAGR of 9.3% during the forecast period 2023-2030.
Plant proteins offer many health benefits, including improved heart health, weight management, and reduced risk of chronic diseases such as diabetes, cancer, and hypertension. They are also often more affordable than animal proteins, making them an accessible option for many consumers, and creating massive sales in the plant protein market.
Soy protein, pea protein, wheat protein, rice protein, potato protein, hemp protein, chickpea protein and faba bean protein are some of the major plant proteins. Chickpeas, also known as garbanzo beans, are a type of legume rich in protein, fiber, and various essential vitamins and minerals. One cup of cooked chickpeas (164 grams) provides 15 grams of protein, 12 grams of fiber, and multiple vitamins and minerals, including iron, phosphorus, and manganese, which drives the plant protein market size.
Market Dynamics
The Focus on Aquatic Plants as New & Emerging Sources of Protein.
Aquatic plants are an excellent source of plant-based protein and other essential nutrients. For instance, Spirulina is a type of blue-green algae often sold in powder or tablet form. It is a complete protein containing all nine essential amino acids. One tablespoon (7 grams) of dried spirulina provides 4 grams of protein, 1 gram of fiber, and various essential vitamins and minerals, including vitamin B12, iron, and calcium which drives the plant protein market size.
On the other hand, Chlorella is another type of green algae often sold in powder or tablet form. It is a good source of protein and other essential nutrients, including vitamins A, B12 and C, iron, and chlorophyll. One tablespoon (7 grams) of dried chlorella provides 3 grams of protein, 1 gram of fiber, and various vitamins and minerals, driving the plant proteins market in the forecast period.
Allergies to Plant-Based Sources of Protein Hampers the Market.
Soy is a common allergen; many people are allergic to soybeans, soy products, and soy-based protein supplements. Soy allergy symptoms may include hives, itching, lips, tongue, or throat swelling, abdominal pain, and difficulty breathing.
Peanuts are also a common allergen and can cause severe allergic reactions in some individuals. Peanut allergy symptoms may include hives, lips, tongue, or throat swelling, abdominal pain, and difficulty breathing, impeding the market expansion.
Artificial Intelligence Analysis
AI has been used to accurately predict plant-based proteins' quality. One study published in the Journal of Agricultural and Food Chemistry used AI to analyze the amino acid profiles of different plant-based proteins and predict their protein quality scores. The study found that the AI model could predict protein quality scores with an 87-93% accuracy.
AI has also been used to optimize the extraction process of plant-based proteins. Another study published in the Journal of Food Engineering used AI to optimize the extraction process of pea protein. The study found that the AI model could identify the optimal extraction conditions, resulting in a 15% increase in protein yield compared to traditional extraction methods.
Segment Analysis
The Global Plant Protein Market is segmented based on type, source, application and region.
Soy Protein Segment Accounts Sizable Share in the Global Plant Protein Market
Soy protein is a complete protein containing all nine essential amino acids that bodies cannot produce independently. It is also one of the richest sources of plant-based protein, with a protein content of about 36 grams per 100 grams of soy protein isolate. Soy protein is low in fat, with just 2 grams of fat per 100 grams of soy protein isolate.
It is also cholesterol-free. For instance, on February 17, 2021, Life Health Foods launched soy protein in India. The well-known Almond Fresh line of almond milk has been incorporated under the hero So Good brand in addition to the new Protein+ Soy Beverage.
This product is a great addition to any diet because it tastes great and offers nutritional advantages. For those who prefer no-sugar options, So Good Almond Beverage has two flavors: almond coconut and natural unsweetened. You can find it in stores in packs of 1L and 200ml.
Geographical Analysis
Asia Pacific Holds the Largest Share in the Global Plant Protein Market
The global plant protein market is segmented by region into North America, South America, Europe, Asia-Pacific, Middle-east and America.
Regarding market growth for plant-based proteins, the Asia Pacific region accounts for approximately 42.8% during the forecast period. Religious considerations of people's diet and preferences for plant-based foods and proteins are primarily responsible for the growth of the plant-based protein industry in this region.
People have started including more plant-based protein in their diets due to the rise in cardiovascular and other types of heart diseases in the area. China and India, which account for a sizable portion of imports and production in the region due to their ready access to raw materials and affordable labor, have become important manufacturing hubs for companies that produce plant-based proteins.
For instance, on March 17, 2023, Nutricircle, an R&D and science-based company, launched nutrition-based plant protein isolates in India.
Competitive Landscape
The major global players include: Archer Daniels Midland Company, Axiom's Foods, Amco Proteins, Cargill Incorporated, E. I Du Pont de company, Glanbia Nutritionals, Growing Naturals, LLC, Kerry Group, Manitoba Harvest hemp foods, Omega Protein Corporation, Roquette Foods, Scoular Companys Food Ingredient, Sodrugestvo Groups, and Sunwarrior.
Why Purchase the Report?
- To visualize the Global Plant Protein Market segmentation based on type, source, application, and region and understand key commercial assets and players.
- Identify commercial opportunities by analyzing trends and co-development.
- Excel data sheet with numerous plant protein market-level data points with all segments.
- PDF report consists of a comprehensive analysis after exhaustive qualitative interviews and an in-depth study.
- Product mapping available as Excel consisting of key products of all the major players.
The Global Plant Protein Market Report Would Provide Approximately 53 Tables, 46 Figures And 195 pages.
Target Audience 2023
- Manufacturers/ Buyers
- Industry Investors/Investment Bankers
- Research Professionals
- Emerging Companies
Table of Contents
1. Methodology and Scope
- 1.1. Research Methodology
- 1.2. Research Objective and Scope of the Report
2. Definition and Overview
3. Executive Summary
- 3.1. Snippet by Type
- 3.2. Snippet by Source
- 3.3. Snippet by Application
- 3.4. Snippet by Region
4. Dynamics
- 4.1. Impacting Factors
- 4.1.1. Drivers
- 4.1.1.1. The focus on aquatic plants as new & emerging sources of protein
- 4.1.2. Restraints
- 4.1.2.1. The allergies to plant-based sources of protein, like soy and wheat hampers the market
- 4.1.3. Opportunity
- 4.1.3.1. The new investments in plants for the production of protein
- 4.1.4. Impact Analysis
- 4.1.1. Drivers
5. Industry Analysis
- 5.1. Porter's Five Force Analysis
- 5.2. Supply Chain Analysis
- 5.3. Pricing Analysis
- 5.4. Regulatory Analysis
6. COVID-19 Analysis
- 6.1. Analysis of COVID-19
- 6.1.1. Scenario Before COVID-19
- 6.1.2. Scenario During COVID-19
- 6.1.3. Post COVID-19 and Future Scenario
- 6.2. Pricing Dynamics Amid COVID-19
- 6.3. Demand-Supply Spectrum
- 6.4. Government Initiatives Related to the Market During Pandemic
- 6.5. Manufacturers Strategic Initiatives
- 6.6. Conclusion
7. By Source
- 7.1. Introduction
- 7.1.1. Market Size Analysis and Y-o-Y Growth Analysis (%), By Source
- 7.1.2. Market Attractiveness Index, By Source
- 7.2. Wheat Protein *
- 7.2.1. Introduction
- 7.2.2. Market Size Analysis and Y-o-Y Growth Analysis (%)
- 7.3. Soy Protein
- 7.4. Pea Protein
- 7.5. Other vegetable Protein
- 7.6. Nuts and seeds
8. By Type
- 8.1. Introduction
- 8.1.1. Market Size Analysis and Y-o-Y Growth Analysis (%), By Type
- 8.1.2. Market Attractiveness Index, By Type
- 8.2. Protein Isolate *
- 8.2.1. Introduction
- 8.2.2. Market Size Analysis and Y-o-Y Growth Analysis (%)
- 8.3. Protein Concentrate
- 8.4. Textured Protein
9. By Application
- 9.1. Introduction
- 9.1.1. Market Size Analysis and Y-o-Y Growth Analysis (%), By Application
- 9.1.2. Market Attractiveness Index, By Application
- 9.2. Food Ingredients *
- 9.2.1. Introduction
- 9.2.2. Market Size Analysis and Y-o-Y Growth Analysis (%)
- 9.2.3. Energy and sports drink Others
- 9.2.4. Meat Analogues
- 9.2.5. Beverages
- 9.2.6. Bakery and confectionery
- 9.2.7. Ready to eat
- 9.3. Pharmaceuticals
- 9.4. Animal Feed
10. By Region
- 10.1. Introduction
- 10.1.1. Market Size Analysis and Y-o-Y Growth Analysis (%), By Region
- 10.1.2. Market Attractiveness Index, By Region
- 10.2. North America
- 10.2.1. Introduction
- 10.2.2. Key Region-Specific Dynamics
- 10.2.3. Market Size Analysis and Y-o-Y Growth Analysis (%), By Type
- 10.2.4. Market Size Analysis and Y-o-Y Growth Analysis (%), By Source
- 10.2.5. Market Size Analysis and Y-o-Y Growth Analysis (%), By Application
- 10.2.6. Market Size Analysis and Y-o-Y Growth Analysis (%), By Country
- 10.2.6.1. The U.S.
- 10.2.6.2. Canada
- 10.2.6.3. Mexico
- 10.3. Europe
- 10.3.1. Introduction
- 10.3.2. Key Region-Specific Dynamics
- 10.3.3. Market Size Analysis and Y-o-Y Growth Analysis (%), By Type
- 10.3.4. Market Size Analysis and Y-o-Y Growth Analysis (%), By Source
- 10.3.5. Market Size Analysis and Y-o-Y Growth Analysis (%), By Application
- 10.3.6. Market Size Analysis and Y-o-Y Growth Analysis (%), By Country
- 10.3.6.1. Germany
- 10.3.6.2. The U.K.
- 10.3.6.3. France
- 10.3.6.4. Italy
- 10.3.6.5. Spain
- 10.3.6.6. Rest of Europe
- 10.4. South America
- 10.4.1. Introduction
- 10.4.2. Key Region-Specific Dynamics
- 10.4.3. Market Size Analysis and Y-o-Y Growth Analysis (%), By Type
- 10.4.4. Market Size Analysis and Y-o-Y Growth Analysis (%), By Source
- 10.4.5. Market Size Analysis and Y-o-Y Growth Analysis (%), By Application
- 10.4.6. Market Size Analysis and Y-o-Y Growth Analysis (%), By Country
- 10.4.6.1. Brazil
- 10.4.6.2. Argentina
- 10.4.6.3. Rest of South America
- 10.5. Asia-Pacific
- 10.6. Introduction
- 10.7. Key Region-Specific Dynamics
- 10.7.1. Market Size Analysis and Y-o-Y Growth Analysis (%), By Type
- 10.7.2. Market Size Analysis and Y-o-Y Growth Analysis (%), By Source
- 10.7.3. Market Size Analysis and Y-o-Y Growth Analysis (%), By Application
- 10.7.4. Market Size Analysis and Y-o-Y Growth Analysis (%), By Country
- 10.7.4.1. China
- 10.7.4.2. India
- 10.7.4.3. Japan
- 10.7.4.4. Australia
- 10.7.4.5. Rest of Asia-Pacific
- 10.8. Middle East and Africa
- 10.8.1. Introduction
- 10.8.2. Key Region-Specific Dynamics
- 10.8.3. Market Size Analysis and Y-o-Y Growth Analysis (%), By Type
- 10.8.4. Market Size Analysis and Y-o-Y Growth Analysis (%), By Source
- 10.8.5. Market Size Analysis and Y-o-Y Growth Analysis (%), By Application
11. Competitive Landscape
- 11.1. Competitive Scenario
- 11.2. Market Positioning/Share Analysis
- 11.3. Mergers and Acquisitions Analysis
12. Company Profiles
- 12.1. Archer Daniels Midland Company*
- 12.1.1. Company Overview
- 12.1.2. Grade Portfolio and Description
- 12.1.3. Financial Overview
- 12.1.4. Key Developments
- 12.2. Kerry Group
- 12.3. Cargill Incorporated
- 12.4. E.I Du Pont de company
- 12.5. Omega Protein Corporation
- 12.6. Amco Proteins
- 12.7. Scoular Company's Food Ingredient
- 12.8. Reliance Private label supplements
- 12.9. Axiom's Foods
- 12.10. Roquette Foods
LIST NOT EXHAUSTIVE
13. Appendix
- 13.1. About Us and Services
- 13.2. Contact Us