|
|
市場調査レポート
商品コード
1473831
世界の作物保護化学品市場Global Crop Protection Chemicals Market |
||||||
|
|||||||
|
|||||||

| 世界の作物保護化学品市場 |
|
出版日: 2024年05月03日
発行: BCC Research
ページ情報: 英文 124 Pages
納期: 即納可能
|

全表示
- 概要
- 図表
- 目次
世界の作物保護化学品の市場規模は、2023年の876億米ドルから、予測期間中は5.5%のCAGRで推移し、2028年末には1,147億米ドルの規模に成長すると予測されています。
地域別では、アジア太平洋市場は、2023年の364億米ドルから、同期間中は5.7%のCAGRで推移し、2028年末には480億米ドルに達すると予測されています。南米市場は、2023年の239億米ドルから、CAGR 6.1%で推移し、2028年末には323億米ドルに達すると予測されています。
当レポートでは、世界の作物保護化学品の市場を調査し、市場概要、法規制環境、市場影響因子および市場機会の分析、市場規模の推移・予測、各種区分・地域別の詳細分析、競合情勢、主要企業のプロファイルなどをまとめています。
目次
第1章 エグゼクティブサマリー
- 市場の展望
- 調査範囲
- 市場サマリー
第2章 市場概要
- 市場の定義
- 農薬の分類
- 持続可能なバイオベースの農薬
- 生物農薬の利点
- 農薬の重要性
第3章 市場力学
- 市場力学
- 市場促進要因
- 人口増加と食糧需要の増大
- 政府および規制機関による措置
- 技術の進歩
- 環境に優しいソリューションの需要の増加
- 新興市場
- 農業の持続可能な強化のための総合的病害虫管理
- 市場抑制要因
- 有機農業の台頭
- 農薬と農薬耐性
- 原材料価格の変動
- 市場機会
- バイオ農薬の需要の増加
- 精密農業における農薬の使用
第4章 規制状況
第5章 新興技術および開発
- 概要
- 新しい科学技術
- ドローン技術
- ナノ農薬
- AI、IoT、デジタルトランスフォーメーション
第6章 市場セグメント分析
- セグメント別内訳
- 市場分析:タイプ別
- 除草剤
- 殺虫剤
- 殺菌剤
- その他
- 市場分析:形態別
- 液体
- 乾燥/固体
- 市場分析:原料別
- 合成
- 天然/バイオベース
- 市場分析:適用技術別
- 葉用スプレー
- 粒剤散布
- 種子処理
- その他
- 市場分析:作物別
- 穀物
- 果物・野菜
- 油糧種子・豆類
- その他
- 地理的内訳
- 市場分析:地域別
- 北米
- 欧州・中東・アフリカ
- アジア太平洋
- 南米
第7章 競合情報
- 産業構造
- 市場シェア分析
- 戦略分析
- M&A活動の分析
第8章 作物保護化学品業界における持続可能性:ESGの観点
- 作物保護化学品分野におけるESG問題
- ESGパフォーマンス分析
- 環境パフォーマンス
- 社会的パフォーマンス
- ガバナンスパフォーマンス
- ESGに対する消費者の意識
- BCCによる総論
第9章 付録
- 調査手法
- 出典
- 参考文献
- 定義/分類
- 略語
- 企業プロファイル
- ADAMA
- BASF SE
- BAYER AG
- CHR. HANSEN A/S
- CORTEVA
- FMC CORP.
- NUFARM
- SUMITOMO CHEMICAL CO. LTD.
- SYNGENTA
- UPL
List of Tables
- Summary Table : Global Market for Crop Protection Chemicals, by Region, Through 2028
- Table 1 : Regulatory Bodies in the Global Crop Protection Chemical Market
- Table 2 : Global Crop Protection Chemical Market, by Type, Through 2028
- Table 3 : Global Crop Protection Chemical Market for Herbicides, by Region, Through 2028
- Table 4 : Global Crop Protection Chemical Market for Insecticides, by Region, Through 2028
- Table 5 : Global Crop Protection Chemical Market for Fungicides, by Region, Through 2028
- Table 6 : Global Market for Other Types of Crop Protection Chemicals, by Region, Through 2028
- Table 7 : Global Crop Protection Chemical Market, by Form, Through 2028
- Table 8 : Global Market for Liquid Form Crop Protection Chemicals, by Region, Through 2028
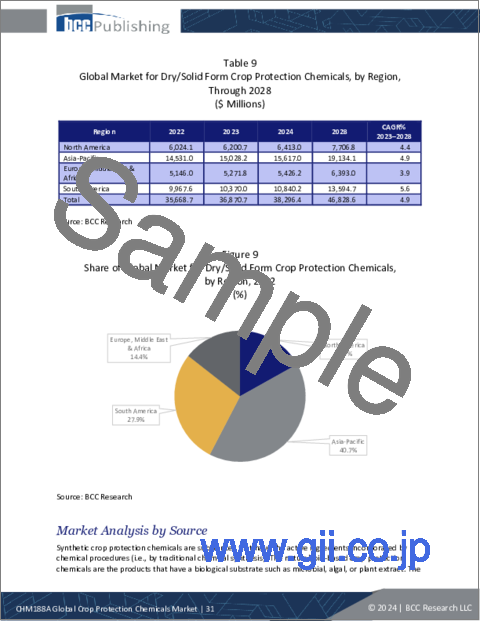
- Table 9 : Global Market for Dry/Solid Form Crop Protection Chemicals, by Region, Through 2028
- Table 10 : Global Crop Protection Chemical Market, by Source, Through 2028
- Table 11 : Global Market for Synthetic Crop Protection Chemicals, by Region, Through 2028
- Table 12 : Global Market for Natural/Bio-based Crop Protection Chemicals, by Region, Through 2028
- Table 13 : Global Crop Protection Chemical Market, by Application Technique, Through 2028
- Table 14 : Global Crop Protection Chemical Market for Foliar Spray Application, by Region, Through 2028
- Table 15 : Global Crop Protection Chemical Market for Granular Application, by Region, Through 2028
- Table 16 : Global Crop Protection Chemical Market for Seed Treatment Application, by Region, Through 2028
- Table 17 : Global Crop Protection Chemical Market for Other Applications, by Region, Through 2028
- Table 18 : Global Crop Protection Chemical Market, by Crop Type, Through 2028
- Table 19 : Global Crop Protection Chemical Market for Cereals and Grains, by Region, Through 2028
- Table 20 : Global Crop Protection Chemical Market for Fruits and Vegetables, by Region, Through 2028
- Table 21 : Global Crop Protection Chemical Market for Oilseeds and Pulses, by Region, Through 2028
- Table 22 : Global Crop Protection Chemical Market for Other Crop Types, by Region, Through 2028
- Table 23 : Global Crop Protection Chemical Market Volume, by Region, Through 2028
- Table 24 : Global Crop Protection Chemical Market, by Region, Through 2028
- Table 25 : North American Crop Protection Chemical Market, by Country, Through 2028
- Table 26 : North American Crop Protection Chemical Market, by Type, Through 2028
- Table 27 : North American Crop Protection Chemical Market, by Form, Through 2028
- Table 28 : North American Crop Protection Chemical Market, by Source, Through 2028
- Table 29 : North American Crop Protection Chemical Market, by Application Technique, Through 2028
- Table 30 : North American Crop Protection Chemical Market, by Crop Type, Through 2028
- Table 31 : EMEA Market for Crop Protection Chemicals, by Region, Through 2028
- Table 32 : EMEA Crop Protection Chemical Market, by Type, Through 2028
- Table 33 : EMEA Crop Protection Chemical Market, by Form, Through 2028
- Table 34 : EMEA Crop Protection Chemical Market, by Source, Through 2028
- Table 35 : EMEA Crop Protection Chemical Market, by Application Technique, Through 2028
- Table 36 : EMEA Crop Protection Chemical Market, by Crop Type, Through 2028
- Table 37 : Asia-Pacific Crop Protection Chemical Market, by Country, Through 2028
- Table 38 : Asia-Pacific Crop Protection Chemical Market, by Type, Through 2028
- Table 39 : Asia-Pacific Crop Protection Chemical Market, by Form, Through 2028
- Table 40 : Asia-Pacific Crop Protection Chemical Market, by Source, Through 2028
- Table 41 : Asia-Pacific Crop Protection Chemical Market, by Application Technique, Through 2028
- Table 42 : Asia-Pacific Crop Protection Chemical Market, by Crop Type, Through 2028
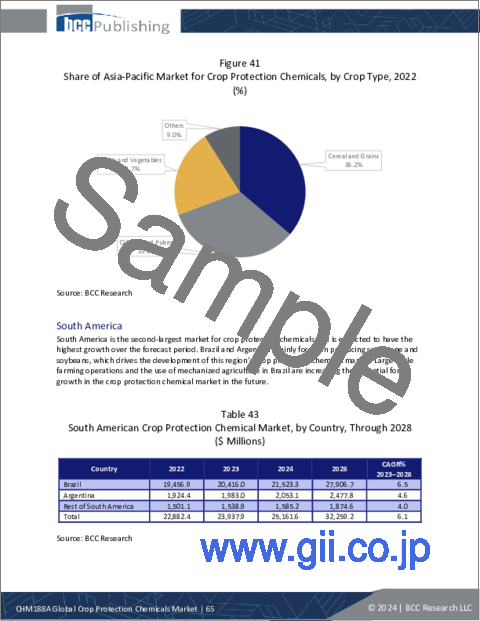
- Table 43 : South American Crop Protection Chemical Market, by Country, Through 2028
- Table 44 : South American Crop Protection Chemical Market, by Type, Through 2028
- Table 45 : South American Crop Protection Chemical Market, by Form, Through 2028
- Table 46 : South American Crop Protection Chemical Market, by Source, Through 2028
- Table 47 : South American Crop Protection Chemical Market, by Application Technique, Through 2028
- Table 48 : South American Crop Protection Chemical Market, by Crop Type, Through 2028
- Table 49 : Mergers and Acquisitions in the Global Crop Protection Chemical Market, January 2022-December 2023
- Table 50 : Environmental Performance Metrics in the Crop Protection Chemical Industry
- Table 51 : Social Performance Metrics in the Crop Protection Chemical Industry
- Table 52 : Governance Performance Metrics in the Crop Protection Chemical Industry
- Table 53 : ESG Risk Rating of Critical Players in the Crop Protection Chemical Market
- Table 54 : Report Information Sources
- Table 55 : Abbreviations Used in This Report
- Table 56 : ADAMA: Company Snapshot
- Table 57 : ADAMA: Financial Performance, FY 2021 and 2022
- Table 58 : ADAMA: Product Portfolio
- Table 59 : ADAMA: News/Key Developments, 2022-2024
- Table 60 : BASF SE: Company Snapshot
- Table 61 : BASF SE: Financial Performance, FY 2022 and 2023
- Table 62 : BASF SE: Product Portfolio
- Table 63 : BASF SE: News/Key Developments, 2022-2024
- Table 64 : Bayer AG: Company Snapshot
- Table 65 : Bayer AG: Financial Performance, FY 2022 and 2023
- Table 66 : Bayer AG: Product Portfolio
- Table 67 : Bayer AG: News/Key Developments, 2023
- Table 68 : Chr. Hansen A/S: Company Snapshot
- Table 69 : Chr. Hansen A/S: Financial Performance, FY 2021 and 2022
- Table 70 : Chr. Hansen A/S: Product Portfolio
- Table 71 : Chr. Hansen A/S: News/Key Developments, 2021
- Table 72 : Corteva: Company Snapshot
- Table 73 : Corteva: Financial Performance, FY 2022 and 2023
- Table 74 : Corteva: Product Portfolio
- Table 75 : Corteva: News/Key Developments, 2022 and 2023
- Table 76 : FMC Corp.: Company Snapshot
- Table 77 : FMC Corp.: Financial Performance, FY 2022 and 2023
- Table 78 : FMC Corp.: Product Portfolio
- Table 79 : FMC Corp.: News/Key Developments, 2021-2024
- Table 80 : Nufarm: Company Snapshot
- Table 81 : Nufarm: Financial Performance, FY 2022 and 2023
- Table 82 : Nufarm: Product Portfolio
- Table 83 : Nufarm: News/Key Developments, 2021 and 2022
- Table 84 : Sumitomo Chemical Co. Ltd.: Company Snapshot
- Table 85 : Sumitomo Chemical Co. Ltd.: Financial Performance, FY 2021 and 2022
- Table 86 : Sumitomo Chemical Co. Ltd.: Product Portfolio
- Table 87 : Sumitomo Chemical Co. Ltd.: News/Key Developments, 2023
- Table 88 : Syngenta: Company Snapshot
- Table 89 : Syngenta: Financial Performance, FY 2021 and 2022
- Table 90 : Syngenta: Product Portfolio
- Table 91 : Syngenta: News/Key Developments, 2021-2023
- Table 92 : UPL: Company Snapshot
- Table 93 : UPL: Financial Performance, FY 2021 and 2022
- Table 94 : UPL: Product Portfolio
- Table 95 : UPL: News/Key Developments, 2022 and 2023
List of Figures
- Summary Figure : Global Market for Crop Protection Chemicals, by Region, 2022-2028
- Figure 1 : Snapshot of the Market Dynamics for Global Crop Protection Chemical Market
- Figure 2 : Global Crop Protection Chemical Market Share, by Type, 2022
- Figure 3 : Share of Global Crop Protection Chemical Market for Herbicides, by Region, 2022
- Figure 4 : Share of Global Crop Protection Chemical Market for Insecticides, by Region, 2022
- Figure 5 : Share of Global Crop Protection Chemical Market for Fungicides, by Region, 2022
- Figure 6 : Share of Global Market for Other Types of Crop Protection Chemicals, by Region, 2022
- Figure 7 : Global Crop Protection Chemical Market Share, by Form, 2022
- Figure 8 : Share of Global Market for Liquid Form Crop Protection Chemicals, by Region, 2022
- Figure 9 : Share of Global Market for Dry/Solid Form Crop Protection Chemicals, by Region, 2022
- Figure 10 : Global Crop Protection Chemical Market Share, by Form, 2022
- Figure 11 : Share of Global Market for Synthetic Crop Protection Chemicals, by Region, 2022
- Figure 12 : Share of Global Market for Natural/Bio-based Crop Protection Chemicals, by Region, 2022
- Figure 13 : Global Crop Protection Chemical Market Share, by Application Technique, 2022
- Figure 14 : Share of Global Crop Protection Chemical Market for Foliar Spray Application, by Region, 2022
- Figure 15 : Share of Global Crop Protection Chemical Market for Granular Application, by Region, 2022
- Figure 16 : Share of Global Crop Protection Chemical Market for Seed Treatment Application, by Region, 2022
- Figure 17 : Share of Global Crop Protection Chemical Market for Other Applications, by Region, 2022
- Figure 18 : Global Crop Protection Chemical Market Share, by Crop Type, 2022
- Figure 19 : Share of Global Crop Protection Chemical Market for Cereals and Grains, by Region, 2022
- Figure 20 : Share of Global Crop Protection Chemical Market for Fruits and Vegetables, by Region, 2022
- Figure 21 : Share of Global Crop Protection Chemical Market for Oilseeds and Pulses, by Region, 2022
- Figure 22 : Share of Global Crop Protection Chemical Market for Other Crop Types, by Region, 2022
- Figure 23 : Share of Global Market for Crop Protection Chemicals Revenue, by Region, 2022
- Figure 24 : Share of North American Market for Crop Protection Chemicals, by Country, 2022
- Figure 25 : Share of North American Market for Crop Protection Chemicals, by Type, 2022
- Figure 26 : Share of North American Market for Crop Protection Chemicals, by Form, 2022
- Figure 27 : Share of North American Market for Crop Protection Chemicals, by Source, 2022
- Figure 28 : Share of North American Market for Crop Protection Chemicals, by Application Technique, 2022
- Figure 29 : Share of North American Market for Crop Protection Chemicals, by Crop Type, 2022
- Figure 30 : Share of EMEA Market for Crop Protection Chemicals, by Region, 2022
- Figure 31 : Share of EMEA Market for Crop Protection Chemicals, by Type, 2022
- Figure 32 : Share of EMEA Market for Crop Protection Chemicals, by Form, 2022
- Figure 33 : Share of EMEA Market for Crop Protection Chemicals, by Source, 2022
- Figure 34 : Share of EMEA Market for Crop Protection Chemicals, by Application Technique, 2022
- Figure 35 : Share of EMEA Market for Crop Protection Chemicals, by Crop Type, 2022
- Figure 36 : Share of Asia-Pacific Market for Crop Protection Chemicals, by Country, 2022
- Figure 37 : Share of Asia-Pacific Market for Crop Protection Chemicals, by Type, 2022
- Figure 38 : Share of Asia-Pacific Market for Crop Protection Chemicals, by Form, 2022
- Figure 39 : Share of Asia-Pacific Market for Crop Protection Chemicals, by Source, 2022
- Figure 40 : Share of Asia-Pacific Market for Crop Protection Chemicals, by Application Technique, 2022
- Figure 41 : Share of Asia-Pacific Market for Crop Protection Chemicals, by Crop Type, 2022
- Figure 42 : Share of South American Market for Crop Protection Chemicals, by Country, 2022
- Figure 43 : Shars of South American Market for Crop Protection Chemicals, by Type, 2022
- Figure 44 : Share of South American Market for Crop Protection Chemicals, by Form, 2022
- Figure 45 : Share of South American Market for Crop Protection Chemicals, by Source, 2022
- Figure 46 : Share of South American Market for Crop Protection Chemicals, by Application Technique, 2022
- Figure 47 : Share of South American Market for Crop Protection Chemicals, by Crop Type, 2022
- Figure 48 : Share of Global Market for Crop Protection Chemicals, by Company, 2022
- Figure 49 : ESG Perspective
- Figure 50 : ADAMA: Revenue Share, by Business Unit, FY 2022
- Figure 51 : ADAMA: Revenue Share, by Country/Region, FY 2022
- Figure 52 : BASF SE: Revenue Share, by Business Unit, FY 2023
- Figure 53 : BASF SE: Revenue Share, by Country/Region, FY 2023
- Figure 54 : Bayer AG: Revenue Share, by Business Unit, FY 2023
- Figure 55 : Bayer AG: Revenue Share, by Country/Region, FY 2023
- Figure 56 : Chr. Hansen A/S: Revenue Share, by Business Unit, FY 2022
- Figure 57 : Chr. Hansen A/S: Revenue Share, by Country/Region, FY 2022
- Figure 58 : Corteva: Revenue Share, by Business Unit, FY 2023
- Figure 59 : Corteva: Revenue Share, by Country/Region, FY 2023
- Figure 60 : FMC Corp.: Revenue Share, by Business Unit, FY 2023
- Figure 61 : FMC Corp.: Revenue Share, by Country/Region, FY 2023
- Figure 62 : Nufarm: Revenue Share, by Business Unit, FY 2023
- Figure 63 : Nufarm: Revenue Share, by Country/Region, FY 2023
- Figure 64 : Sumitomo Chemical Co. Ltd.: Revenue Share, by Business Unit, FY 2022
- Figure 65 : Sumitomo Chemical Co. Ltd.: Revenue Share, by Country/Region, FY 2022
- Figure 66 : Syngenta: Revenue Share, by Business Unit, FY 2022
- Figure 67 : Syngenta: Revenue Share, by Country/Region, FY 2022
- Figure 68 : UPL: Revenue Share, by Business Unit, FY 2022
- Figure 69 : UPL: Revenue Share, by Country/Region, FY 2022
The global market for crop protection chemicals is expected to grow from $87.6 billion in 2023 to $114.7 billion by the end of 2028, at a compound annual growth rate (CAGR) of 5.5% from 2023 to 2028.
The Asia-Pacific market for crop protection chemicals is expected to grow from $36.4 billion in 2023 to $48.0 billion by the end of 2028, at a CAGR of 5.7% from 2023 to 2028.
The South American market for crop protection chemicals is expected to grow from $23.9 billion in 2023 to $32.3 billion by the end of 2028, at a CAGR of 6.1% from 2023 to 2028.
Report Scope
In the dynamic landscape of agriculture, the crop protection chemical market stands as a crucial component. The foremost objective of crop protection chemicals is to safeguard crop yields against the detrimental impacts of pests, disease and weeds. By managing these challenges, farmers can ensure a stable and reliable production of crops, contributing to food security on a global scale. This report covers some of the parameters of crop protection chemicals monitored by industries and regulatory bodies due to their growing advances and developments in the agricultural sector.
BCC Research analyzed key categories and regions to determine the present and future crop protection chemical market status and forecasted market growth from 2023 to 2028. This report also discusses market strategies of key companies, ESG development, patents and market-driving forces.
The global crop protection chemical market is segmented into the following categories:
- Type (herbicides, insecticides, fungicides, others).
- Form (liquid, dry/solid).
- Source (synthetic, natural/bio-based).
- Application technique (foliage spray, granular application, seed treatment, others).
- Crop type (cereal and grains, fruits and vegetables, oilseed and pulses, others).
Report Includes
- 58 data tables and 38 additional tables
- An overview of the global market for crop protection chemicals
- Analysis of global market trends, featuring revenue data for 2022, estimates for 2023, forecasts for 2024 and 2026, and projected CAGRs through 2028
- Evaluation of the current market size and revenue growth prospects, along with a market share analysis by type, form, source, crop type, application technique, and region
- Discussion of advances in the agricultural sector, such as incorporation of biobased substrates into crop protection chemicals, and other emerging technologies
- Information on government regulations and mandates, and other economic trends
- Insight into overcoming challenges related to commercialization
- A look at ESG trends
- Analysis of key companies' market shares, proprietary technologies, alliances and patents
- Profiles of the leading players
Table of Contents
Chapter 1 Executive Summary
- Market Outlook
- Scope of Report
- Market Summary
Chapter 2 Market Overview
- Market Definition
- Classification of Crop Protection Chemicals
- Sustainable and Bio-based Crop Protection Chemicals
- Advantages of Biopesticides
- Importance of Crop Protection Chemicals
Chapter 3 Market Dynamics
- Market Dynamics
- Market Drivers
- Rising Population and Growing Demand for Food
- Actions by Governmental and Regulatory Organizations
- Technological Advances
- Increased Demand for Environmentally Friendly Solutions
- Emerging Market
- Integrated Pest Management for Agriculture's Sustainable Intensification
- Market Restraints
- Rise of Organic Farming
- Crop Protection Chemicals and Pesticide Resistance
- Volatility in Raw Material Prices
- Market Opportunities
- Growing Demand for Biopesticides
- Use of Crop Protection Chemicals in Precision Farming
Chapter 4 Regulatory Landscape
Chapter 5 Emerging Technologies and Developments
- Overview
- New Technologies
- Drone Technology
- Nanopesticides
- AI, IoT and Digital Transformation
Chapter 6 Market Segmentation Analysis
- Segmental Breakdown
- Market Analysis by Type
- Herbicides
- Insecticides
- Fungicides
- Others
- Market Analysis by Form
- Liquid
- Dry/Solid
- Market Analysis by Source
- Synthetic
- Natural/Bio-Based
- Market Analysis by Application Technique
- Foliage Spray
- Granular Application
- Seed Treatment
- Other Applications
- Market Analysis by Crop Type
- Cereals and Grains
- Fruits and Vegetables
- Oilseeds and Pulses
- Other Crop Types
- Geographic Breakdown
- Market Analysis by Region
- North America
- Europe, Middle East & Africa (EMEA)
- Asia-Pacific
- South America
Chapter 7 Competitive Intelligence
- Industry Structure
- Market Share Analysis
- Strategic Analysis
- Analysis of M&A Activity
Chapter 8 Sustainability in the Crop Protection Chemicals Industry: An ESG Perspective
- ESG Issues in the Crop Protection Chemical Sector
- ESG Performance Analysis
- Environmental Performance
- Social Performance
- Governance Performance
- Consumer Attitudes Towards ESG
- Concluding Remarks from BCC
Chapter 9 Appendix
- Methodology
- Sources
- References
- Definitions/Taxonomy
- Abbreviations
- Company Profiles
- ADAMA
- BASF SE
- BAYER AG
- CHR. HANSEN A/S
- CORTEVA
- FMC CORP.
- NUFARM
- SUMITOMO CHEMICAL CO. LTD.
- SYNGENTA
- UPL
