|
|
市場調査レポート
商品コード
1488648
ロゼワインの世界市場(2024年)Global Rose Wine Market Research Report 2024 |
||||||
|
|||||||
カスタマイズ可能
適宜更新あり
|
|||||||

| ロゼワインの世界市場(2024年) |
|
出版日: 2024年06月05日
発行: QYResearch
ページ情報: 英文 168 Pages
納期: 2~3営業日
|

全表示
- 概要
- 図表
- 目次
世界のロゼワインの市場規模は、2023年に118億920万米ドルであり、2030年までに146億7,010万米ドルに達すると予測され、2024年~2030年の予測期間にCAGRで3.08%の成長が見込まれます。
欧州市場は、2023年の85億4,200万米ドルから2030年までに104億4,580万米ドルに達すると推定され、予測期間のCAGRは2.86%です。
北米市場は、2023年の20億2,940万米ドルから2030年までに25億5,710万米ドルに達すると推定され、予測期間のCAGRは3.35%です。
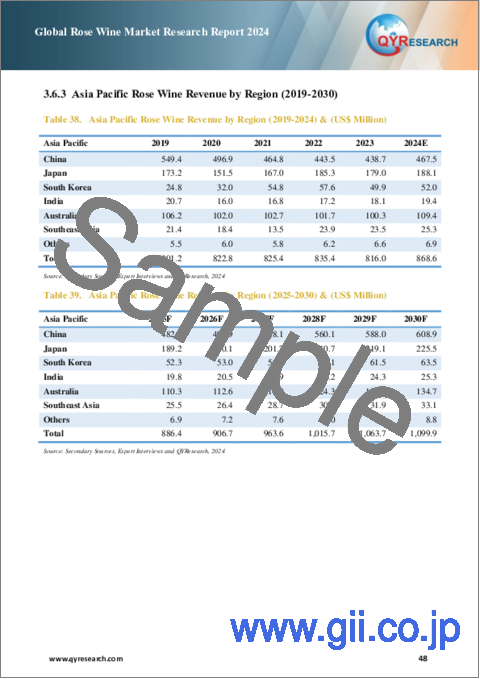
アジア太平洋市場は、2023年の8億1,600万米ドルから2030年までに10億9,990万米ドルに達すると推定され、予測期間のCAGRは4.01%です。
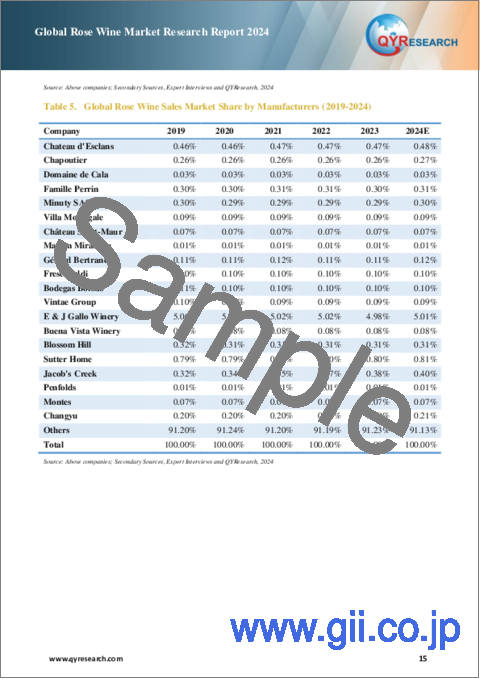
世界のロゼワインの主要メーカーは、E & J Gallo Winery、Sutter Home、Chateau d'Esclans、Minuty SAS、Blossom Hill、Famille Perrin、Jacob's Creek、Chapoutier、Vintae Group、Frescobaldiなどです。2023年、世界の上位3ベンダーが収益の約8.33%を占めました。
当レポートでは、世界のロゼワイン市場について調査分析し、各地域の市場規模と予測、競合情勢、主要企業のプロファイル、技術動向、新製品開発などの情報を提供しています。
目次
第1章 ロゼワイン市場の概要
- 製品定義
- ロゼワイン:タイプ別
- 世界のロゼワインの市場金額の比較:タイプ別(2024年~2030年)
- スティル
- スパークリング
- ロゼワイン:用途別
- 世界のロゼワインの市場金額:用途別(2024年~2030年)
- スーパーマーケット
- オンライン小売業者
- 独立小売業者
- その他
- 世界のロゼワインの市場規模の推計と予測
- 世界のロゼワインの収益(2019年~2030年)
- 世界のロゼワインの売上(2019年~2030年)
- 世界のロゼワイン市場の平均価格(2019年~2030年)
- 前提条件と制限
第2章 ロゼワイン市場の競合:メーカー別
- 世界のロゼワインの売上の市場シェア:メーカー別(2019年~2024年)
- 世界のロゼワインの収益の市場シェア:メーカー別(2019年~2024年)
- 世界のロゼワインの平均価格:メーカー別(2019年~2024年)
- 世界のロゼワインの主要企業、業界ランキング(2022年・2023年・2024年)
- 世界のロゼワインの主要メーカー、製造拠点と本社
- 世界のロゼワインの主要メーカー、製品タイプ
- 世界のロゼワインの主要メーカー、業界参入日
- 世界のロゼワイン市場の競合情勢と動向
- 世界のロゼワインの市場集中度
- 世界の5大・10大ロゼワイン企業の市場シェア(収益)
- 世界のロゼワインの市場シェア:企業タイプ別(Tier 1、Tier 2、Tier 3)
- メーカーの合併と買収、拡張計画
第3章 世界のロゼワイン市場のシナリオ:地域別
- 世界のロゼワインの市場規模:地域別(2019年・2023年・2030年)
- 世界のロゼワインの売上:地域別(2019年~2030年)
- 世界のロゼワインの売上:地域別(2019年~2024年)
- 世界のロゼワインの売上:地域別(2025年~2030年)
- 世界のロゼワインの収益:地域別(2019年~2030年)
- 世界のロゼワインの収益:地域別(2019年~2024年)
- 世界のロゼワインの収益:地域別(2025年~2030年)
- 北米のロゼワイン市場データと統計:国別
- 北米のロゼワインの市場規模:国別(2019年・2023年・2030年)
- 北米のロゼワインの売上:国別(2019年~2030年)
- 北米のロゼワインの収益:国別(2019年~2030年)
- 米国
- カナダ
- 欧州のロゼワイン市場データ:国別
- 欧州のロゼワインの市場規模:国別(2019年・2023年・2030年)
- 欧州のロゼワインの売上:国別(2019年~2030年)
- 欧州のロゼワインの収益:国別(2019年~2030年)
- フランス
- ドイツ
- 英国
- イタリア
- スペイン
- ベルギー
- オランダ
- ロシア
- アジア太平洋のロゼワイン市場データ:地域別
- アジア太平洋のロゼワインの市場規模:地域別(2019年・2023年・2030年)
- アジア太平洋のロゼワインの売上:地域別(2019年~2030年)
- アジア太平洋のロゼワインの収益:地域別(2019年~2030年)
- 中国
- 日本
- 韓国
- インド
- オーストラリア
- 東南アジア
- ラテンアメリカのロゼワイン市場データ:国別
- ラテンアメリカのロゼワインの市場規模:国別(2019年・2023年・2030年)
- ラテンアメリカのロゼワインの売上:国別(2019年~2030年)
- ラテンアメリカのロゼワインの収益:国別
- メキシコ
- ブラジル
- アルゼンチン
- 中東・アフリカのロゼワイン市場データ:国別
- 中東・アフリカのロゼワインの市場規模:国別(2019年・2023年・2030年)
- 中東・アフリカのロゼワインの売上:国別(2019年~2030年)
- 中東・アフリカのロゼワインの収益:国別
- GCC諸国
- 南アフリカ
第4章 セグメント:タイプ別
- 世界のロゼワインの売上数量:タイプ別(2019年~2030年)
- 世界のロゼワインの売上:タイプ別(2019年~2024年)
- 世界のロゼワインの売上:タイプ別(2025年~2030年)
- 世界のロゼワインの売上の市場シェア:タイプ別(2019年~2030年)
- 世界のロゼワインの収益:タイプ別(2019年~2030年)
- 世界のロゼワインの収益:タイプ別(2019年~2024年)
- 世界のロゼワインの収益:タイプ別(2025年~2030年)
- 世界のロゼワインの収益の市場シェア:タイプ別(2019年~2030年)
- 世界のロゼワインの価格:タイプ別(2019年~2030年)
第5章 セグメント:用途別
- 世界のロゼワインの売上:用途別(2019年~2030年)
- 世界のロゼワインの売上:用途別(2019年~2024年)
- 世界のロゼワインの売上:用途別(2025年~2030年)
- 世界のロゼワインの売上の市場シェア:用途別(2019年~2030年)
- 世界のロゼワインの収益:用途別(2019年~2030年)
- 世界のロゼワインの収益:用途別(2019年~2024年)
- 世界のロゼワインの収益:用途別(2025年~2030年)
- 世界のロゼワインの収益の市場シェア:用途別(2019年~2030年)
- 世界のロゼワインの価格:用途別(2019年~2030年)
第6章 主要企業のプロファイル
- Chateau d'Esclans
- Chapoutier
- Domaine de Cala
- Famille Perrin
- Minuty SAS
- Villa Moncigale
- Chateau Saint-Maur
- Maison Mirabeau
- Gerard Bertrand
- Frescobaldi
- Bodegas Borsao
- Vintae Group
- E & J Gallo Winery
- Buena Vista Winery
- Blossom Hill
- Sutter Home
- Jacob's Creek
- Penfolds
- Montes
- Changyu
第7章 産業チェーンと販売チャネルの分析
- ロゼワインの産業チェーン分析
- ロゼワインの主な原材料
- 主な原材料
- ブドウ栽培地
- ロゼワインの生産方式とプロセス
- ロゼワインの販売とマーケティング
- 販売チャネル
- ロゼワインの販売業者
第8章 ロゼワインの市場力学
- ロゼワイン産業の動向
- ロゼワイン市場の促進要因
- ロゼワイン市場の課題、抑制要因
第9章 調査結果と結論
第10章 調査手法とデータソース
List of Tables
- Table 1. Global Rose Wine Market Value Comparison by Type (2024-2030) & (US$ Million)
- Table 2. Global Rose Wine Market Value by Application (2024-2030) & (US$ Million)
- Table 3. Global Rose Wine Market Competitive Situation by Manufacturers in 2023
- Table 4. Global Rose Wine Sales (Million Liters) of Key Manufacturers (2019-2024)
- Table 5. Global Rose Wine Sales Market Share by Manufacturers (2019-2024)
- Table 6. Global Rose Wine Revenue (US$ Million) by Manufacturers (2019-2024)
- Table 7. Global Rose Wine Revenue Share by Manufacturers (2019-2024)
- Table 8. Global Market Rose Wine Average Price (US$/Liter) of Key Manufacturers (2019-2024)
- Table 9. Global Key Players of Rose Wine, Industry Ranking, 2022 VS 2023 VS 2024
- Table 10. Global Key Manufacturers of Rose Wine, Manufacturing Sites & Headquarters
- Table 11. Global Key Manufacturers of Rose Wine, Product Type
- Table 12. Global Key Manufacturers of Rose Wine, Date of Enter into This Industry
- Table 13. Global Manufacturers Market Concentration Ratio (CR5 and HHI)
- Table 14. Global Rose Wine by Company Type (Tier 1, Tier 2, and Tier 3) & (based on the Revenue in Rose Wine as of 2023)
- Table 15. Manufacturers Mergers & Acquisitions, Expansion Plans
- Table 16. Global Rose Wine Market Size by Region (US$ Million): 2019 VS 2023 VS 2030
- Table 17. Global Rose Wine Sales by Region (2019-2024) & (Million Liters)
- Table 18. Global Rose Wine Sales Market Share by Region (2019-2024)
- Table 19. Global Rose Wine Sales by Region (2025-2030) & (Million Liters)
- Table 20. Global Rose Wine Sales Market Share by Region (2025-2030)
- Table 21. Global Rose Wine Revenue by Region (2019-2024) & (US$ Million)
- Table 22. Global Rose Wine Revenue Market Share by Region (2019-2024)
- Table 23. Global Rose Wine Revenue by Region (2025-2030) & (US$ Million)
- Table 24. Global Rose Wine Revenue Market Share by Region (2025-2030)
- Table 25. North America Rose Wine Revenue by Country: 2019 VS 2023 VS 2030 (US$ Million)
- Table 26. North America Rose Wine Sales by Country (2019-2024) & (Million Liters)
- Table 27. North America Rose Wine Sales by Country (2025-2030) & (Million Liters)
- Table 28. North America Rose Wine Revenue by Country (2019-2024) & (US$ Million)
- Table 29. North America Rose Wine Revenue by Country (2025-2030) & (US$ Million)
- Table 30. Europe Rose Wine Revenue by Country: 2019 VS 2023 VS 2030 (US$ Million)
- Table 31. Europe Rose Wine Sales by Country (2019-2024) & (Million Liters)
- Table 32. Europe Rose Wine Sales by Country (2025-2030) & (Million Liters)
- Table 33. Europe Rose Wine Revenue by Country (2019-2024) & (US$ Million)
- Table 34. Europe Rose Wine Revenue by Country (2025-2030) & (US$ Million)
- Table 35. Asia Pacific Rose Wine Revenue by Region: 2019 VS 2023 VS 2030 (US$ Million)
- Table 36. Asia Pacific Rose Wine Sales by Region (2019-2024) & (Million Liters)
- Table 37. Asia Pacific Rose Wine Sales by Region (2025-2030) & (Million Liters)
- Table 38. Asia Pacific Rose Wine Revenue by Region (2019-2024) & (US$ Million)
- Table 39. Asia Pacific Rose Wine Revenue by Region (2025-2030) & (US$ Million)
- Table 40. Latin America Rose Wine Revenue by Country: 2019 VS 2023 VS 2030 (US$ Million)
- Table 41. Latin America Rose Wine Sales by Country (2019-2024) & (Million Liters)
- Table 42. Latin America Rose Wine Sales by Country (2025-2030) & (Million Liters)
- Table 43. Latin America Rose Wine Revenue by Country (2019-2024) & (US$ Million)
- Table 44. Latin America Rose Wine Revenue by Country (2025-2030)
- Table 45. Middle East and Africa Rose Wine Revenue by Country: 2019 VS 2023 VS 2030 (US$ Million)
- Table 46. Middle East and Africa Rose Wine Sales by Country (2019-2024) & (Million Liters)
- Table 47. Middle East and Africa Rose Wine Sales by Country (2025-2030) & (Million Liters)
- Table 48. Middle East and Africa Rose Wine Revenue by Country (2019-2024) & (US$ Million)
- Table 49. Middle East and Africa Rose Wine Revenue by Country (2025-2030) & (US$ Million)
- Table 50. Global Rose Wine Sales (Million Liters) by Type (2019-2024)
- Table 51. Global Rose Wine Sales (Million Liters) by Type (2025-2030)
- Table 52. Global Rose Wine Sales Market Share by Type (2019-2024)
- Table 53. Global Rose Wine Sales Market Share by Type (2025-2030)
- Table 54. Global Rose Wine Revenue (US$ Million) by Type (2019-2024)
- Table 55. Global Rose Wine Revenue (US$ Million) by Type (2025-2030)
- Table 56. Global Rose Wine Revenue Market Share by Type (2019-2024)
- Table 57. Global Rose Wine Revenue Market Share by Type (2025-2030)
- Table 58. Global Rose Wine Price (US$/Liter) by Type (2019-2024)
- Table 59. Global Rose Wine Price (US$/Liter) by Type (2025-2030)
- Table 60. Global Rose Wine Sales (Million Liters) by Application (2019-2024)
- Table 61. Global Rose Wine Sales (Million Liters) by Application (2025-2030)
- Table 62. Global Rose Wine Sales Market Share by Application (2019-2024)
- Table 63. Global Rose Wine Sales Market Share by Application (2025-2030)
- Table 64. Global Rose Wine Revenue (US$ Million) by Application (2019-2024)
- Table 65. Global Rose Wine Revenue (US$ Million) by Application (2025-2030)
- Table 66. Global Rose Wine Revenue Market Share by Application (2019-2024)
- Table 67. Global Rose Wine Revenue Market Share by Application (2025-2030)
- Table 68. Global Rose Wine Price (US$/Liter) by Application (2019-2024)
- Table 69. Global Rose Wine Price (US$/Liter) by Application (2025-2030)
- Table 70. Chateau d'Esclans Company Information
- Table 71. Chateau d'Esclans Description and Business Overview
- Table 72. Chateau d'Esclans Rose Wine Sales (Million Liters), Revenue (US$ Million), Price (US$/Liter) and Gross Margin (2019-2024)
- Table 73. Chateau d'Esclans Rose Wine Product
- Table 74. Chateau d'Esclans Recent Developments/Updates
- Table 75. Chapoutier Company Information
- Table 76. Chapoutier Description and Business Overview
- Table 77. Chapoutier Rose Wine Sales (Million Liters), Revenue (US$ Million), Price (US$/Liter) and Gross Margin (2019-2024)
- Table 78. Chapoutier Rose Wine Product
- Table 79. Domaine de Cala Company Information
- Table 80. Domaine de Cala Description and Business Overview
- Table 81. Domaine de Cala Rose Wine Sales (Million Liters), Revenue (US$ Million), Price (US$/Liter) and Gross Margin (2019-2024)
- Table 82. Domaine de Cala Rose Wine Product
- Table 83. Famille Perrin Company Information
- Table 84. Famille Perrin Description and Business Overview
- Table 85. Famille Perrin Rose Wine Sales (Million Liters), Revenue (US$ Million), Price (US$/Liter) and Gross Margin (2019-2024)
- Table 86. Famille Perrin Rose Wine Product
- Table 87. Minuty SAS Company Information
- Table 88. Minuty SAS Description and Business Overview
- Table 89. Minuty SAS Rose Wine Sales (Million Liters), Revenue (US$ Million), Price (US$/Liter) and Gross Margin (2019-2024)
- Table 90. Minuty SAS Rose Wine Product
- Table 91. Villa Moncigale Company Information
- Table 92. Villa Moncigale Description and Business Overview
- Table 93. Villa Moncigale Rose Wine Sales (Million Liters), Revenue (US$ Million), Price (US$/Liter) and Gross Margin (2019-2024)
- Table 94. Villa Moncigale Rose Wine Product
- Table 95. Chateau Saint-Maur Company Information
- Table 96. Chateau Saint-Maur Description and Business Overview
- Table 97. Chateau Saint-Maur Rose Wine Sales (Million Liters), Revenue (US$ Million), Price (US$/Liter) and Gross Margin (2019-2024)
- Table 98. Chateau Saint-Maur Rose Wine Product
- Table 99. Maison Mirabeau Company Information
- Table 100. Maison Mirabeau Description and Business Overview
- Table 101. Maison Mirabeau Rose Wine Sales (Million Liters), Revenue (US$ Million), Price (US$/Liter) and Gross Margin (2019-2024)
- Table 102. Maison Mirabeau Rose Wine Product
- Table 103. Gerard Bertrand Company Information
- Table 104. Gerard Bertrand Description and Business Overview
- Table 105. Gerard Bertrand Rose Wine Sales (Million Liters), Revenue (US$ Million), Price (US$/Liter) and Gross Margin (2019-2024)
- Table 106. Gerard Bertrand Rose Wine Product
- Table 107. Frescobaldi Company Information
- Table 108. Frescobaldi Description and Business Overview
- Table 109. Frescobaldi Rose Wine Sales (Million Liters), Revenue (US$ Million), Price (US$/Liter) and Gross Margin (2019-2024)
- Table 110. Frescobaldi Rose Wine Product
- Table 111. Bodegas Borsao Company Information
- Table 112. Bodegas Borsao Description and Business Overview
- Table 113. Bodegas Borsao Rose Wine Sales (Million Liters), Revenue (US$ Million), Price (US$/Liter) and Gross Margin (2019-2024)
- Table 114. Bodegas Borsao Rose Wine Product
- Table 115. Vintae Group Company Information
- Table 116. Vintae Group Description and Business Overview
- Table 117. Vintae Group Rose Wine Sales (Million Liters), Revenue (US$ Million), Price (US$/Liter) and Gross Margin (2019-2024)
- Table 118. Vintae Group Rose Wine Product
- Table 119. E & J Gallo Winery Company Information
- Table 120. E & J Gallo Winery Description and Business Overview
- Table 121. E & J Gallo Winery Rose Wine Sales (Million Liters), Revenue (US$ Million), Price (US$/Liter) and Gross Margin (2019-2024)
- Table 122. E & J Gallo Winery Rose Wine Product
- Table 123. Buena Vista Winery Company Information
- Table 124. Buena Vista Winery Description and Business Overview
- Table 125. Buena Vista Winery Rose Wine Sales (Million Liters), Revenue (US$ Million), Price (US$/Liter) and Gross Margin (2019-2024)
- Table 126. Buena Vista Winery Rose Wine Product
- Table 127. Blossom Hill Company Information
- Table 128. Blossom Hill Description and Business Overview
- Table 129. Blossom Hill Rose Wine Sales (Million Liters), Revenue (US$ Million), Price (US$/Liter) and Gross Margin (2019-2024)
- Table 130. Blossom Hill Rose Wine Product
- Table 131. Sutter Home Company Information
- Table 132. Sutter Home Description and Business Overview
- Table 133. Sutter Home Rose Wine Sales (Million Liters), Revenue (US$ Million), Price (US$/Liter) and Gross Margin (2019-2024)
- Table 134. Sutter Home Rose Wine Product
- Table 135. Jacob's Creek Company Information
- Table 136. Jacob's Creek Description and Business Overview
- Table 137. Jacob's Creek Rose Wine Sales (Million Liters), Revenue (US$ Million), Price (US$/Liter) and Gross Margin (2019-2024)
- Table 138. Jacob's Creek Rose Wine Product
- Table 139. Penfolds Company Information
- Table 140. Penfolds Description and Business Overview
- Table 141. Penfolds Rose Wine Sales (Million Liters), Revenue (US$ Million), Price (US$/Liter) and Gross Margin (2019-2024)
- Table 142. Penfolds Rose Wine Product
- Table 143. Montes Company Information
- Table 144. Montes Description and Business Overview
- Table 145. Montes Rose Wine Sales (Million Liters), Revenue (US$ Million), Price (US$/Liter) and Gross Margin (2019-2024)
- Table 146. Montes Rose Wine Product
- Table 147. Changyu Company Information
- Table 148. Changyu Description and Business Overview
- Table 149. Changyu Rose Wine Sales (Million Liters), Revenue (US$ Million), Price (US$/Liter) and Gross Margin (2019-2024)
- Table 150. Changyu Rose Wine Product
- Table 151. Rose Wine Distributors List
- Table 152. Rose Wine Market Drivers
- Table 153. Rose Wine Market Challenges & Restraints
- Table 154. Research Programs/Design for This Report
- Table 155. Key Data Information from Secondary Sources
- Table 156. Key Data Information from Primary Sources
- Table 157. Authors List of This Report
List of Figures
- Figure 1. Product Picture of Rose Wine
- Figure 2. Global Rose Wine Market Value Comparison by Type (2019-2030) & (US$ Million)
- Figure 3. Global Rose Wine Market Share by Type: 2023 & 2030
- Figure 4. Still Product Picture
- Figure 5. Sparkling Product Picture
- Figure 6. Global Rose Wine Market Value by Application (2019-2030) & (US$ Million)
- Figure 7. Global Rose Wine Market Share by Application: 2023 & 2030
- Figure 8. Supermarkets
- Figure 9. Global Rose Wine Revenue, (US$ Million), 2019 VS 2023 VS 2030
- Figure 10. Global Rose Wine Market Size (2019-2030) & (US$ Million)
- Figure 11. Global Rose Wine Sales (2019-2030) & (Million Liters)
- Figure 12. Global Rose Wine Average Price (US$/Liter) & (2019-2030)
- Figure 13. Rose Wine Report Years Considered
- Figure 14. Rose Wine Sales Share by Manufacturers in 2023
- Figure 15. Global Rose Wine Revenue Share by Manufacturers in 2023
- Figure 16. Global 5 and 10 Largest Rose Wine Players: Market Share by Revenue in Rose Wine in 2023
- Figure 17. Rose Wine Market Share by Company Type (Tier 1, Tier 2, and Tier 3) in 2023
- Figure 18. Global Rose Wine Market Size by Region (US$ Million): 2019-2030
- Figure 19. North America Rose Wine Sales Market Share by Country (2019-2030)
- Figure 20. North America Rose Wine Revenue Market Share by Country (2019-2030)
- Figure 21. United States Rose Wine Revenue Growth Rate (2019-2030) & (US$ Million)
- Figure 22. Canada Rose Wine Revenue Growth Rate (2019-2030) & (US$ Million)
- Figure 23. Europe Rose Wine Sales Market Share by Country (2019-2030)
- Figure 24. Europe Rose Wine Revenue Market Share by Country (2019-2030)
- Figure 25. France Rose Wine Revenue Growth Rate (2019-2030) & (US$ Million)
- Figure 26. Germany Rose Wine Revenue Growth Rate (2019-2030) & (US$ Million)
- Figure 27. U.K. Rose Wine Revenue Growth Rate (2019-2030) & (US$ Million)
- Figure 28. Italy Rose Wine Revenue Growth Rate (2019-2030) & (US$ Million)
- Figure 29. Spain Rose Wine Revenue Growth Rate (2019-2030) & (US$ Million)
- Figure 30. Belgium Rose Wine Revenue Growth Rate (2019-2030) & (US$ Million)
- Figure 31. Netherlands Rose Wine Revenue Growth Rate (2019-2030) & (US$ Million)
- Figure 32. Russia Rose Wine Revenue Growth Rate (2019-2030) & (US$ Million)
- Figure 33. Asia Pacific Rose Wine Sales Market Share by Region (2019-2030)
- Figure 34. Asia Pacific Rose Wine Revenue Market Share by Region (2019-2030)
- Figure 35. China Rose Wine Revenue Growth Rate (2019-2030) & (US$ Million)
- Figure 36. Japan Rose Wine Revenue Growth Rate (2019-2030) & (US$ Million)
- Figure 37. South Korea Rose Wine Revenue Growth Rate (2019-2030) & (US$ Million)
- Figure 38. India Rose Wine Revenue Growth Rate (2019-2030) & (US$ Million)
- Figure 39. Australia Rose Wine Revenue Growth Rate (2019-2030) & (US$ Million)
- Figure 40. Southeast Asia Rose Wine Revenue Growth Rate (2019-2030) & (US$ Million)
- Figure 41. Latin America Rose Wine Sales Market Share by Country (2019-2030)
- Figure 42. Latin America Rose Wine Revenue Market Share by Region (2019-2030)
- Figure 43. Mexico Rose Wine Revenue Growth Rate (2019-2030) & (US$ Million)
- Figure 44. Brazil Rose Wine Revenue Growth Rate (2019-2030) & (US$ Million)
- Figure 45. Argentina Rose Wine Revenue Growth Rate (2019-2030) & (US$ Million)
- Figure 46. Middle East and Africa Rose Wine Sales Market Share by Country (2019-2030)
- Figure 47. Middle East and Africa Rose Wine Revenue Market Share by Country (2019-2030)
- Figure 48. GCC Countries Rose Wine Revenue Growth Rate (2019-2030) & (US$ Million)
- Figure 49. South Africa Rose Wine Revenue Growth Rate (2019-2030) & (US$ Million)
- Figure 50. Global Sales Market Share of Rose Wine by Type (2019-2030)
- Figure 51. Global Revenue Market Share of Rose Wine by Type (2019-2030)
- Figure 52. Global Rose Wine Price (US$/Liter) by Type (2019-2030)
- Figure 53. Global Sales Market Share of Rose Wine by Application (2019-2030)
- Figure 54. Global Revenue Market Share of Rose Wine by Application (2019-2030)
- Figure 55. Global Rose Wine Price (US$/Liter) by Application (2019-2030)
- Figure 56. Evolution of the world vineyard surface area
- Figure 57. Rose WineProduction - Maceration Method
- Figure 58. Channels of Distribution
- Figure 59. Bottom-up and Top-down Approaches for This Report
- Figure 60. Data Triangulation
- Figure 61. Key Executives Interviewed
The global Rose Wine market was valued at US$ 11,809.2 million in 2023 and is anticipated to reach US$ 14,670.1 million by 2030, witnessing a CAGR of 3.08% during the forecast period 2024-2030.
Europe market for Rose Wine is estimated to increase from US$ 8,542.0 million in 2023 to reach US$ 10,445.8 million by 2030, at a CAGR of 2.86% during the forecast period of 2024 through 2030.
North American market for Rose Wine is estimated to increase from US$ 2,029.4 million in 2023 to reach US$ 2,557.1 million by 2030, at a CAGR of 3.35% during the forecast period of 2024 through 2030.
Asia-Pacific market for Rose Wine is estimated to increase from US$ 816.0 million in 2023 to reach US$ 1,099.9 million by 2030, at a CAGR of 4.01% during the forecast period of 2024 through 2030.
The major global manufacturers of Rose Wine include E & J Gallo Winery, Sutter Home, Chateau d'Esclans, Minuty SAS, Blossom Hill, Famille Perrin, Jacob's Creek, Chapoutier, Vintae Group, Frescobaldi, etc. In 2023, the world's top three vendors accounted for approximately 8.33% of the revenue.
This report aims to provide a comprehensive presentation of the global market for Rose Wine, with both quantitative and qualitative analysis, to help readers develop business/growth strategies, assess the market competitive situation, analyze their position in the current marketplace, and make informed business decisions regarding Rose Wine.
The Rose Wine market size, estimations, and forecasts are provided in terms of sales volume (Million Liters) and revenue ($ millions), considering 2023 as the base year, with history and forecast data for the period from 2019 to 2030. This report segments the global Rose Wine market comprehensively. Regional market sizes, concerning products by Type, by Application, and by players, are also provided.
For a more in-depth understanding of the market, the report provides profiles of the competitive landscape, key competitors, and their respective market ranks. The report also discusses technological trends and new product developments.
The report will help the Rose Wine manufacturers, new entrants, and industry chain related companies in this market with information on the revenues, sales volume, and average price for the overall market and the sub-segments across the different segments, by company, by Type, by Application, and by regions.
Market Segmentation
By Company
- Chateau d'Esclans
- Chapoutier
- Domaine de Cala
- Famille Perrin
- Minuty SAS
- Villa Moncigale
- Chateau Saint-Maur
- Maison Mirabeau
- Gerard Bertrand
- Frescobaldi
- Bodegas Borsao
- Vintae Group
- E & J Gallo Winery
- Buena Vista Winery
- Blossom Hill
- Sutter Home
- Jacob's Creek
- Penfolds
- Montes
- Changyu
Segment by Type
- Still
- Sparkling
Segment by Application
- Supermarkets
- Online Retailers
- Independent Retailers
- Others
Consumption by Region
- North America
- U.S.
- Canada
- Asia-Pacific
- China
- Japan
- South Korea
- India
- Australia
- Southeast Asia
- Others
- Europe
- France
- Germany
- UK
- Italy
- Spain
- Belgium
- Netherlands
- Russia
- Others
- Latin America
- Mexico
- Brazil
- Argentina
- Others
- Middle East and Africa
- GCC Countries
- South Africa
- Others
Chapter Outline
Chapter 1: Introduces the report scope of the report, executive summary of different market segments (by region, product type, application, etc), including the market size of each market segment, future development potential, and so on. It offers a high-level view of the current state of the market and its likely evolution in the short to mid-term, and long term.
Chapter 2: Detailed analysis of Rose Wine manufacturers competitive landscape, price, sales and revenue market share, latest development plan, merger, and acquisition information, etc.
Chapter 3: Sales, revenue of Rose Wine in regional level and country level. It provides a quantitative analysis of the market size and development potential of each region and its main countries and introduces the market development, future development prospects, market space, and market size of each country in the world.
Chapter 4: Provides the analysis of various market segments by Type, covering the market size and development potential of each market segment, to help readers find the blue ocean market in different market segments.
Chapter 5: Provides the analysis of various market segments by Application, covering the market size and development potential of each market segment, to help readers find the blue ocean market in different downstream markets.
Chapter 6: Provides profiles of key players, introducing the basic situation of the main companies in the market in detail, including product sales, revenue, price, gross margin, product introduction, recent development, etc.
Chapter 7: Analysis of industrial chain, including the upstream and downstream of the industry.
Chapter 8: Introduces the market dynamics, latest developments of the market, the driving factors and restrictive factors of the market, the challenges and risks faced by manufacturers in the industry, and the analysis of relevant policies in the industry.
Chapter 9: The main points and conclusions of the report.
Table of Contents
1 Rose Wine Market Overview
- 1.1 Product Definition
- 1.2 Rose Wine by Type
- 1.2.1 Global Rose Wine Market Value Comparison by Type (2024-2030)
- 1.2.2 Still
- 1.2.3 Sparkling
- 1.3 Rose Wine by Application
- 1.3.1 Global Rose Wine Market Value by Application (2024-2030)
- 1.3.2 Supermarkets
- 1.3.3 Online Retailers
- 1.3.4 Independent Retailers
- 1.3.5 Others
- 1.4 Global Rose Wine Market Size Estimates and Forecasts
- 1.4.1 Global Rose Wine Revenue 2019-2030
- 1.4.2 Global Rose Wine Sales 2019-2030
- 1.4.3 Global Rose Wine Market Average Price (2019-2030)
- 1.5 Assumptions and Limitations
2 Rose Wine Market Competition by Manufacturers
- 2.1 Global Rose Wine Sales Market Share by Manufacturers (2019-2024)
- 2.2 Global Rose Wine Revenue Market Share by Manufacturers (2019-2024)
- 2.3 Global Rose Wine Average Price by Manufacturers (2019-2024)
- 2.4 Global Key Players of Rose Wine, Industry Ranking, 2022 VS 2023 VS 2024
- 2.5 Global Key Manufacturers of Rose Wine, Manufacturing Sites & Headquarters
- 2.6 Global Key Manufacturers of Rose Wine, Product Type
- 2.7 Global Key Manufacturers of Rose Wine, Date of Enter into This Industry
- 2.8 Global Rose Wine Market Competitive Situation and Trends
- 2.8.1 Global Rose Wine Market Concentration Rate
- 2.8.2 The Global 5 and 10 Largest Rose Wine Players Market Share by Revenue
- 2.8.3 Global Rose Wine Market Share by Company Type (Tier 1, Tier 2, and Tier 3)
- 2.9 Manufacturers Mergers & Acquisitions, Expansion Plans
3 Global Rose Wine Market Scenario by Region
- 3.1 Global Rose Wine Market Size by Region: 2019 Versus 2023 Versus 2030
- 3.2 Global Rose Wine Sales by Region: 2019-2030
- 3.2.1 Global Rose Wine Sales by Region: 2019-2024
- 3.2.2 Global Rose Wine Sales by Region: 2025-2030
- 3.3 Global Rose Wine Revenue by Region: 2019-2030
- 3.3.1 Global Rose Wine Revenue by Region: 2019-2024
- 3.3.2 Global Rose Wine Revenue by Region: 2025-2030
- 3.4 North America Rose Wine Market Facts & Figures by Country
- 3.4.1 North America Rose Wine Market Size by Country: 2019 VS 2023 VS 2030
- 3.4.2 North America Rose Wine Sales by Country (2019-2030)
- 3.4.3 North America Rose Wine Revenue by Country (2019-2030)
- 3.4.4 United States
- 3.4.5 Canada
- 3.5 Europe Rose Wine Market Facts & Figures by Country
- 3.5.1 Europe Rose Wine Market Size by Country: 2019 VS 2023 VS 2030
- 3.5.2 Europe Rose Wine Sales by Country (2019-2030)
- 3.5.3 Europe Rose Wine Revenue by Country (2019-2030)
- 3.5.4 France
- 3.5.5 Germany
- 3.5.6 U.K.
- 3.5.7 Italy
- 3.5.8 Spain
- 3.5.9 Belgium
- 3.5.10 Netherlands
- 3.5.11 Russia
- 3.6 Asia Pacific Rose Wine Market Facts & Figures by Region
- 3.6.1 Asia Pacific Rose Wine Market Size by Region: 2019 VS 2023 VS 2030
- 3.6.2 Asia Pacific Rose Wine Sales by Region (2019-2030)
- 3.6.3 Asia Pacific Rose Wine Revenue by Region (2019-2030)
- 3.6.4 China
- 3.6.5 Japan
- 3.6.6 South Korea
- 3.6.7 India
- 3.6.8 Australia
- 3.6.9 Southeast Asia
- 3.7 Latin America Rose Wine Market Facts & Figures by Country
- 3.7.1 Latin America Rose Wine Market Size by Country: 2019 VS 2023 VS 2030
- 3.7.2 Latin America Rose Wine Sales by Country (2019-2030)
- 3.7.3 Latin America Rose Wine Revenue by Country
- 3.7.4 Mexico
- 3.7.5 Brazil
- 3.7.6 Argentina
- 3.8 Middle East and Africa Rose Wine Market Facts & Figures by Country
- 3.8.1 Middle East and Africa Rose Wine Market Size by Country: 2019 VS 2023 VS 2030
- 3.8.2 Middle East and Africa Rose Wine Sales by Country (2019-2030)
- 3.8.3 Middle East and Africa Rose Wine Revenue by Country
- 3.8.4 GCC Countries
- 3.8.5 South Africa
4 Segment by Type
- 4.1 Global Rose Wine Sales by Type (2019-2030)
- 4.1.1 Global Rose Wine Sales by Type (2019-2024)
- 4.1.2 Global Rose Wine Sales by Type (2025-2030)
- 4.1.3 Global Rose Wine Sales Market Share by Type (2019-2030)
- 4.2 Global Rose Wine Revenue by Type (2019-2030)
- 4.2.1 Global Rose Wine Revenue by Type (2019-2024)
- 4.2.2 Global Rose Wine Revenue by Type (2025-2030)
- 4.2.3 Global Rose Wine Revenue Market Share by Type (2019-2030)
- 4.3 Global Rose Wine Price by Type (2019-2030)
5 Segment by Application
- 5.1 Global Rose Wine Sales by Application (2019-2030)
- 5.1.1 Global Rose Wine Sales by Application (2019-2024)
- 5.1.2 Global Rose Wine Sales by Application (2025-2030)
- 5.1.3 Global Rose Wine Sales Market Share by Application (2019-2030)
- 5.2 Global Rose Wine Revenue by Application (2019-2030)
- 5.2.1 Global Rose Wine Revenue by Application (2019-2024)
- 5.2.2 Global Rose Wine Revenue by Application (2025-2030)
- 5.2.3 Global Rose Wine Revenue Market Share by Application (2019-2030)
- 5.3 Global Rose Wine Price by Application (2019-2030)
6 Key Companies Profiled
- 6.1 Chateau d'Esclans
- 6.1.1 Chateau d'Esclans Company Information
- 6.1.2 Chateau d'Esclans Description and Business Overview
- 6.1.3 Chateau d'Esclans Rose Wine Sales, Revenue and Gross Margin (2019-2024)
- 6.1.4 Chateau d'Esclans Rose Wine Product Portfolio
- 6.1.5 Chateau d'Esclans Recent Developments/Updates
- 6.2 Chapoutier
- 6.2.1 Chapoutier Company Information
- 6.2.2 Chapoutier Description and Business Overview
- 6.2.3 Chapoutier Rose Wine Sales, Revenue and Gross Margin (2019-2024)
- 6.2.4 Chapoutier Rose Wine Product Portfolio
- 6.3 Domaine de Cala
- 6.3.1 Domaine de Cala Company Information
- 6.3.2 Domaine de Cala Description and Business Overview
- 6.3.3 Domaine de Cala Rose Wine Sales, Revenue and Gross Margin (2019-2024)
- 6.3.4 Domaine de Cala Rose Wine Product Portfolio
- 6.4 Famille Perrin
- 6.4.1 Famille Perrin Company Information
- 6.4.2 Famille Perrin Description and Business Overview
- 6.4.3 Famille Perrin Rose Wine Sales, Revenue and Gross Margin (2019-2024)
- 6.4.4 Famille Perrin Rose Wine Product Portfolio
- 6.5 Minuty SAS
- 6.5.1 Minuty SAS Company Information
- 6.5.2 Minuty SAS Description and Business Overview
- 6.5.3 Minuty SAS Rose Wine Sales, Revenue and Gross Margin (2019-2024)
- 6.5.4 Minuty SAS Rose Wine Product Portfolio
- 6.6 Villa Moncigale
- 6.6.1 Villa Moncigale Company Information
- 6.6.2 Villa Moncigale Description and Business Overview
- 6.6.3 Villa Moncigale Rose Wine Sales, Revenue and Gross Margin (2019-2024)
- 6.6.4 Villa Moncigale Rose Wine Product Portfolio
- 6.7 Chateau Saint-Maur
- 6.7.1 Chateau Saint-Maur Company Information
- 6.7.2 Chateau Saint-Maur Description and Business Overview
- 6.7.3 Chateau Saint-Maur Rose Wine Sales, Revenue and Gross Margin (2019-2024)
- 6.7.4 Chateau Saint-Maur Rose Wine Product Portfolio
- 6.8 Maison Mirabeau
- 6.8.1 Maison Mirabeau Company Information
- 6.8.2 Maison Mirabeau Description and Business Overview
- 6.8.3 Maison Mirabeau Rose Wine Sales, Revenue and Gross Margin (2019-2024)
- 6.8.4 Maison Mirabeau Rose Wine Product Portfolio
- 6.9 Gerard Bertrand
- 6.9.1 Gerard Bertrand Company Information
- 6.9.2 Gerard Bertrand Description and Business Overview
- 6.9.3 Gerard Bertrand Rose Wine Sales, Revenue and Gross Margin (2019-2024)
- 6.9.4 Gerard Bertrand Rose Wine Product Portfolio
- 6.10 Frescobaldi
- 6.10.1 Frescobaldi Company Information
- 6.10.2 Frescobaldi Description and Business Overview
- 6.10.3 Frescobaldi Rose Wine Sales, Revenue and Gross Margin (2019-2024)
- 6.10.4 Frescobaldi Rose Wine Product Portfolio
- 6.11 Bodegas Borsao
- 6.11.1 Bodegas Borsao Company Information
- 6.11.2 Bodegas Borsao Description and Business Overview
- 6.11.3 Bodegas Borsao Rose Wine Sales, Revenue and Gross Margin (2019-2024)
- 6.11.4 Bodegas Borsao Rose Wine Product Portfolio
- 6.12 Vintae Group
- 6.12.1 Vintae Group Company Information
- 6.12.2 Vintae Group Description and Business Overview
- 6.12.3 Vintae Group Rose Wine Sales, Revenue and Gross Margin (2019-2024)
- 6.12.4 Vintae Group Rose Wine Product Portfolio
- 6.13 E & J Gallo Winery
- 6.13.1 E & J Gallo Winery Company Information
- 6.13.2 E & J Gallo Winery Description and Business Overview
- 6.13.3 E & J Gallo Winery Rose Wine Sales, Revenue and Gross Margin (2019-2024)
- 6.13.4 E & J Gallo Winery Rose Wine Product Portfolio
- 6.14 Buena Vista Winery
- 6.14.1 Buena Vista Winery Company Information
- 6.14.2 Buena Vista Winery Description and Business Overview
- 6.14.3 Buena Vista Winery Rose Wine Sales, Revenue and Gross Margin (2019-2024)
- 6.14.4 Buena Vista Winery Rose Wine Product Portfolio
- 6.15 Blossom Hill
- 6.15.1 Blossom Hill Company Information
- 6.15.2 Blossom Hill Description and Business Overview
- 6.15.3 Blossom Hill Rose Wine Sales, Revenue and Gross Margin (2019-2024)
- 6.15.4 Blossom Hill Rose Wine Product Portfolio
- 6.16 Sutter Home
- 6.16.1 Sutter Home Company Information
- 6.16.2 Sutter Home Description and Business Overview
- 6.16.3 Sutter Home Rose Wine Sales, Revenue and Gross Margin (2019-2024)
- 6.16.4 Sutter Home Rose Wine Product Portfolio
- 6.17 Jacob's Creek
- 6.17.1 Jacob's Creek Company Information
- 6.17.2 Jacob's Creek Description and Business Overview
- 6.17.3 Jacob's Creek Rose Wine Sales, Revenue and Gross Margin (2019-2024)
- 6.17.4 Jacob's Creek Rose Wine Product Portfolio
- 6.18 Penfolds
- 6.18.1 Penfolds Company Information
- 6.18.2 Penfolds Description and Business Overview
- 6.18.3 Penfolds Rose Wine Sales, Revenue and Gross Margin (2019-2024)
- 6.18.4 Penfolds Rose Wine Product Portfolio
- 6.19 Montes
- 6.19.1 Montes Company Information
- 6.19.2 Montes Description and Business Overview
- 6.19.3 Montes Rose Wine Sales, Revenue and Gross Margin (2019-2024)
- 6.19.4 Montes Rose Wine Product Portfolio
- 6.20 Changyu
- 6.20.1 Changyu Company Information
- 6.20.2 Changyu Description and Business Overview
- 6.20.3 Changyu Rose Wine Sales, Revenue and Gross Margin (2019-2024)
- 6.20.4 Changyu Rose Wine Product Portfolio
7 Industry Chain and Sales Channels Analysis
- 7.1 Rose Wine Industry Chain Analysis
- 7.2 Rose Wine Key Raw Materials
- 7.2.1 Key Raw Materials
- 7.2.2 Grape Planting Area
- 7.3 Rose Wine Production Mode & Process
- 7.4 Rose Wine Sales and Marketing
- 7.4.1 Sales Channel
- 7.4.2 Rose Wine Distributors
8 Rose Wine Market Dynamics
- 8.1 Rose Wine Industry Trends
- 8.2 Rose Wine Market Drivers
- 8.3 Rose Wine Market Challenges & Restraints
9 Research Findings and Conclusion
10 Methodology and Data Source
- 10.1 Methodology/Research Approach
- 10.1.1 Research Programs/Design
- 10.1.2 Market Size Estimation
- 10.1.3 Market Breakdown and Data Triangulation
- 10.2 Data Source
- 10.2.1 Secondary Sources
- 10.2.2 Primary Sources
- 10.3 Author List
- 10.4 Disclaimer
